×
  • Cat-intel
  • MedIntelliX
  • Resources
  • About Us
  • Hero Background
    English
    Chinese
    French
    Japanese
    Korean
    German
    Spanish

    Pea Protein Market Analysis

    ID: MRFR/F-B & N/9359-HCR
    200 Pages
    Snehal Singh
    October 2025

    Pea Protein Market Research Report By Application (Food Beverages, Nutritional Supplements, Animal Feed, Cosmetics, Pharmaceuticals), By Form (Isolates, Concentrates, Textured Pea Protein), By Source (Yellow Pea, Green Pea, Other Peas), By End Use (Vegan Products, Gluten-Free Products, Meat Alternatives) and By Regional (North America, Europe, South America, Asia Pacific, Middle East and Africa...

    Share:
    Download PDF ×

    We do not share your information with anyone. However, we may send you emails based on your report interest from time to time. You may contact us at any time to opt-out.

    Pea Protein Market Infographic
    Purchase Options

    Market Analysis

    In-depth Analysis of Pea Protein Market Industry Landscape

    The pea protein market may be characterized as a distinct transaction including several components that collectively influence its growth and development. The increasing need for plant-based protein sources, which is being fuelled by growing wellness awareness and an increasing number of consumers adopting vegetarian and vegan eating patterns, is a major factor driving this market. Pea protein, which comes from yellow peas, has become more well-known as a cheap and environmentally safe alternative to animal-based proteins, which has expanded the market. Customer inclinations assume an urgent part in moulding the market elements of pea protein. As consciousness of the medical advantages related with plant-based eats less carbs develop, buyers are effectively looking for protein options that line up with their dietary decisions. The clean label pattern, underscoring normal and negligibly handled fixings, further pushes the demand for pea protein as it is seen as a healthy and nutritious choice. A primary method of calculating the market components of pea protein is shopper education. Producers should emphasize the nutritional benefits of pea protein, emphasizing its complete amino acid profile and suitability for various dietary requirements. With consumers become more aware of the environmental impact of the foods they choose, the low carbon footprint of pea protein production, as compared to animal-based proteins, becomes a major selling point. An important factor driving market dynamics is the advancement of pea protein plans and applications. Manufacturers are always looking for new and improved ways to incorporate pea protein into various food and beverage products, such as snacks, meat alternatives, and dairy replacements. Improvements in handling techniques contribute to improving the flavor and appearance of pea protein products, increasing consumer recognition of them. The global notion of the pea protein market suggests that societal factors and global trends have an impact on it. District-specific preferences for plant-based proteins may vary, therefore companies must modify their approaches to accommodate local tastes. Pea protein is likewise embraced differently across the world depending on social views on sustainability and the reduction of calories in plant-based diets.

    Author
    Snehal Singh
    Assistant Manager - Research

    High acumen in analyzing complex macro & micro markets with more than 6 years of work experience in the field of market research. By implementing her analytical skills in forecasting and estimation into market research reports, she has expertise in Packaging, Construction, and Equipment domains. She handles a team size of 20-25 resources and ensures smooth running of the projects, associated marketing activities, and client servicing.

    Leave a Comment

    FAQs

    What is the expected market size of the Pea Protein Market in 2024?

    The Pea Protein Market is expected to be valued at 1.31 billion USD in 2024.

    What is the projected market size for the Pea Protein Market by 2035?

    By 2035, the Pea Protein Market is anticipated to reach 4.5 billion USD.

    What is the expected CAGR for the Pea Protein Market from 2025 to 2035?

    The Pea Protein Market is expected to grow at a CAGR of 11.87% from 2025 to 2035.

    Which region will dominate the Pea Protein Market by 2035?

    North America is projected to dominate the Pea Protein Market with a value of 1.54 billion USD by 2035.

    What market size is estimated for the Food Beverages application in 2035?

    The Food Beverages application segment is estimated to be valued at 1.8 billion USD by 2035.

    Who are the major players in the Pea Protein Market?

    Key players in the Pea Protein Market include Roquette Freres, Cargill, Dupont, and Ingredion.

    What is the estimated market size for the Animal Feed application in 2035

    The Animal Feed application segment is forecasted to reach a market size of 0.9 billion USD by 2035.

    What market growth rate can we expect for the Asia Pacific region by 2035?

    The Asia Pacific region is expected to experience significant growth, reaching a market size of 1.01 billion USD by 2035.

    What is the estimated market size for the Nutritional Supplements application in 2024?

    The Nutritional Supplements application segment is valued at 0.39 billion USD in 2024.

    What challenges might the Pea Protein Market face in the coming years?

    Challenges for the Pea Protein Market may include competition from alternative protein sources and regulatory hurdles.

    Market Summary

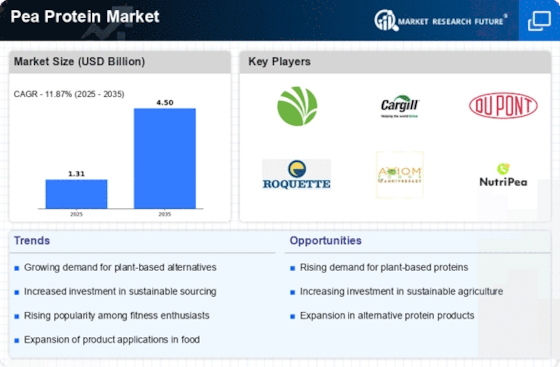
    As per MRFR analysis, the Pea Protein Market Size was estimated at 1.31 USD Billion in 2024. The pea protein industry is projected to grow from 1.465 in 2025 to 4.499 by 2035, exhibiting a compound annual growth rate (CAGR) of 11.87 during the forecast period 2025 - 2035.

    Key Market Trends & Highlights

    The Pea Protein Market is experiencing robust growth driven by increasing consumer demand for plant-based alternatives.

    • The demand for plant-based proteins continues to rise, particularly in North America, which remains the largest market.
    • Innovative product development is evident in the food and beverage segment, where pea protein is increasingly utilized.
    • Sustainability and environmental awareness are shaping consumer preferences, especially in the Asia-Pacific region, the fastest-growing market.
    • Health consciousness and the growth of vegan and vegetarian diets are key drivers propelling the expansion of the nutritional supplements segment.

    Market Size & Forecast

    2024 Market Size 1.31 (USD Billion)
    2035 Market Size 4.499 (USD Billion)
    CAGR (2025 - 2035) 11.87%
    Largest Regional Market Share in 2024 North America

    Major Players

    <p>Ingredion (US), Cargill (US), DuPont (US), Roquette Freres (FR), Axiom Foods (US), NutriPea (CA), Pea Protein Co. (US), The Green Labs (US), Batory Foods (US)</p>

    Market Trends

    The Pea Protein Market is currently experiencing a notable transformation, driven by a growing consumer inclination towards plant-based diets and sustainable food sources. This shift appears to be influenced by increasing awareness regarding health benefits associated with plant proteins, as well as environmental concerns linked to traditional animal-based protein sources. As a result, manufacturers are actively innovating and expanding their product lines to cater to the rising demand for pea protein in various applications, including food and beverages, dietary supplements, and pet food. The versatility of pea protein, combined with its favorable amino acid profile, positions it as a preferred choice among consumers seeking nutritious alternatives. Moreover, the Pea Protein Market seems to be benefiting from advancements in processing technologies, which enhance the quality and functionality of pea protein products. These innovations may lead to improved solubility, taste, and texture, making pea protein more appealing to both manufacturers and consumers. Additionally, the market landscape is characterized by increasing collaborations between food companies and ingredient suppliers, which could further drive the development of innovative products. Overall, the Pea Protein Market is poised for continued growth, reflecting broader trends in health, sustainability, and innovation in the food industry.

    Rising Demand for Plant-Based Proteins

    The Pea Protein Market is witnessing a surge in demand as consumers increasingly seek plant-based protein options. This trend is largely driven by health-conscious individuals and those adopting vegetarian or vegan lifestyles, who are looking for nutritious alternatives to animal proteins.

    Innovative Product Development

    Manufacturers in the Pea Protein Market are focusing on innovation to create diverse product offerings. This includes the development of new formulations that enhance taste and texture, making pea protein more appealing in various food applications.

    Sustainability and Environmental Awareness

    There is a growing emphasis on sustainability within the Pea Protein Market, as consumers become more aware of the environmental impact of their food choices. Pea protein is often viewed as a more sustainable option compared to traditional protein sources, which may drive its adoption.

    Pea Protein Market Market Drivers

    Growth of Vegan and Vegetarian Diets

    The rise in the adoption of vegan and vegetarian diets is likely to significantly influence the Pea Protein Market. As more individuals choose to eliminate animal products from their diets, the demand for plant-based protein sources has intensified. Pea protein, being a versatile ingredient, is increasingly incorporated into various food products, including meat alternatives, protein bars, and dairy substitutes. Market analysis shows that the meat substitute segment, which prominently features pea protein, is expected to witness substantial growth, potentially exceeding USD 5 billion by 2026. This shift in dietary preferences indicates a robust opportunity for the Pea Protein Market to expand its reach and cater to a growing consumer base.

    Sustainability and Ethical Consumerism

    Sustainability concerns and ethical consumerism are becoming pivotal drivers for the Pea Protein Market. As consumers become more environmentally conscious, they are increasingly seeking products that align with their values. Pea protein, derived from legumes, is considered a more sustainable protein source compared to traditional animal proteins, as it requires less water and land for production. This shift towards sustainable eating habits is reflected in market trends, with a notable increase in the sales of plant-based products. The Pea Protein Market stands to benefit from this growing demand for sustainable food options, as consumers prioritize products that contribute to environmental preservation.

    Expansion of E-commerce and Online Retail

    The expansion of e-commerce and online retail channels is likely to play a crucial role in the growth of the Pea Protein Market. With the increasing reliance on online shopping, consumers are more inclined to explore and purchase plant-based protein products through digital platforms. This trend is supported by the convenience and accessibility that e-commerce offers, allowing consumers to discover a wider range of pea protein products than what is typically available in physical stores. Market data indicates that online sales of health and wellness products, including pea protein, are expected to grow significantly in the coming years. This shift towards online retail presents a substantial opportunity for the Pea Protein Market to enhance its distribution and reach a broader audience.

    Innovative Applications in Food and Beverage

    The Pea Protein Market is experiencing a surge in innovative applications within the food and beverage sector. Manufacturers are increasingly exploring new formulations that incorporate pea protein into a variety of products, ranging from snacks to beverages. This innovation is driven by consumer demand for functional foods that offer health benefits, such as improved muscle recovery and satiety. Recent market data suggests that the protein-enriched beverage segment is projected to grow significantly, with pea protein being a key ingredient. This trend indicates that the Pea Protein Market is not only adapting to consumer preferences but also expanding its product offerings to meet diverse dietary needs.

    Health Consciousness and Nutritional Benefits

    The increasing awareness of health and nutrition among consumers appears to be a primary driver for the Pea Protein Market. As individuals seek healthier dietary options, the demand for plant-based proteins, particularly pea protein, has surged. Pea protein is recognized for its high protein content, essential amino acids, and low allergenic potential, making it an attractive alternative to animal-based proteins. Market data indicates that the plant-based protein segment is projected to grow at a compound annual growth rate of over 7% in the coming years. This trend suggests that consumers are gravitating towards products that not only meet their dietary needs but also align with their health goals, thereby propelling the Pea Protein Market forward.

    Market Segment Insights

    By Application: Food Beverages (Largest) vs. Nutritional Supplements (Fastest-Growing)

    <p>In the Pea Protein Market, the application segment is primarily dominated by the food and beverages sector, which holds a significant share due to the growing consumer preference for plant-based products. This sector thrives as it caters to the rising demand for protein-rich food options that align with health-conscious trends. Nutritional supplements, meanwhile, are rapidly gaining ground, appealing to fitness enthusiasts and health-aware consumers looking for convenient, easy-to-consume sources of protein that meet their dietary needs. The growth of these segments is driven by various factors, including increased veganism and vegetarianism, rising health awareness, and the demand for clean label products. Additionally, the versatility of pea protein in formulations adds to its appeal, allowing it to enter diverse product categories. The animal feed and cosmetics markets are also growing, yet not as rapidly as nutritional supplements, indicating a dynamic shift in where pea protein is being utilized in consumer products.</p>

    <p>Food Beverages: Dominant vs. Nutritional Supplements: Emerging</p>

    <p>The food and beverages segment stands as the dominant force in the Pea Protein Market, driven by an expansive range of applications such as dairy alternatives, protein bars, and baked goods, capitalizing on the trend towards healthier dietary choices. This segment benefits from consumer shifts towards plant-based diets that are both sustainable and nutritious. In contrast, nutritional supplements represent the emerging segment, rapidly evolving to include various formulations, including powders, ready-to-drink shakes, and capsules. The energetic growth of this sector is attributable to an increasing focus on fitness and wellness, particularly among millennials and Gen Z consumers seeking clean, high-protein options. This duality in application showcases the versatility of pea protein, meeting the diverse needs of consumers across different health and lifestyle preferences.</p>

    By Form: Isolates (Largest) vs. Textured Pea Protein (Fastest-Growing)

    <p>The Pea Protein Market has seen a significant distribution of shares across its different forms, with isolates taking the lead as the largest segment. This dominance is attributed to their high protein content and versatility in food products. Textured pea protein, though smaller in overall share, is rapidly gaining traction, fueled by the rising demand for plant-based protein sources. It appeals particularly to vegan and vegetarian consumers seeking meat alternatives, showcasing a dynamic shift in consumer preferences. Growth trends in the pea protein market are largely driven by a growing health-conscious population that favors plant-derived proteins over animal proteins. Additionally, the clean label movement and sustainable practices are propelling textured pea protein to the forefront as consumers gravitate towards products that promise environmental benefits. Innovations in processing methods also enhance the appeal of both isolates and textured forms, allowing manufacturers to cater to diverse applications in the food industry.</p>

    <p>Isolates (Dominant) vs. Textured Pea Protein (Emerging)</p>

    <p>Isolates stand out in the Pea Protein Market as the most dominant form, renowned for their high purity levels, typically exceeding 85% protein content. This quality makes them ideal for formulations in sports nutrition, dietary supplements, and functional foods. Their neutral flavor profile allows for versatile usage in various applications, including protein bars, shakes, and baked goods, catering to a wide array of consumer preferences. On the other hand, textured pea protein is emerging rapidly as an appealing choice for meat alternatives, harnessing the growing trend towards plant-based diets. Its fibrous texture mimics meat, making it a favorite among consumers seeking satisfying, meat-like products. As brands innovate with this ingredient, its market potential continues to expand.</p>

    By Source: Yellow Pea (Largest) vs. Green Pea (Fastest-Growing)

    <p>In the Pea Protein Market, the source segment is primarily dominated by yellow pea, which holds the largest market share due to its favorable protein content and versatile applications in various food products. Yellow pea is widely accepted by consumers and manufacturers alike, contributing significantly to its market presence. Green pea, while smaller in market share, has been gaining traction owing to its nutritional benefits and is increasingly being integrated into plant-based diets, leading to notable growth rates in recent years. The growth of the pea protein market is largely driven by increasing consumer shift towards plant-based proteins and the rise in popularity of health and wellness products. Green pea's emergence as a preferred source is fueled by its rich amino acid profile and sustainable agricultural practices. This, along with innovations in processing technologies, is expected to enhance the production capacities, making green pea a key player in the market over the next few years.</p>

    <p>Yellow Pea (Dominant) vs. Green Pea (Emerging)</p>

    <p>The yellow pea remains the dominant source of pea protein, largely due to its high protein yield and cost-effectiveness in production. It is widely utilized in formulations for protein isolates, concentrates, and flour, appealing to manufacturers aiming for high performance in food applications. In contrast, the green pea is emerging as a viable option, recognized for its rich nutrient profile and growing consumer demand for diverse plant-based proteins. The green pea is often highlighted for its dietary fiber content and antioxidants, making it attractive to health-conscious buyers. As consumer preferences evolve, the green pea segment is integrating innovative processing methods to boost its market presence and compete with established sources.</p>

    By End Use: Vegan Products (Largest) vs. Meat Alternatives (Fastest-Growing)

    <p>In the Pea Protein Market, the end use segment is primarily dominated by Vegan Products, which have established a significant share due to the increasing shift towards plant-based diets. In contrast, Meat Alternatives are gaining momentum, reflecting a consumer inclination towards healthier and sustainable eating options. Gluten-Free Products also play a role in this competitive segment, appealing to consumers with dietary restrictions and preferences. As the awareness of health benefits tied to plant-based proteins rises, Vegan Products continue to thrive as a preferred choice among consumers. The demand for Meat Alternatives is rapidly escalating, driven by innovation in product offerings and the diversification of protein sources. This trend is propelled further by changing lifestyles that favor convenience and ethical consumption, indicating a vibrant future for both segments.</p>

    <p>Vegan Products: Dominant vs. Meat Alternatives: Emerging</p>

    <p>Vegan Products make up the dominant portion of the Pea Protein Market due to their appealing characteristics, such as high nutritional value and versatility in various food applications. These products cater not only to strict vegans but also to flexitarians and health-conscious consumers seeking to reduce animal protein intake. On the other hand, Meat Alternatives are an emerging trend, providing innovative solutions that mimic the texture and taste of meat. This segment is characterized by rapid development and investment in product innovation, appealing to a broad audience concerned about environmental sustainability and health. Together, these two end uses illustrate the evolving landscape of protein consumption, reflecting consumer demands for ethical and health-focused food choices.</p>

    Get more detailed insights about Pea Protein Market Research Report-Forecast to 2035

    Regional Insights

    The Pea Protein Market is experiencing noteworthy growth across various regions, with projections indicating a market value of 1.31 USD Billion in 2024, expanding to 4.5 USD Billion by 2035, driven by rising demand for plant-based proteins.

    In North America, the market is valued at 0.46 USD Billion in 2024, and this region holds a significant share, expected to reach 1.54 USD Billion by 2035, highlighting its majority holding in the Pea Protein Market.

    Europe follows closely with a valuation of 0.38 USD Billion in 2024, anticipated to grow to 1.36 USD Billion, as consumers increasingly shift towards healthier, sustainable food options.

    The Asia Pacific region, valued at 0.28 USD Billion, demonstrates considerable potential with a projected growth to 1.01 USD Billion by 2035, largely fueled by an expanding population and increasing health consciousness.

    South America's market stands at 0.13 USD Billion, expected to grow to 0.45 USD Billion, showing emerging trends in health and wellness. Meanwhile, the Middle East and Africa, though currently valued at 0.06 USD Billion, are witnessing a growing interest in plant-based dietary products, reaching 0.2 USD Billion by 2035.

    The combined market insights reflect a significant upward trajectory across all regions, driven by consumer preferences for health-oriented protein sources and sustainability, setting a stable foundation for future growth within the Pea Protein Market.

    Pea Protein Market Regional Insights  

    Source: Primary Research, Secondary Research, Market Research Future Database and Analyst Review

    Key Players and Competitive Insights

    The Pea Protein Market is gaining momentum as a key player in the realm of plant-based protein alternatives. With the increasing consumer demand for vegetarian and vegan options, coupled with a rising awareness regarding health and wellness, the competitive landscape is evolving rapidly.

    The market is characterized by innovations in production techniques, a wide variety of product offerings, and strategic partnerships among key players.

    Companies are increasingly focusing on product development to meet diverse consumer preferences, fueling competition and market dynamics.

    Manufacturers are becoming more adept at sourcing high-quality peas and optimizing extraction processes, which enhances their market positioning. Additionally, sustainability trends and the clean label movement are driving brands to enhance transparency in their sourcing and production methods.

    As a result, businesses within this space must navigate a landscape filled with both established companies and emerging startups, each striving to capture market share and satisfy consumer demand for plant-based protein solutions.

    Roquette Freres stands out in the Pea Protein Market with a strong commitment to innovation and quality. The company has established itself as a leading producer of plant-based proteins, emphasizing its extensive research and development capabilities.

    Roquette Freres has a robust portfolio that includes a variety of pea protein products tailored for food and beverage applications, making it a go-to choice for food manufacturers seeking high-quality ingredients.

    The company benefits from a global presence, with distribution capabilities that ensure consistent product availability across regions.

    Its strengths lie not only in the superior quality of its pea protein but also in its sustainable practices, such as efficient sourcing, which resonates with eco-conscious consumers.

    The company’s focus on enhancing consumer experiences through innovative solutions positions it favorably in a competitive market landscape.

    Natural Nutrition, focusing specifically on the Pea Protein Market, has made significant strides in developing a range of plant-based protein products aimed at health and wellness-oriented consumers. This company offers a variety of pea protein formulations, catering to diverse dietary needs, including sports nutrition and general health supplements.

    Natural Nutrition has a commendable market presence, bolstered by its dedication to producing high-quality, non-GMO pea protein that aligns with consumer preferences for clean and transparent labels.

    Throughout its journey, the company has engaged in strategic partnerships and alliances that have expanded its product offerings and market reach, while also pursuing mergers and acquisitions to enhance its portfolio.

    The strengths of Natural Nutrition lie in its ability to innovate and adapt to market trends, ensuring that its product lines remain relevant and appealing to a broad audience.

    With a firm footing in the global market, the company continues to capitalize on the growth of plant-based dietary preferences while reinforcing its commitment to quality and sustainability.

    Key Companies in the Pea Protein Market market include

    Industry Developments

    Recent developments in the Pea Protein Market indicate significant growth and expansion efforts among key players. Roquette Freres has increased its production capacity to meet rising demand, while Cargill is focusing on innovative methods to promote pea protein in various food applications.

    Natural Nutrition has recently launched new pea protein products aimed at vegan consumers, reflecting the growing trend toward plant-based diets.

    In terms of mergers and acquisitions, DuPont announced its acquisition of the pea protein business from a competitor in January 2023, aiming to strengthen its position in the plant-based protein sector.

    The Green Labs LLC has also entered a strategic alliance with Ingredion in June 2023 to enhance the availability of pea protein ingredients to global markets.

    The overall market valuation of companies in the industry has surged, with estimated annual growth rates of over 12% annual growth projected through 2026. This surge is influenced by increasing consumer demand for plant-based proteins, driven by health and sustainability trends.

    In the last two to three years, companies like Axiom Foods have expanded their market presence through new partnerships and product launches, further solidifying the appeal of pea protein in the global food industry.


    Future Outlook

    Pea Protein Market Future Outlook

    <p>The Pea Protein Market is projected to grow at 11.87% CAGR from 2024 to 2035, driven by rising plant-based diets, health consciousness, and sustainable sourcing.</p>

    New opportunities lie in:

    • <p>Expansion into emerging markets with tailored product lines.</p>
    • <p>Development of fortified pea protein snacks targeting health-conscious consumers.</p>
    • <p>Partnerships with food manufacturers for innovative product formulations.</p>

    <p>By 2035, the Pea Protein Market is expected to solidify its position as a leading alternative protein source.</p>

    Market Segmentation

    Pea Protein Market Form Outlook

    • Isolates
    • Concentrates
    • Textured Pea Protein

    Pea Protein Market Source Outlook

    • Yellow Pea
    • Green Pea
    • Other Peas

    Pea Protein Market End Use Outlook

    • Vegan Products
    • Gluten-Free Products
    • Meat Alternatives

    Pea Protein Market Application Outlook

    • Food Beverages
    • Nutritional Supplements
    • Animal Feed
    • Cosmetics
    • Pharmaceuticals

    Report Scope

    MARKET SIZE 20241.31(USD Billion)
    MARKET SIZE 20251.465(USD Billion)
    MARKET SIZE 20354.499(USD Billion)
    COMPOUND ANNUAL GROWTH RATE (CAGR)11.87% (2024 - 2035)
    REPORT COVERAGERevenue Forecast, Competitive Landscape, Growth Factors, and Trends
    BASE YEAR2024
    Market Forecast Period2025 - 2035
    Historical Data2019 - 2024
    Market Forecast UnitsUSD Billion
    Key Companies ProfiledMarket analysis in progress
    Segments CoveredMarket segmentation analysis in progress
    Key Market OpportunitiesRising consumer demand for plant-based proteins drives innovation in the Pea Protein Market.
    Key Market DynamicsRising consumer demand for plant-based proteins drives innovation and competition in the pea protein market.
    Countries CoveredNorth America, Europe, APAC, South America, MEA

    FAQs

    What is the expected market size of the Pea Protein Market in 2024?

    The Pea Protein Market is expected to be valued at 1.31 billion USD in 2024.

    What is the projected market size for the Pea Protein Market by 2035?

    By 2035, the Pea Protein Market is anticipated to reach 4.5 billion USD.

    What is the expected CAGR for the Pea Protein Market from 2025 to 2035?

    The Pea Protein Market is expected to grow at a CAGR of 11.87% from 2025 to 2035.

    Which region will dominate the Pea Protein Market by 2035?

    North America is projected to dominate the Pea Protein Market with a value of 1.54 billion USD by 2035.

    What market size is estimated for the Food Beverages application in 2035?

    The Food Beverages application segment is estimated to be valued at 1.8 billion USD by 2035.

    Who are the major players in the Pea Protein Market?

    Key players in the Pea Protein Market include Roquette Freres, Cargill, Dupont, and Ingredion.

    What is the estimated market size for the Animal Feed application in 2035

    The Animal Feed application segment is forecasted to reach a market size of 0.9 billion USD by 2035.

    What market growth rate can we expect for the Asia Pacific region by 2035?

    The Asia Pacific region is expected to experience significant growth, reaching a market size of 1.01 billion USD by 2035.

    What is the estimated market size for the Nutritional Supplements application in 2024?

    The Nutritional Supplements application segment is valued at 0.39 billion USD in 2024.

    What challenges might the Pea Protein Market face in the coming years?

    Challenges for the Pea Protein Market may include competition from alternative protein sources and regulatory hurdles.

    1. SECTION I: EXECUTIVE SUMMARY AND KEY HIGHLIGHTS
      1. | 1.1 EXECUTIVE SUMMARY
      2. | | 1.1.1 Market Overview
      3. | | 1.1.2 Key Findings
      4. | | 1.1.3 Market Segmentation
      5. | | 1.1.4 Competitive Landscape
      6. | | 1.1.5 Challenges and Opportunities
      7. | | 1.1.6 Future Outlook
    2. SECTION II: SCOPING, METHODOLOGY AND MARKET STRUCTURE
      1. | 2.1 MARKET INTRODUCTION
      2. | | 2.1.1 Definition
      3. | | 2.1.2 Scope of the study
      4. | | | 2.1.2.1 Research Objective
      5. | | | 2.1.2.2 Assumption
      6. | | | 2.1.2.3 Limitations
      7. | 2.2 RESEARCH METHODOLOGY
      8. | | 2.2.1 Overview
      9. | | 2.2.2 Data Mining
      10. | | 2.2.3 Secondary Research
      11. | | 2.2.4 Primary Research
      12. | | | 2.2.4.1 Primary Interviews and Information Gathering Process
      13. | | | 2.2.4.2 Breakdown of Primary Respondents
      14. | | 2.2.5 Forecasting Model
      15. | | 2.2.6 Market Size Estimation
      16. | | | 2.2.6.1 Bottom-Up Approach
      17. | | | 2.2.6.2 Top-Down Approach
      18. | | 2.2.7 Data Triangulation
      19. | | 2.2.8 Validation
    3. SECTION III: QUALITATIVE ANALYSIS
      1. | 3.1 MARKET DYNAMICS
      2. | | 3.1.1 Overview
      3. | | 3.1.2 Drivers
      4. | | 3.1.3 Restraints
      5. | | 3.1.4 Opportunities
      6. | 3.2 MARKET FACTOR ANALYSIS
      7. | | 3.2.1 Value chain Analysis
      8. | | 3.2.2 Porter's Five Forces Analysis
      9. | | | 3.2.2.1 Bargaining Power of Suppliers
      10. | | | 3.2.2.2 Bargaining Power of Buyers
      11. | | | 3.2.2.3 Threat of New Entrants
      12. | | | 3.2.2.4 Threat of Substitutes
      13. | | | 3.2.2.5 Intensity of Rivalry
      14. | | 3.2.3 COVID-19 Impact Analysis
      15. | | | 3.2.3.1 Market Impact Analysis
      16. | | | 3.2.3.2 Regional Impact
      17. | | | 3.2.3.3 Opportunity and Threat Analysis
    4. SECTION IV: QUANTITATIVE ANALYSIS
      1. | 4.1 Food, Beverages & Nutrition, BY Application (USD Billion)
      2. | | 4.1.1 Food Beverages
      3. | | 4.1.2 Nutritional Supplements
      4. | | 4.1.3 Animal Feed
      5. | | 4.1.4 Cosmetics
      6. | | 4.1.5 Pharmaceuticals
      7. | 4.2 Food, Beverages & Nutrition, BY Form (USD Billion)
      8. | | 4.2.1 Isolates
      9. | | 4.2.2 Concentrates
      10. | | 4.2.3 Textured Pea Protein
      11. | 4.3 Food, Beverages & Nutrition, BY Source (USD Billion)
      12. | | 4.3.1 Yellow Pea
      13. | | 4.3.2 Green Pea
      14. | | 4.3.3 Other Peas
      15. | 4.4 Food, Beverages & Nutrition, BY End Use (USD Billion)
      16. | | 4.4.1 Vegan Products
      17. | | 4.4.2 Gluten-Free Products
      18. | | 4.4.3 Meat Alternatives
      19. | 4.5 Food, Beverages & Nutrition, BY Region (USD Billion)
      20. | | 4.5.1 North America
      21. | | | 4.5.1.1 US
      22. | | | 4.5.1.2 Canada
      23. | | 4.5.2 Europe
      24. | | | 4.5.2.1 Germany
      25. | | | 4.5.2.2 UK
      26. | | | 4.5.2.3 France
      27. | | | 4.5.2.4 Russia
      28. | | | 4.5.2.5 Italy
      29. | | | 4.5.2.6 Spain
      30. | | | 4.5.2.7 Rest of Europe
      31. | | 4.5.3 APAC
      32. | | | 4.5.3.1 China
      33. | | | 4.5.3.2 India
      34. | | | 4.5.3.3 Japan
      35. | | | 4.5.3.4 South Korea
      36. | | | 4.5.3.5 Malaysia
      37. | | | 4.5.3.6 Thailand
      38. | | | 4.5.3.7 Indonesia
      39. | | | 4.5.3.8 Rest of APAC
      40. | | 4.5.4 South America
      41. | | | 4.5.4.1 Brazil
      42. | | | 4.5.4.2 Mexico
      43. | | | 4.5.4.3 Argentina
      44. | | | 4.5.4.4 Rest of South America
      45. | | 4.5.5 MEA
      46. | | | 4.5.5.1 GCC Countries
      47. | | | 4.5.5.2 South Africa
      48. | | | 4.5.5.3 Rest of MEA
    5. SECTION V: COMPETITIVE ANALYSIS
      1. | 5.1 Competitive Landscape
      2. | | 5.1.1 Overview
      3. | | 5.1.2 Competitive Analysis
      4. | | 5.1.3 Market share Analysis
      5. | | 5.1.4 Major Growth Strategy in the Food, Beverages & Nutrition
      6. | | 5.1.5 Competitive Benchmarking
      7. | | 5.1.6 Leading Players in Terms of Number of Developments in the Food, Beverages & Nutrition
      8. | | 5.1.7 Key developments and growth strategies
      9. | | | 5.1.7.1 New Product Launch/Service Deployment
      10. | | | 5.1.7.2 Merger & Acquisitions
      11. | | | 5.1.7.3 Joint Ventures
      12. | | 5.1.8 Major Players Financial Matrix
      13. | | | 5.1.8.1 Sales and Operating Income
      14. | | | 5.1.8.2 Major Players R&D Expenditure. 2023
      15. | 5.2 Company Profiles
      16. | | 5.2.1 Ingredion (US)
      17. | | | 5.2.1.1 Financial Overview
      18. | | | 5.2.1.2 Products Offered
      19. | | | 5.2.1.3 Key Developments
      20. | | | 5.2.1.4 SWOT Analysis
      21. | | | 5.2.1.5 Key Strategies
      22. | | 5.2.2 Cargill (US)
      23. | | | 5.2.2.1 Financial Overview
      24. | | | 5.2.2.2 Products Offered
      25. | | | 5.2.2.3 Key Developments
      26. | | | 5.2.2.4 SWOT Analysis
      27. | | | 5.2.2.5 Key Strategies
      28. | | 5.2.3 DuPont (US)
      29. | | | 5.2.3.1 Financial Overview
      30. | | | 5.2.3.2 Products Offered
      31. | | | 5.2.3.3 Key Developments
      32. | | | 5.2.3.4 SWOT Analysis
      33. | | | 5.2.3.5 Key Strategies
      34. | | 5.2.4 Roquette Freres (FR)
      35. | | | 5.2.4.1 Financial Overview
      36. | | | 5.2.4.2 Products Offered
      37. | | | 5.2.4.3 Key Developments
      38. | | | 5.2.4.4 SWOT Analysis
      39. | | | 5.2.4.5 Key Strategies
      40. | | 5.2.5 Axiom Foods (US)
      41. | | | 5.2.5.1 Financial Overview
      42. | | | 5.2.5.2 Products Offered
      43. | | | 5.2.5.3 Key Developments
      44. | | | 5.2.5.4 SWOT Analysis
      45. | | | 5.2.5.5 Key Strategies
      46. | | 5.2.6 NutriPea (CA)
      47. | | | 5.2.6.1 Financial Overview
      48. | | | 5.2.6.2 Products Offered
      49. | | | 5.2.6.3 Key Developments
      50. | | | 5.2.6.4 SWOT Analysis
      51. | | | 5.2.6.5 Key Strategies
      52. | | 5.2.7 Pea Protein Co. (US)
      53. | | | 5.2.7.1 Financial Overview
      54. | | | 5.2.7.2 Products Offered
      55. | | | 5.2.7.3 Key Developments
      56. | | | 5.2.7.4 SWOT Analysis
      57. | | | 5.2.7.5 Key Strategies
      58. | | 5.2.8 The Green Labs (US)
      59. | | | 5.2.8.1 Financial Overview
      60. | | | 5.2.8.2 Products Offered
      61. | | | 5.2.8.3 Key Developments
      62. | | | 5.2.8.4 SWOT Analysis
      63. | | | 5.2.8.5 Key Strategies
      64. | | 5.2.9 Batory Foods (US)
      65. | | | 5.2.9.1 Financial Overview
      66. | | | 5.2.9.2 Products Offered
      67. | | | 5.2.9.3 Key Developments
      68. | | | 5.2.9.4 SWOT Analysis
      69. | | | 5.2.9.5 Key Strategies
      70. | 5.3 Appendix
      71. | | 5.3.1 References
      72. | | 5.3.2 Related Reports
    6. LIST OF FIGURES
      1. | 6.1 MARKET SYNOPSIS
      2. | 6.2 NORTH AMERICA MARKET ANALYSIS
      3. | 6.3 US MARKET ANALYSIS BY APPLICATION
      4. | 6.4 US MARKET ANALYSIS BY FORM
      5. | 6.5 US MARKET ANALYSIS BY SOURCE
      6. | 6.6 US MARKET ANALYSIS BY END USE
      7. | 6.7 CANADA MARKET ANALYSIS BY APPLICATION
      8. | 6.8 CANADA MARKET ANALYSIS BY FORM
      9. | 6.9 CANADA MARKET ANALYSIS BY SOURCE
      10. | 6.10 CANADA MARKET ANALYSIS BY END USE
      11. | 6.11 EUROPE MARKET ANALYSIS
      12. | 6.12 GERMANY MARKET ANALYSIS BY APPLICATION
      13. | 6.13 GERMANY MARKET ANALYSIS BY FORM
      14. | 6.14 GERMANY MARKET ANALYSIS BY SOURCE
      15. | 6.15 GERMANY MARKET ANALYSIS BY END USE
      16. | 6.16 UK MARKET ANALYSIS BY APPLICATION
      17. | 6.17 UK MARKET ANALYSIS BY FORM
      18. | 6.18 UK MARKET ANALYSIS BY SOURCE
      19. | 6.19 UK MARKET ANALYSIS BY END USE
      20. | 6.20 FRANCE MARKET ANALYSIS BY APPLICATION
      21. | 6.21 FRANCE MARKET ANALYSIS BY FORM
      22. | 6.22 FRANCE MARKET ANALYSIS BY SOURCE
      23. | 6.23 FRANCE MARKET ANALYSIS BY END USE
      24. | 6.24 RUSSIA MARKET ANALYSIS BY APPLICATION
      25. | 6.25 RUSSIA MARKET ANALYSIS BY FORM
      26. | 6.26 RUSSIA MARKET ANALYSIS BY SOURCE
      27. | 6.27 RUSSIA MARKET ANALYSIS BY END USE
      28. | 6.28 ITALY MARKET ANALYSIS BY APPLICATION
      29. | 6.29 ITALY MARKET ANALYSIS BY FORM
      30. | 6.30 ITALY MARKET ANALYSIS BY SOURCE
      31. | 6.31 ITALY MARKET ANALYSIS BY END USE
      32. | 6.32 SPAIN MARKET ANALYSIS BY APPLICATION
      33. | 6.33 SPAIN MARKET ANALYSIS BY FORM
      34. | 6.34 SPAIN MARKET ANALYSIS BY SOURCE
      35. | 6.35 SPAIN MARKET ANALYSIS BY END USE
      36. | 6.36 REST OF EUROPE MARKET ANALYSIS BY APPLICATION
      37. | 6.37 REST OF EUROPE MARKET ANALYSIS BY FORM
      38. | 6.38 REST OF EUROPE MARKET ANALYSIS BY SOURCE
      39. | 6.39 REST OF EUROPE MARKET ANALYSIS BY END USE
      40. | 6.40 APAC MARKET ANALYSIS
      41. | 6.41 CHINA MARKET ANALYSIS BY APPLICATION
      42. | 6.42 CHINA MARKET ANALYSIS BY FORM
      43. | 6.43 CHINA MARKET ANALYSIS BY SOURCE
      44. | 6.44 CHINA MARKET ANALYSIS BY END USE
      45. | 6.45 INDIA MARKET ANALYSIS BY APPLICATION
      46. | 6.46 INDIA MARKET ANALYSIS BY FORM
      47. | 6.47 INDIA MARKET ANALYSIS BY SOURCE
      48. | 6.48 INDIA MARKET ANALYSIS BY END USE
      49. | 6.49 JAPAN MARKET ANALYSIS BY APPLICATION
      50. | 6.50 JAPAN MARKET ANALYSIS BY FORM
      51. | 6.51 JAPAN MARKET ANALYSIS BY SOURCE
      52. | 6.52 JAPAN MARKET ANALYSIS BY END USE
      53. | 6.53 SOUTH KOREA MARKET ANALYSIS BY APPLICATION
      54. | 6.54 SOUTH KOREA MARKET ANALYSIS BY FORM
      55. | 6.55 SOUTH KOREA MARKET ANALYSIS BY SOURCE
      56. | 6.56 SOUTH KOREA MARKET ANALYSIS BY END USE
      57. | 6.57 MALAYSIA MARKET ANALYSIS BY APPLICATION
      58. | 6.58 MALAYSIA MARKET ANALYSIS BY FORM
      59. | 6.59 MALAYSIA MARKET ANALYSIS BY SOURCE
      60. | 6.60 MALAYSIA MARKET ANALYSIS BY END USE
      61. | 6.61 THAILAND MARKET ANALYSIS BY APPLICATION
      62. | 6.62 THAILAND MARKET ANALYSIS BY FORM
      63. | 6.63 THAILAND MARKET ANALYSIS BY SOURCE
      64. | 6.64 THAILAND MARKET ANALYSIS BY END USE
      65. | 6.65 INDONESIA MARKET ANALYSIS BY APPLICATION
      66. | 6.66 INDONESIA MARKET ANALYSIS BY FORM
      67. | 6.67 INDONESIA MARKET ANALYSIS BY SOURCE
      68. | 6.68 INDONESIA MARKET ANALYSIS BY END USE
      69. | 6.69 REST OF APAC MARKET ANALYSIS BY APPLICATION
      70. | 6.70 REST OF APAC MARKET ANALYSIS BY FORM
      71. | 6.71 REST OF APAC MARKET ANALYSIS BY SOURCE
      72. | 6.72 REST OF APAC MARKET ANALYSIS BY END USE
      73. | 6.73 SOUTH AMERICA MARKET ANALYSIS
      74. | 6.74 BRAZIL MARKET ANALYSIS BY APPLICATION
      75. | 6.75 BRAZIL MARKET ANALYSIS BY FORM
      76. | 6.76 BRAZIL MARKET ANALYSIS BY SOURCE
      77. | 6.77 BRAZIL MARKET ANALYSIS BY END USE
      78. | 6.78 MEXICO MARKET ANALYSIS BY APPLICATION
      79. | 6.79 MEXICO MARKET ANALYSIS BY FORM
      80. | 6.80 MEXICO MARKET ANALYSIS BY SOURCE
      81. | 6.81 MEXICO MARKET ANALYSIS BY END USE
      82. | 6.82 ARGENTINA MARKET ANALYSIS BY APPLICATION
      83. | 6.83 ARGENTINA MARKET ANALYSIS BY FORM
      84. | 6.84 ARGENTINA MARKET ANALYSIS BY SOURCE
      85. | 6.85 ARGENTINA MARKET ANALYSIS BY END USE
      86. | 6.86 REST OF SOUTH AMERICA MARKET ANALYSIS BY APPLICATION
      87. | 6.87 REST OF SOUTH AMERICA MARKET ANALYSIS BY FORM
      88. | 6.88 REST OF SOUTH AMERICA MARKET ANALYSIS BY SOURCE
      89. | 6.89 REST OF SOUTH AMERICA MARKET ANALYSIS BY END USE
      90. | 6.90 MEA MARKET ANALYSIS
      91. | 6.91 GCC COUNTRIES MARKET ANALYSIS BY APPLICATION
      92. | 6.92 GCC COUNTRIES MARKET ANALYSIS BY FORM
      93. | 6.93 GCC COUNTRIES MARKET ANALYSIS BY SOURCE
      94. | 6.94 GCC COUNTRIES MARKET ANALYSIS BY END USE
      95. | 6.95 SOUTH AFRICA MARKET ANALYSIS BY APPLICATION
      96. | 6.96 SOUTH AFRICA MARKET ANALYSIS BY FORM
      97. | 6.97 SOUTH AFRICA MARKET ANALYSIS BY SOURCE
      98. | 6.98 SOUTH AFRICA MARKET ANALYSIS BY END USE
      99. | 6.99 REST OF MEA MARKET ANALYSIS BY APPLICATION
      100. | 6.100 REST OF MEA MARKET ANALYSIS BY FORM
      101. | 6.101 REST OF MEA MARKET ANALYSIS BY SOURCE
      102. | 6.102 REST OF MEA MARKET ANALYSIS BY END USE
      103. | 6.103 KEY BUYING CRITERIA OF FOOD, BEVERAGES & NUTRITION
      104. | 6.104 RESEARCH PROCESS OF MRFR
      105. | 6.105 DRO ANALYSIS OF FOOD, BEVERAGES & NUTRITION
      106. | 6.106 DRIVERS IMPACT ANALYSIS: FOOD, BEVERAGES & NUTRITION
      107. | 6.107 RESTRAINTS IMPACT ANALYSIS: FOOD, BEVERAGES & NUTRITION
      108. | 6.108 SUPPLY / VALUE CHAIN: FOOD, BEVERAGES & NUTRITION
      109. | 6.109 FOOD, BEVERAGES & NUTRITION, BY APPLICATION, 2024 (% SHARE)
      110. | 6.110 FOOD, BEVERAGES & NUTRITION, BY APPLICATION, 2024 TO 2035 (USD Billion)
      111. | 6.111 FOOD, BEVERAGES & NUTRITION, BY FORM, 2024 (% SHARE)
      112. | 6.112 FOOD, BEVERAGES & NUTRITION, BY FORM, 2024 TO 2035 (USD Billion)
      113. | 6.113 FOOD, BEVERAGES & NUTRITION, BY SOURCE, 2024 (% SHARE)
      114. | 6.114 FOOD, BEVERAGES & NUTRITION, BY SOURCE, 2024 TO 2035 (USD Billion)
      115. | 6.115 FOOD, BEVERAGES & NUTRITION, BY END USE, 2024 (% SHARE)
      116. | 6.116 FOOD, BEVERAGES & NUTRITION, BY END USE, 2024 TO 2035 (USD Billion)
      117. | 6.117 BENCHMARKING OF MAJOR COMPETITORS
    7. LIST OF TABLES
      1. | 7.1 LIST OF ASSUMPTIONS
      2. | | 7.1.1
      3. | 7.2 North America MARKET SIZE ESTIMATES; FORECAST
      4. | | 7.2.1 BY APPLICATION, 2025-2035 (USD Billion)
      5. | | 7.2.2 BY FORM, 2025-2035 (USD Billion)
      6. | | 7.2.3 BY SOURCE, 2025-2035 (USD Billion)
      7. | | 7.2.4 BY END USE, 2025-2035 (USD Billion)
      8. | 7.3 US MARKET SIZE ESTIMATES; FORECAST
      9. | | 7.3.1 BY APPLICATION, 2025-2035 (USD Billion)
      10. | | 7.3.2 BY FORM, 2025-2035 (USD Billion)
      11. | | 7.3.3 BY SOURCE, 2025-2035 (USD Billion)
      12. | | 7.3.4 BY END USE, 2025-2035 (USD Billion)
      13. | 7.4 Canada MARKET SIZE ESTIMATES; FORECAST
      14. | | 7.4.1 BY APPLICATION, 2025-2035 (USD Billion)
      15. | | 7.4.2 BY FORM, 2025-2035 (USD Billion)
      16. | | 7.4.3 BY SOURCE, 2025-2035 (USD Billion)
      17. | | 7.4.4 BY END USE, 2025-2035 (USD Billion)
      18. | 7.5 Europe MARKET SIZE ESTIMATES; FORECAST
      19. | | 7.5.1 BY APPLICATION, 2025-2035 (USD Billion)
      20. | | 7.5.2 BY FORM, 2025-2035 (USD Billion)
      21. | | 7.5.3 BY SOURCE, 2025-2035 (USD Billion)
      22. | | 7.5.4 BY END USE, 2025-2035 (USD Billion)
      23. | 7.6 Germany MARKET SIZE ESTIMATES; FORECAST
      24. | | 7.6.1 BY APPLICATION, 2025-2035 (USD Billion)
      25. | | 7.6.2 BY FORM, 2025-2035 (USD Billion)
      26. | | 7.6.3 BY SOURCE, 2025-2035 (USD Billion)
      27. | | 7.6.4 BY END USE, 2025-2035 (USD Billion)
      28. | 7.7 UK MARKET SIZE ESTIMATES; FORECAST
      29. | | 7.7.1 BY APPLICATION, 2025-2035 (USD Billion)
      30. | | 7.7.2 BY FORM, 2025-2035 (USD Billion)
      31. | | 7.7.3 BY SOURCE, 2025-2035 (USD Billion)
      32. | | 7.7.4 BY END USE, 2025-2035 (USD Billion)
      33. | 7.8 France MARKET SIZE ESTIMATES; FORECAST
      34. | | 7.8.1 BY APPLICATION, 2025-2035 (USD Billion)
      35. | | 7.8.2 BY FORM, 2025-2035 (USD Billion)
      36. | | 7.8.3 BY SOURCE, 2025-2035 (USD Billion)
      37. | | 7.8.4 BY END USE, 2025-2035 (USD Billion)
      38. | 7.9 Russia MARKET SIZE ESTIMATES; FORECAST
      39. | | 7.9.1 BY APPLICATION, 2025-2035 (USD Billion)
      40. | | 7.9.2 BY FORM, 2025-2035 (USD Billion)
      41. | | 7.9.3 BY SOURCE, 2025-2035 (USD Billion)
      42. | | 7.9.4 BY END USE, 2025-2035 (USD Billion)
      43. | 7.10 Italy MARKET SIZE ESTIMATES; FORECAST
      44. | | 7.10.1 BY APPLICATION, 2025-2035 (USD Billion)
      45. | | 7.10.2 BY FORM, 2025-2035 (USD Billion)
      46. | | 7.10.3 BY SOURCE, 2025-2035 (USD Billion)
      47. | | 7.10.4 BY END USE, 2025-2035 (USD Billion)
      48. | 7.11 Spain MARKET SIZE ESTIMATES; FORECAST
      49. | | 7.11.1 BY APPLICATION, 2025-2035 (USD Billion)
      50. | | 7.11.2 BY FORM, 2025-2035 (USD Billion)
      51. | | 7.11.3 BY SOURCE, 2025-2035 (USD Billion)
      52. | | 7.11.4 BY END USE, 2025-2035 (USD Billion)
      53. | 7.12 Rest of Europe MARKET SIZE ESTIMATES; FORECAST
      54. | | 7.12.1 BY APPLICATION, 2025-2035 (USD Billion)
      55. | | 7.12.2 BY FORM, 2025-2035 (USD Billion)
      56. | | 7.12.3 BY SOURCE, 2025-2035 (USD Billion)
      57. | | 7.12.4 BY END USE, 2025-2035 (USD Billion)
      58. | 7.13 APAC MARKET SIZE ESTIMATES; FORECAST
      59. | | 7.13.1 BY APPLICATION, 2025-2035 (USD Billion)
      60. | | 7.13.2 BY FORM, 2025-2035 (USD Billion)
      61. | | 7.13.3 BY SOURCE, 2025-2035 (USD Billion)
      62. | | 7.13.4 BY END USE, 2025-2035 (USD Billion)
      63. | 7.14 China MARKET SIZE ESTIMATES; FORECAST
      64. | | 7.14.1 BY APPLICATION, 2025-2035 (USD Billion)
      65. | | 7.14.2 BY FORM, 2025-2035 (USD Billion)
      66. | | 7.14.3 BY SOURCE, 2025-2035 (USD Billion)
      67. | | 7.14.4 BY END USE, 2025-2035 (USD Billion)
      68. | 7.15 India MARKET SIZE ESTIMATES; FORECAST
      69. | | 7.15.1 BY APPLICATION, 2025-2035 (USD Billion)
      70. | | 7.15.2 BY FORM, 2025-2035 (USD Billion)
      71. | | 7.15.3 BY SOURCE, 2025-2035 (USD Billion)
      72. | | 7.15.4 BY END USE, 2025-2035 (USD Billion)
      73. | 7.16 Japan MARKET SIZE ESTIMATES; FORECAST
      74. | | 7.16.1 BY APPLICATION, 2025-2035 (USD Billion)
      75. | | 7.16.2 BY FORM, 2025-2035 (USD Billion)
      76. | | 7.16.3 BY SOURCE, 2025-2035 (USD Billion)
      77. | | 7.16.4 BY END USE, 2025-2035 (USD Billion)
      78. | 7.17 South Korea MARKET SIZE ESTIMATES; FORECAST
      79. | | 7.17.1 BY APPLICATION, 2025-2035 (USD Billion)
      80. | | 7.17.2 BY FORM, 2025-2035 (USD Billion)
      81. | | 7.17.3 BY SOURCE, 2025-2035 (USD Billion)
      82. | | 7.17.4 BY END USE, 2025-2035 (USD Billion)
      83. | 7.18 Malaysia MARKET SIZE ESTIMATES; FORECAST
      84. | | 7.18.1 BY APPLICATION, 2025-2035 (USD Billion)
      85. | | 7.18.2 BY FORM, 2025-2035 (USD Billion)
      86. | | 7.18.3 BY SOURCE, 2025-2035 (USD Billion)
      87. | | 7.18.4 BY END USE, 2025-2035 (USD Billion)
      88. | 7.19 Thailand MARKET SIZE ESTIMATES; FORECAST
      89. | | 7.19.1 BY APPLICATION, 2025-2035 (USD Billion)
      90. | | 7.19.2 BY FORM, 2025-2035 (USD Billion)
      91. | | 7.19.3 BY SOURCE, 2025-2035 (USD Billion)
      92. | | 7.19.4 BY END USE, 2025-2035 (USD Billion)
      93. | 7.20 Indonesia MARKET SIZE ESTIMATES; FORECAST
      94. | | 7.20.1 BY APPLICATION, 2025-2035 (USD Billion)
      95. | | 7.20.2 BY FORM, 2025-2035 (USD Billion)
      96. | | 7.20.3 BY SOURCE, 2025-2035 (USD Billion)
      97. | | 7.20.4 BY END USE, 2025-2035 (USD Billion)
      98. | 7.21 Rest of APAC MARKET SIZE ESTIMATES; FORECAST
      99. | | 7.21.1 BY APPLICATION, 2025-2035 (USD Billion)
      100. | | 7.21.2 BY FORM, 2025-2035 (USD Billion)
      101. | | 7.21.3 BY SOURCE, 2025-2035 (USD Billion)
      102. | | 7.21.4 BY END USE, 2025-2035 (USD Billion)
      103. | 7.22 South America MARKET SIZE ESTIMATES; FORECAST
      104. | | 7.22.1 BY APPLICATION, 2025-2035 (USD Billion)
      105. | | 7.22.2 BY FORM, 2025-2035 (USD Billion)
      106. | | 7.22.3 BY SOURCE, 2025-2035 (USD Billion)
      107. | | 7.22.4 BY END USE, 2025-2035 (USD Billion)
      108. | 7.23 Brazil MARKET SIZE ESTIMATES; FORECAST
      109. | | 7.23.1 BY APPLICATION, 2025-2035 (USD Billion)
      110. | | 7.23.2 BY FORM, 2025-2035 (USD Billion)
      111. | | 7.23.3 BY SOURCE, 2025-2035 (USD Billion)
      112. | | 7.23.4 BY END USE, 2025-2035 (USD Billion)
      113. | 7.24 Mexico MARKET SIZE ESTIMATES; FORECAST
      114. | | 7.24.1 BY APPLICATION, 2025-2035 (USD Billion)
      115. | | 7.24.2 BY FORM, 2025-2035 (USD Billion)
      116. | | 7.24.3 BY SOURCE, 2025-2035 (USD Billion)
      117. | | 7.24.4 BY END USE, 2025-2035 (USD Billion)
      118. | 7.25 Argentina MARKET SIZE ESTIMATES; FORECAST
      119. | | 7.25.1 BY APPLICATION, 2025-2035 (USD Billion)
      120. | | 7.25.2 BY FORM, 2025-2035 (USD Billion)
      121. | | 7.25.3 BY SOURCE, 2025-2035 (USD Billion)
      122. | | 7.25.4 BY END USE, 2025-2035 (USD Billion)
      123. | 7.26 Rest of South America MARKET SIZE ESTIMATES; FORECAST
      124. | | 7.26.1 BY APPLICATION, 2025-2035 (USD Billion)
      125. | | 7.26.2 BY FORM, 2025-2035 (USD Billion)
      126. | | 7.26.3 BY SOURCE, 2025-2035 (USD Billion)
      127. | | 7.26.4 BY END USE, 2025-2035 (USD Billion)
      128. | 7.27 MEA MARKET SIZE ESTIMATES; FORECAST
      129. | | 7.27.1 BY APPLICATION, 2025-2035 (USD Billion)
      130. | | 7.27.2 BY FORM, 2025-2035 (USD Billion)
      131. | | 7.27.3 BY SOURCE, 2025-2035 (USD Billion)
      132. | | 7.27.4 BY END USE, 2025-2035 (USD Billion)
      133. | 7.28 GCC Countries MARKET SIZE ESTIMATES; FORECAST
      134. | | 7.28.1 BY APPLICATION, 2025-2035 (USD Billion)
      135. | | 7.28.2 BY FORM, 2025-2035 (USD Billion)
      136. | | 7.28.3 BY SOURCE, 2025-2035 (USD Billion)
      137. | | 7.28.4 BY END USE, 2025-2035 (USD Billion)
      138. | 7.29 South Africa MARKET SIZE ESTIMATES; FORECAST
      139. | | 7.29.1 BY APPLICATION, 2025-2035 (USD Billion)
      140. | | 7.29.2 BY FORM, 2025-2035 (USD Billion)
      141. | | 7.29.3 BY SOURCE, 2025-2035 (USD Billion)
      142. | | 7.29.4 BY END USE, 2025-2035 (USD Billion)
      143. | 7.30 Rest of MEA MARKET SIZE ESTIMATES; FORECAST
      144. | | 7.30.1 BY APPLICATION, 2025-2035 (USD Billion)
      145. | | 7.30.2 BY FORM, 2025-2035 (USD Billion)
      146. | | 7.30.3 BY SOURCE, 2025-2035 (USD Billion)
      147. | | 7.30.4 BY END USE, 2025-2035 (USD Billion)
      148. | 7.31 PRODUCT LAUNCH/PRODUCT DEVELOPMENT/APPROVAL
      149. | | 7.31.1
      150. | 7.32 ACQUISITION/PARTNERSHIP
      151. | | 7.32.1

    Pea Protein Market Segmentation

    Pea Protein Market By Application (USD Billion, 2019-2035)

    Food Beverages

    Nutritional Supplements

    Animal Feed

    Cosmetics

    Pharmaceuticals

    Pea Protein Market By Form (USD Billion, 2019-2035)

    Isolates

    Concentrates

    Textured Pea Protein

    Pea Protein Market By Source (USD Billion, 2019-2035)

    Yellow Pea

    Green Pea

    Other Peas

    Pea Protein Market By End Use (USD Billion, 2019-2035)

    Vegan Products

    Gluten-Free Products

    Meat Alternatives

    Pea Protein Market By Regional (USD Billion, 2019-2035)

    North America

    Europe

    South America

    Asia Pacific

    Middle East and Africa

    Pea Protein Market Regional Outlook (USD Billion, 2019-2035)

    North America Outlook (USD Billion, 2019-2035)

    North America Pea Protein Market by Application Type

    Food Beverages

    Nutritional Supplements

    Animal Feed

    Cosmetics

    Pharmaceuticals

    North America Pea Protein Market by Form Type

    Isolates

    Concentrates

    Textured Pea Protein

    North America Pea Protein Market by Source Type

    Yellow Pea

    Green Pea

    Other Peas

    North America Pea Protein Market by End Use Type

    Vegan Products

    Gluten-Free Products

    Meat Alternatives

    North America Pea Protein Market by Regional Type

    US

    Canada

    US Outlook (USD Billion, 2019-2035)

    US Pea Protein Market by Application Type

    Food Beverages

    Nutritional Supplements

    Animal Feed

    Cosmetics

    Pharmaceuticals

    US Pea Protein Market by Form Type

    Isolates

    Concentrates

    Textured Pea Protein

    US Pea Protein Market by Source Type

    Yellow Pea

    Green Pea

    Other Peas

    US Pea Protein Market by End Use Type

    Vegan Products

    Gluten-Free Products

    Meat Alternatives

    CANADA Outlook (USD Billion, 2019-2035)

    CANADA Pea Protein Market by Application Type

    Food Beverages

    Nutritional Supplements

    Animal Feed

    Cosmetics

    Pharmaceuticals

    CANADA Pea Protein Market by Form Type

    Isolates

    Concentrates

    Textured Pea Protein

    CANADA Pea Protein Market by Source Type

    Yellow Pea

    Green Pea

    Other Peas

    CANADA Pea Protein Market by End Use Type

    Vegan Products

    Gluten-Free Products

    Meat Alternatives

    Europe Outlook (USD Billion, 2019-2035)

    Europe Pea Protein Market by Application Type

    Food Beverages

    Nutritional Supplements

    Animal Feed

    Cosmetics

    Pharmaceuticals

    Europe Pea Protein Market by Form Type

    Isolates

    Concentrates

    Textured Pea Protein

    Europe Pea Protein Market by Source Type

    Yellow Pea

    Green Pea

    Other Peas

    Europe Pea Protein Market by End Use Type

    Vegan Products

    Gluten-Free Products

    Meat Alternatives

    Europe Pea Protein Market by Regional Type

    Germany

    UK

    France

    Russia

    Italy

    Spain

    Rest of Europe

    GERMANY Outlook (USD Billion, 2019-2035)

    GERMANY Pea Protein Market by Application Type

    Food Beverages

    Nutritional Supplements

    Animal Feed

    Cosmetics

    Pharmaceuticals

    GERMANY Pea Protein Market by Form Type

    Isolates

    Concentrates

    Textured Pea Protein

    GERMANY Pea Protein Market by Source Type

    Yellow Pea

    Green Pea

    Other Peas

    GERMANY Pea Protein Market by End Use Type

    Vegan Products

    Gluten-Free Products

    Meat Alternatives

    UK Outlook (USD Billion, 2019-2035)

    UK Pea Protein Market by Application Type

    Food Beverages

    Nutritional Supplements

    Animal Feed

    Cosmetics

    Pharmaceuticals

    UK Pea Protein Market by Form Type

    Isolates

    Concentrates

    Textured Pea Protein

    UK Pea Protein Market by Source Type

    Yellow Pea

    Green Pea

    Other Peas

    UK Pea Protein Market by End Use Type

    Vegan Products

    Gluten-Free Products

    Meat Alternatives

    FRANCE Outlook (USD Billion, 2019-2035)

    FRANCE Pea Protein Market by Application Type

    Food Beverages

    Nutritional Supplements

    Animal Feed

    Cosmetics

    Pharmaceuticals

    FRANCE Pea Protein Market by Form Type

    Isolates

    Concentrates

    Textured Pea Protein

    FRANCE Pea Protein Market by Source Type

    Yellow Pea

    Green Pea

    Other Peas

    FRANCE Pea Protein Market by End Use Type

    Vegan Products

    Gluten-Free Products

    Meat Alternatives

    RUSSIA Outlook (USD Billion, 2019-2035)

    RUSSIA Pea Protein Market by Application Type

    Food Beverages

    Nutritional Supplements

    Animal Feed

    Cosmetics

    Pharmaceuticals

    RUSSIA Pea Protein Market by Form Type

    Isolates

    Concentrates

    Textured Pea Protein

    RUSSIA Pea Protein Market by Source Type

    Yellow Pea

    Green Pea

    Other Peas

    RUSSIA Pea Protein Market by End Use Type

    Vegan Products

    Gluten-Free Products

    Meat Alternatives

    ITALY Outlook (USD Billion, 2019-2035)

    ITALY Pea Protein Market by Application Type

    Food Beverages

    Nutritional Supplements

    Animal Feed

    Cosmetics

    Pharmaceuticals

    ITALY Pea Protein Market by Form Type

    Isolates

    Concentrates

    Textured Pea Protein

    ITALY Pea Protein Market by Source Type

    Yellow Pea

    Green Pea

    Other Peas

    ITALY Pea Protein Market by End Use Type

    Vegan Products

    Gluten-Free Products

    Meat Alternatives

    SPAIN Outlook (USD Billion, 2019-2035)

    SPAIN Pea Protein Market by Application Type

    Food Beverages

    Nutritional Supplements

    Animal Feed

    Cosmetics

    Pharmaceuticals

    SPAIN Pea Protein Market by Form Type

    Isolates

    Concentrates

    Textured Pea Protein

    SPAIN Pea Protein Market by Source Type

    Yellow Pea

    Green Pea

    Other Peas

    SPAIN Pea Protein Market by End Use Type

    Vegan Products

    Gluten-Free Products

    Meat Alternatives

    REST OF EUROPE Outlook (USD Billion, 2019-2035)

    REST OF EUROPE Pea Protein Market by Application Type

    Food Beverages

    Nutritional Supplements

    Animal Feed

    Cosmetics

    Pharmaceuticals

    REST OF EUROPE Pea Protein Market by Form Type

    Isolates

    Concentrates

    Textured Pea Protein

    REST OF EUROPE Pea Protein Market by Source Type

    Yellow Pea

    Green Pea

    Other Peas

    REST OF EUROPE Pea Protein Market by End Use Type

    Vegan Products

    Gluten-Free Products

    Meat Alternatives

    APAC Outlook (USD Billion, 2019-2035)

    APAC Pea Protein Market by Application Type

    Food Beverages

    Nutritional Supplements

    Animal Feed

    Cosmetics

    Pharmaceuticals

    APAC Pea Protein Market by Form Type

    Isolates

    Concentrates

    Textured Pea Protein

    APAC Pea Protein Market by Source Type

    Yellow Pea

    Green Pea

    Other Peas

    APAC Pea Protein Market by End Use Type

    Vegan Products

    Gluten-Free Products

    Meat Alternatives

    APAC Pea Protein Market by Regional Type

    China

    India

    Japan

    South Korea

    Malaysia

    Thailand

    Indonesia

    Rest of APAC

    CHINA Outlook (USD Billion, 2019-2035)

    CHINA Pea Protein Market by Application Type

    Food Beverages

    Nutritional Supplements

    Animal Feed

    Cosmetics

    Pharmaceuticals

    CHINA Pea Protein Market by Form Type

    Isolates

    Concentrates

    Textured Pea Protein

    CHINA Pea Protein Market by Source Type

    Yellow Pea

    Green Pea

    Other Peas

    CHINA Pea Protein Market by End Use Type

    Vegan Products

    Gluten-Free Products

    Meat Alternatives

    INDIA Outlook (USD Billion, 2019-2035)

    INDIA Pea Protein Market by Application Type

    Food Beverages

    Nutritional Supplements

    Animal Feed

    Cosmetics

    Pharmaceuticals

    INDIA Pea Protein Market by Form Type

    Isolates

    Concentrates

    Textured Pea Protein

    INDIA Pea Protein Market by Source Type

    Yellow Pea

    Green Pea

    Other Peas

    INDIA Pea Protein Market by End Use Type

    Vegan Products

    Gluten-Free Products

    Meat Alternatives

    JAPAN Outlook (USD Billion, 2019-2035)

    JAPAN Pea Protein Market by Application Type

    Food Beverages

    Nutritional Supplements

    Animal Feed

    Cosmetics

    Pharmaceuticals

    JAPAN Pea Protein Market by Form Type

    Isolates

    Concentrates

    Textured Pea Protein

    JAPAN Pea Protein Market by Source Type

    Yellow Pea

    Green Pea

    Other Peas

    JAPAN Pea Protein Market by End Use Type

    Vegan Products

    Gluten-Free Products

    Meat Alternatives

    SOUTH KOREA Outlook (USD Billion, 2019-2035)

    SOUTH KOREA Pea Protein Market by Application Type

    Food Beverages

    Nutritional Supplements

    Animal Feed

    Cosmetics

    Pharmaceuticals

    SOUTH KOREA Pea Protein Market by Form Type

    Isolates

    Concentrates

    Textured Pea Protein

    SOUTH KOREA Pea Protein Market by Source Type

    Yellow Pea

    Green Pea

    Other Peas

    SOUTH KOREA Pea Protein Market by End Use Type

    Vegan Products

    Gluten-Free Products

    Meat Alternatives

    MALAYSIA Outlook (USD Billion, 2019-2035)

    MALAYSIA Pea Protein Market by Application Type

    Food Beverages

    Nutritional Supplements

    Animal Feed

    Cosmetics

    Pharmaceuticals

    MALAYSIA Pea Protein Market by Form Type

    Isolates

    Concentrates

    Textured Pea Protein

    MALAYSIA Pea Protein Market by Source Type

    Yellow Pea

    Green Pea

    Other Peas

    MALAYSIA Pea Protein Market by End Use Type

    Vegan Products

    Gluten-Free Products

    Meat Alternatives

    THAILAND Outlook (USD Billion, 2019-2035)

    THAILAND Pea Protein Market by Application Type

    Food Beverages

    Nutritional Supplements

    Animal Feed

    Cosmetics

    Pharmaceuticals

    THAILAND Pea Protein Market by Form Type

    Isolates

    Concentrates

    Textured Pea Protein

    THAILAND Pea Protein Market by Source Type

    Yellow Pea

    Green Pea

    Other Peas

    THAILAND Pea Protein Market by End Use Type

    Vegan Products

    Gluten-Free Products

    Meat Alternatives

    INDONESIA Outlook (USD Billion, 2019-2035)

    INDONESIA Pea Protein Market by Application Type

    Food Beverages

    Nutritional Supplements

    Animal Feed

    Cosmetics

    Pharmaceuticals

    INDONESIA Pea Protein Market by Form Type

    Isolates

    Concentrates

    Textured Pea Protein

    INDONESIA Pea Protein Market by Source Type

    Yellow Pea

    Green Pea

    Other Peas

    INDONESIA Pea Protein Market by End Use Type

    Vegan Products

    Gluten-Free Products

    Meat Alternatives

    REST OF APAC Outlook (USD Billion, 2019-2035)

    REST OF APAC Pea Protein Market by Application Type

    Food Beverages

    Nutritional Supplements

    Animal Feed

    Cosmetics

    Pharmaceuticals

    REST OF APAC Pea Protein Market by Form Type

    Isolates

    Concentrates

    Textured Pea Protein

    REST OF APAC Pea Protein Market by Source Type

    Yellow Pea

    Green Pea

    Other Peas

    REST OF APAC Pea Protein Market by End Use Type

    Vegan Products

    Gluten-Free Products

    Meat Alternatives

    South America Outlook (USD Billion, 2019-2035)

    South America Pea Protein Market by Application Type

    Food Beverages

    Nutritional Supplements

    Animal Feed

    Cosmetics

    Pharmaceuticals

    South America Pea Protein Market by Form Type

    Isolates

    Concentrates

    Textured Pea Protein

    South America Pea Protein Market by Source Type

    Yellow Pea

    Green Pea

    Other Peas

    South America Pea Protein Market by End Use Type

    Vegan Products

    Gluten-Free Products

    Meat Alternatives

    South America Pea Protein Market by Regional Type

    Brazil

    Mexico

    Argentina

    Rest of South America

    BRAZIL Outlook (USD Billion, 2019-2035)

    BRAZIL Pea Protein Market by Application Type

    Food Beverages

    Nutritional Supplements

    Animal Feed

    Cosmetics

    Pharmaceuticals

    BRAZIL Pea Protein Market by Form Type

    Isolates

    Concentrates

    Textured Pea Protein

    BRAZIL Pea Protein Market by Source Type

    Yellow Pea

    Green Pea

    Other Peas

    BRAZIL Pea Protein Market by End Use Type

    Vegan Products

    Gluten-Free Products

    Meat Alternatives

    MEXICO Outlook (USD Billion, 2019-2035)

    MEXICO Pea Protein Market by Application Type

    Food Beverages

    Nutritional Supplements

    Animal Feed

    Cosmetics

    Pharmaceuticals

    MEXICO Pea Protein Market by Form Type

    Isolates

    Concentrates

    Textured Pea Protein

    MEXICO Pea Protein Market by Source Type

    Yellow Pea

    Green Pea

    Other Peas

    MEXICO Pea Protein Market by End Use Type

    Vegan Products

    Gluten-Free Products

    Meat Alternatives

    ARGENTINA Outlook (USD Billion, 2019-2035)

    ARGENTINA Pea Protein Market by Application Type

    Food Beverages

    Nutritional Supplements

    Animal Feed

    Cosmetics

    Pharmaceuticals

    ARGENTINA Pea Protein Market by Form Type

    Isolates

    Concentrates

    Textured Pea Protein

    ARGENTINA Pea Protein Market by Source Type

    Yellow Pea

    Green Pea

    Other Peas

    ARGENTINA Pea Protein Market by End Use Type

    Vegan Products

    Gluten-Free Products

    Meat Alternatives

    REST OF SOUTH AMERICA Outlook (USD Billion, 2019-2035)

    REST OF SOUTH AMERICA Pea Protein Market by Application Type

    Food Beverages

    Nutritional Supplements

    Animal Feed

    Cosmetics

    Pharmaceuticals

    REST OF SOUTH AMERICA Pea Protein Market by Form Type

    Isolates

    Concentrates

    Textured Pea Protein

    REST OF SOUTH AMERICA Pea Protein Market by Source Type

    Yellow Pea

    Green Pea

    Other Peas

    REST OF SOUTH AMERICA Pea Protein Market by End Use Type

    Vegan Products

    Gluten-Free Products

    Meat Alternatives

    MEA Outlook (USD Billion, 2019-2035)

    MEA Pea Protein Market by Application Type

    Food Beverages

    Nutritional Supplements

    Animal Feed

    Cosmetics

    Pharmaceuticals

    MEA Pea Protein Market by Form Type

    Isolates

    Concentrates

    Textured Pea Protein

    MEA Pea Protein Market by Source Type

    Yellow Pea

    Green Pea

    Other Peas

    MEA Pea Protein Market by End Use Type

    Vegan Products

    Gluten-Free Products

    Meat Alternatives

    MEA Pea Protein Market by Regional Type

    GCC Countries

    South Africa

    Rest of MEA

    GCC COUNTRIES Outlook (USD Billion, 2019-2035)

    GCC COUNTRIES Pea Protein Market by Application Type

    Food Beverages

    Nutritional Supplements

    Animal Feed

    Cosmetics

    Pharmaceuticals

    GCC COUNTRIES Pea Protein Market by Form Type

    Isolates

    Concentrates

    Textured Pea Protein

    GCC COUNTRIES Pea Protein Market by Source Type

    Yellow Pea

    Green Pea

    Other Peas

    GCC COUNTRIES Pea Protein Market by End Use Type

    Vegan Products

    Gluten-Free Products

    Meat Alternatives

    SOUTH AFRICA Outlook (USD Billion, 2019-2035)

    SOUTH AFRICA Pea Protein Market by Application Type

    Food Beverages

    Nutritional Supplements

    Animal Feed

    Cosmetics

    Pharmaceuticals

    SOUTH AFRICA Pea Protein Market by Form Type

    Isolates

    Concentrates

    Textured Pea Protein

    SOUTH AFRICA Pea Protein Market by Source Type

    Yellow Pea

    Green Pea

    Other Peas

    SOUTH AFRICA Pea Protein Market by End Use Type

    Vegan Products

    Gluten-Free Products

    Meat Alternatives

    REST OF MEA Outlook (USD Billion, 2019-2035)

    REST OF MEA Pea Protein Market by Application Type

    Food Beverages

    Nutritional Supplements

    Animal Feed

    Cosmetics

    Pharmaceuticals

    REST OF MEA Pea Protein Market by Form Type

    Isolates

    Concentrates

    Textured Pea Protein

    REST OF MEA Pea Protein Market by Source Type

    Yellow Pea

    Green Pea

    Other Peas

    REST OF MEA Pea Protein Market by End Use Type

    Vegan Products

    Gluten-Free Products

    Meat Alternatives


    Infographic

    Free Sample Request

    Kindly complete the form below to receive a free sample of this Report

    Get Free Sample

    Customer Strories

    “I am very pleased with how market segments have been defined in a relevant way for my purposes (such as "Portable Freezers & refrigerators" and "last-mile"). In general the report is well structured. Thanks very much for your efforts.”

    Victoria Milne

    Founder
    Case Study
    Chemicals and Materials

    Compare Licence

    ×
    Features License Type
    Single User Multiuser License Enterprise User
    Price $4,950 $5,950 $7,250
    Maximum User Access Limit 1 User Upto 10 Users Unrestricted Access Throughout the Organization
    Free Customization
    Direct Access to Analyst
    Deliverable Format
    Platform Access
    Discount on Next Purchase 10% 15% 15%
    Printable Versions