Pea Fiber Market (2026 - 2035)

ID: MRFR/FnB/25820-HCR 128 Pages Snehal Singh Last Updated: October 13, 2026
Pea Fiber Market Size, Share, Industry Trend & Analysis Research Report By Category (Conventional, Natural/Organic), By Application (Food and Beverages, Dietary Supplements, Pet Food and Animal Feed, Pharmaceuticals, Other Application), By Region (North America, Europe, Asia-Pacific, South America, Middle East & Africa) - Forecast to 2035
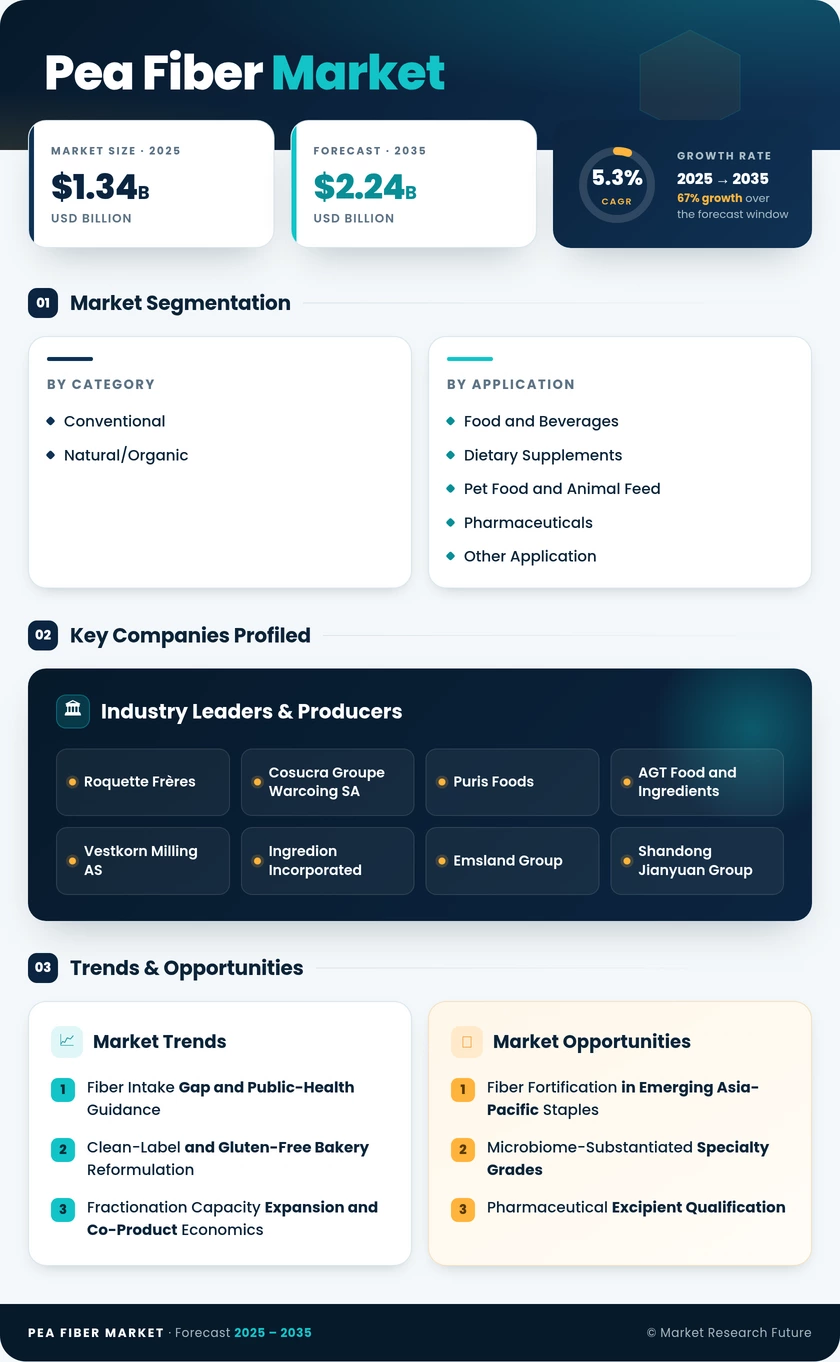
Pea Fiber Market
Market Size
Forecast Period2026-2035
CAGR (2026-2035)5.3%
2025 Market SizeUSD 1.34 Billion
2035 Market SizeUSD 2.24 Billion
Key Players
Roquette Frères
Cosucra Groupe Warcoing SA
Puris Foods
AGT Food and Ingredients
Vestkorn Milling AS
Ingredion Incorporated
Opportunities
  • Fiber Fortification in Emerging Asia-Pacific Staples
  • Microbiome-Substantiated Specialty Grades
  • Pharmaceutical Excipient Qualification
  1. 1 Market Summary | |
  2. 2 Key Report Takeaways | |
    1. 2.1 By Category | |
    2. 2.2 By Application | |
    3. 2.3 By Region | |
  3. 3 Market Size and Forecast (2021–2035) | |
  4. 4 Driver Impact Analysis | |
    1. 4.1 Fiber Intake Gap and Public-Health Guidance | |
    2. 4.2 Clean-Label and Gluten-Free Bakery Reformulation | |
    3. 4.3 Fractionation Capacity Expansion and Co-Product Economics | |
    4. 4.4 Texturizing Demand in Meat Analogues and Hybrid Meat | |
    5. 4.5 Gut-Health Supplement Positioning | |
    6. 4.6 Premium and Grain-Free Pet Food Formulation | |
  5. 5 Restraints Impact Analysis | |
    1. 5.1 Yellow Pea Price Volatility and Trade Disruption | |
    2. 5.2 Substitution by Lower-Cost Fibers | |
    3. 5.3 Sensory Limits at High Inclusion Rates | |
    4. 5.4 Plant-Based Meat Demand Correction | |
    5. 5.5 Divergent Fiber Labeling and Claim Rules | |
  6. 6 Opportunities | |
    1. 6.1 Fiber Fortification in Emerging Asia-Pacific Staples | |
    2. 6.2 Microbiome-Substantiated Specialty Grades | |
    3. 6.3 Pharmaceutical Excipient Qualification | |
    4. 6.4 Traceability and Carbon-Footprint Data Services | |
    5. 6.5 Reduced-Fat and Hybrid Processed Meat in Latin America | |
  7. 7 Regional Market Share and Country-Level Analysis | |
    1. 7.1 North America | | |
      1. 7.1.1 US | | |
      2. 7.1.2 Canada | | |
      3. 7.1.3 Mexico | |
    2. 7.2 Europe | | |
      1. 7.2.1 Germany | | |
      2. 7.2.2 UK | | |
      3. 7.2.3 France | | |
      4. 7.2.4 Italy | | |
      5. 7.2.5 Spain | | |
      6. 7.2.6 Nordic Countries | | |
      7. 7.2.7 Russia | | |
      8. 7.2.8 Rest of Europe | |
    3. 7.3 Asia-Pacific | | |
      1. 7.3.1 China | | |
      2. 7.3.2 India | | |
      3. 7.3.3 Japan | | |
      4. 7.3.4 South Korea | | |
      5. 7.3.5 ASEAN | | |
      6. 7.3.6 Rest of Asia-Pacific | |
    4. 7.4 South America | | |
      1. 7.4.1 Brazil | | |
      2. 7.4.2 Argentina | | |
      3. 7.4.3 Rest of South America | |
    5. 7.5 Middle East & Africa | | |
      1. 7.5.1 Saudi Arabia | | |
      2. 7.5.2 UAE | | |
      3. 7.5.3 South Africa | | |
      4. 7.5.4 Egypt | | |
      5. 7.5.5 Rest of MEA | |
  8. 8 Future Outlook (2026–2035) | |
    1. 8.1 Precision Milling and Process Digitization | |
    2. 8.2 Integrated Pulse Biorefinery Economics | |
    3. 8.3 Nitrogen Fixation and Scope 3 Reporting | |
    4. 8.4 Front-of-Pack Labeling and Health Claims | |
  9. 9 Segmentation Analysis | |
    1. 9.1 By Category | | |
      1. 9.1.1 Conventional | | |
      2. 9.1.2 Natural/Organic | |
    2. 9.2 By Application | | |
      1. 9.2.1 Food and Beverages | | |
      2. 9.2.2 Dietary Supplements | | |
      3. 9.2.3 Pet Food and Animal Feed | | |
      4. 9.2.4 Pharmaceuticals | | |
      5. 9.2.5 Other Application | |
  10. 10 Competitive Landscape | |
    1. 10.1 Market Concentration Analysis | |
    2. 10.2 Competitive Benchmarking Table | |
  11. 11 Recent News & Developments | |
  12. 12 Report Scope and Methodology | |
  13. 13 Detailed Sources and Citations | |
  14. 14 Frequently Asked Questions (FAQs) | | LIST OF TABLES | |
  15. TABLE 1 Market Snapshot Summary, 2025–2035 | |
  16. TABLE 2 Global Market Size & Forecast, by Revenue (USD Billion), 2021–2035 | |
  17. TABLE 3 Driver Impact Analysis | |
  18. TABLE 4 Restraints Impact Analysis | |
  19. TABLE 5 Regional Summary, 2025 | |
  20. TABLE 6 North America, by Country, 2025 | |
  21. TABLE 7 Europe, by Country, 2025 | |
  22. TABLE 8 Asia-Pacific, by Country, 2025 | |
  23. TABLE 9 South America, by Country, 2025 | |
  24. TABLE 10 Middle East & Africa, by Country, 2025 | |
  25. TABLE 11 Market Segmentation, by Category, 2025 | |
  26. TABLE 12 Market Segmentation, by Application, 2025 | |
  27. TABLE 13 Competitive Benchmarking Table | |
  28. TABLE 14 Report Scope and Methodology | |
  29. TABLE 15 Detailed Sources and Citations | |
  30. TABLE 16 Segmentation Quick Reference | | LIST OF FIGURES | |
  31. FIGURE 1 Market Dynamics Overview (Drivers, Restraints, Opportunities) | |
  32. FIGURE 2 Industry Value Chain Analysis | |
  33. FIGURE 3 Porter's Five Forces Analysis | |
  34. FIGURE 4 Global Market Size Trend, 2021–2035 (USD Billion) | |
  35. FIGURE 5 Market Share, by Category, 2025 | |
  36. FIGURE 6 Market Share, by Application, 2025 | |
  37. FIGURE 7 Regional Market Share, 2025 | |
  38. FIGURE 8 Asia-Pacific Growth Comparison, by Country, 2026–2035 | |
  39. FIGURE 9 Competitive Landscape, Revenue Share Ranges of Key Players | |
  40. FIGURE 10 Recent Developments Timeline, 2023–2025

Segmentation Quick Reference

DimensionSub-SegmentsDominant SegmentFastest Growing Segment
By CategoryConventional; Natural/OrganicConventional (81.2% share)Natural/Organic (8.2% CAGR)
By ApplicationFood and Beverages; Dietary Supplements; Pet Food and Animal Feed; Pharmaceuticals; Other ApplicationFood and Beverages (66.5% share)Dietary Supplements (7.7% CAGR)
By RegionNorth America; Europe; Asia-Pacific; South America; Middle East & AfricaNorth America (36.5% share)Asia-Pacific (6.9% CAGR)

Market Segmentation Overview

By Category

Sub-SegmentKey Trend
ConventionalCommodity yellow pea supply keeps pricing competitive for high-volume bakery and meat formulations.
Natural/OrganicIntegrated certified supply chains replace spot certification as premium brands scale.

Conventional pea fiber leads with an 81.2% share because Canadian, French, and German pea crops feed large fractionation plants that deliver predictable cost and volume. Natural/Organic grades grow fastest at an 8.2% CAGR as processors such as Roquette build certified Prairie sourcing directly into their plants, giving supplement and infant nutrition buyers traceable organic supply that spot-certified lots cannot guarantee.

By Application

Sub-SegmentKey Trend
Food and BeveragesGluten-free bakery and hybrid meat products drive steady inclusion growth
Dietary SupplementsMicrobiome research supports prebiotic positioning.
Pet Food and Animal FeedGrain-free and weight-management kibble adopts pulse fiber.
PharmaceuticalsExcipient consolidation opens tablet and capsule applications.
Other ApplicationPersonal care and industrial uses remain niche.

Food and Beverages lead with a 66.5% share, as bakers and meat processors rely on pea fiber's water binding and crumb structure to meet clean-label and healthy-claim requirements. Dietary Supplements grow fastest at a 7.7% CAGR because in vitro fermentation evidence lets brands position pea fiber as a gentler prebiotic than inulin. At the same time, Pharmaceuticals follow closely as excipient specialists qualify pulse-derived grades.


Download PDF ×

We do not share your information with anyone. However, we may send you emails based on your report interest from time to time. You may contact us at any time to opt-out.