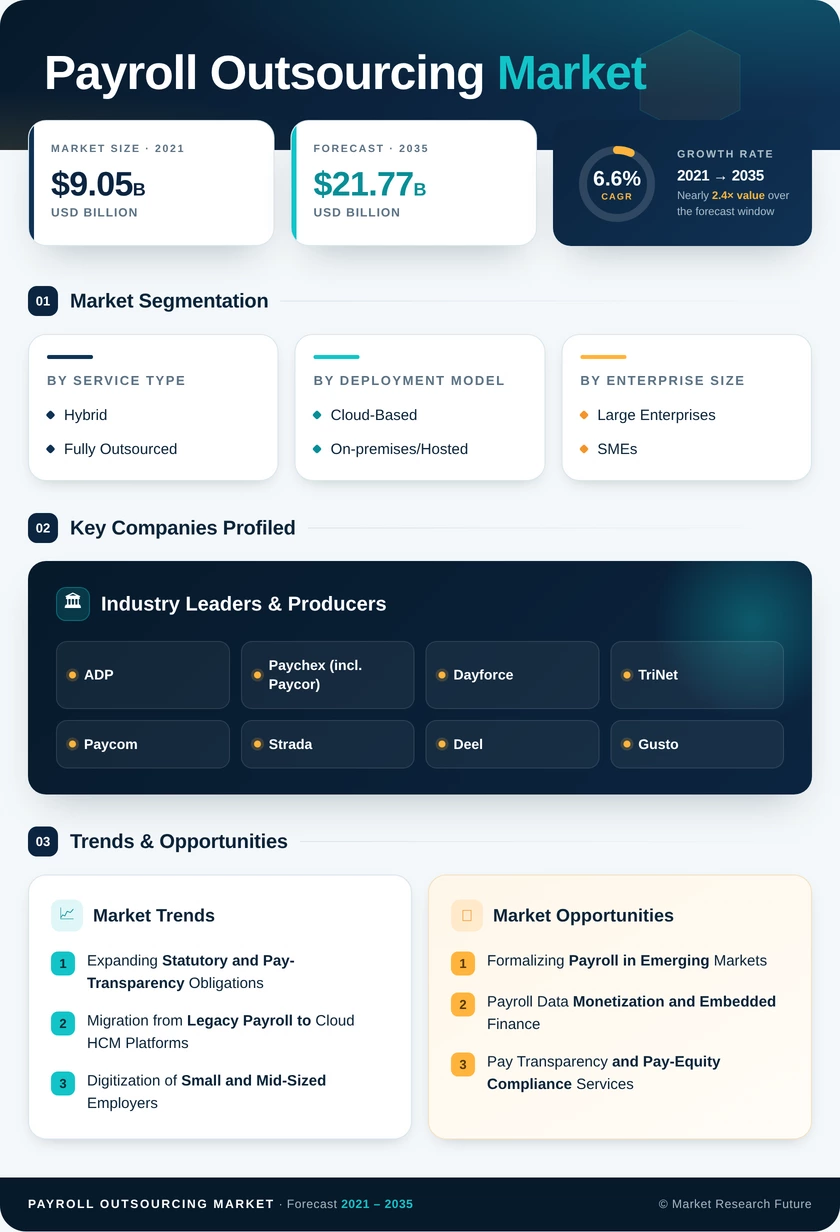
Payroll Outsourcing Market (2026 - 2035)

ID: MRFR/BS/32015-HCR 200 Pages Aarti Dhapte Last Updated: October 23, 2026

Payroll Outsourcing Market Size, Share and Research Report By Service Type (Hybrid, Fully Outsourced), By Deployment Model (Cloud-Based, On-Premises/Hosted), By Enterprise Size (Large Enterprises, SMEs), By End-User Vertical (BFSI, IT and Telecom, Healthcare and Life Sciences, Manufacturing, Retail, Government, Others), By Payroll Component (Core Pay-Run, Time and Attendance, Tax Filing and Compliance, Employee Self-Service, Analytics and Reporting) and By Regional (North America, Europe, Asia-Pacific, South America, Middle East & Africa) - Industry Forecast to 2035.

Payroll Outsourcing Market
Market Size
Forecast Period2026-2035
CAGR (2026-2035)6.6%
2025 Market SizeUSD 11.49 Billion
2035 Market SizeUSD 21.77 Billion
Key Players
ADP
Paychex
Dayforce
TriNet
Paycom
Strada
Opportunities
  • Formalizing Payroll in Emerging Markets
  • Payroll Data Monetization and Embedded Finance
  • Pay Transparency and Pay-Equity Compliance Services
  1. 1 Market Summary | |
  2. 2 Key Report Takeaways | |
    1. 2.1 By Service Type | |
    2. 2.2 By Deployment Model | |
    3. 2.3 By Enterprise Size | |
    4. 2.4 By End-User Vertical | |
    5. 2.5 By Payroll Component | |
    6. 2.6 By Region | |
  3. 3 Market Size and Forecast (2021–2035) | |
  4. 4 Driver Impact Analysis | |
    1. 4.1 Expanding Statutory and Pay-Transparency Obligations | |
    2. 4.2 Migration from Legacy Payroll to Cloud HCM Platforms | |
    3. 4.3 Digitization of Small and Mid-Sized Employers | |
    4. 4.4 Cross-Border Hiring and Multi-Country Workforces | |
    5. 4.5 AI-Assisted Payroll Validation and Anomaly Detection | |
    6. 4.6 US Tax Changes on Tips and Overtime | |
  5. 5 Restraints Impact Analysis | |
    1. 5.1 Data Privacy and Residency Obligations | |
    2. 5.2 Implementation and Transition Risk | |
    3. 5.3 Capable In-House HCM Software as a Substitute | |
    4. 5.4 Integration Cost and Vendor Lock-In | |
    5. 5.5 Fee Pressure from Aggressive Price Competition | |
  6. 6 Opportunities | |
    1. 6.1 Formalizing Payroll in Emerging Markets | |
    2. 6.2 Payroll Data Monetization and Embedded Finance | |
    3. 6.3 Pay Transparency and Pay-Equity Compliance Services | |
    4. 6.4 Consolidated Multi-Country Contracts | |
    5. 6.5 Public-Sector Shared Services | |
  7. 7 Regional Market Share and Country-Level Analysis | |
    1. 7.1 North America | | |
      1. 7.1.1 US | | |
      2. 7.1.2 Canada | | |
      3. 7.1.3 Mexico | |
    2. 7.2 Europe | | |
      1. 7.2.1 Germany | | |
      2. 7.2.2 UK | | |
      3. 7.2.3 France | | |
      4. 7.2.4 Italy | | |
      5. 7.2.5 Spain | | |
      6. 7.2.6 Nordic Countries | | |
      7. 7.2.7 Russia | | |
      8. 7.2.8 Rest of Europe | |
    3. 7.3 Asia-Pacific | | |
      1. 7.3.1 China | | |
      2. 7.3.2 India | | |
      3. 7.3.3 Japan | | |
      4. 7.3.4 South Korea | | |
      5. 7.3.5 ASEAN | | |
      6. 7.3.6 Rest of Asia-Pacific | |
    4. 7.4 South America | | |
      1. 7.4.1 Brazil | | |
      2. 7.4.2 Argentina | | |
      3. 7.4.3 Rest of South America | |
    5. 7.5 Middle East & Africa | | |
      1. 7.5.1 Saudi Arabia | | |
      2. 7.5.2 UAE | | |
      3. 7.5.3 South Africa | | |
      4. 7.5.4 Egypt | | |
      5. 7.5.5 Rest of Middle East & Africa | |
  8. 8 Future Outlook (2026–2035) | |
    1. 8.1 Agentic AI and Exception-Based Payroll | |
    2. 8.2 Platform Consolidation and Unified Workforce Suites | |
    3. 8.3 Real-Time Pay and Embedded Finance | |
    4. 8.4 Pay-Equity and Social Reporting | |
  9. 9 Segmentation Analysis | |
    1. 9.1 By Service Type | | |
      1. 9.1.1 Hybrid | | |
      2. 9.1.2 Fully Outsourced | |
    2. 9.2 By Deployment Model | | |
      1. 9.2.1 Cloud-Based | | |
      2. 9.2.2 On-premises/Hosted | |
    3. 9.3 By Enterprise Size | | |
      1. 9.3.1 Large Enterprises | | |
      2. 9.3.2 SMEs | |
    4. 9.4 By End-User Vertical | | |
      1. 9.4.1 BFSI | | |
      2. 9.4.2 IT & Telecom | | |
      3. 9.4.3 Healthcare and Life Sciences | | |
      4. 9.4.4 Manufacturing | | |
      5. 9.4.5 Retail | | |
      6. 9.4.6 Government | | |
      7. 9.4.7 Others | |
    5. 9.5 By Payroll Component | | |
      1. 9.5.1 Core Pay-Run | | |
      2. 9.5.2 Time & Attendance | | |
      3. 9.5.3 Tax Filing & Compliance | | |
      4. 9.5.4 Employee Self-Service | | |
      5. 9.5.5 Analytics & Reporting | |
  10. 10 Competitive Landscape | |
  11. 11 Recent News & Developments | |
  12. 12 Report Scope and Methodology | |
  13. 13 Detailed Sources and Citations | |
  14. 14 Frequently Asked Questions (FAQs) | | LIST OF TABLES | |
  15. TABLE 1 Global Market Size and Forecast, by Revenue (USD Billion), 2021–2035 | |
  16. TABLE 2 Driver Impact Analysis, 2026–2035 | |
  17. TABLE 3 Restraints Impact Analysis, 2026–2035 | |
  18. TABLE 4 Regional Summary, by Region, 2025 | |
  19. TABLE 5 North America Market, by Country | |
  20. TABLE 6 Europe Market, by Country | |
  21. TABLE 7 Asia-Pacific Market, by Country | |
  22. TABLE 8 South America Market, by Country | |
  23. TABLE 9 Middle East & Africa Market, by Country | |
  24. TABLE 10 Global Market, by Service Type | |
  25. TABLE 11 Global Market, by Deployment Model | |
  26. TABLE 12 Global Market, by Enterprise Size | |
  27. TABLE 13 Global Market, by End-User Vertical | |
  28. TABLE 14 Global Market, by Payroll Component | |
  29. TABLE 15 Competitive Benchmarking Matrix | |
  30. TABLE 16 Report Scope and Methodology | |
  31. TABLE 17 Detailed Sources and Citations | |
  32. TABLE 18 Segmentation Quick Reference | | LIST OF FIGURES | |
  33. FIGURE 1 Market Dynamics Overview (Drivers, Restraints, Opportunities) | |
  34. FIGURE 2 Payroll Outsourcing Value Chain Analysis | |
  35. FIGURE 3 Porter's Five Forces Analysis | |
  36. FIGURE 4 Global Market Size Trend, 2021–2035 (USD Billion) | |
  37. FIGURE 5 Year-over-Year Growth, 2021–2035 | |
  38. FIGURE 6 Market Share, by Service Type, 2025 | |
  39. FIGURE 7 Market Share, by Deployment Model, 2025 | |
  40. FIGURE 8 Market Share, by Enterprise Size, 2025 | |
  41. FIGURE 9 Market Share, by End-User Vertical, 2025 | |
  42. FIGURE 10 Market Share, by Payroll Component, 2025 | |
  43. FIGURE 11 Regional Market Share, 2025 | |
  44. FIGURE 12 Competitive Landscape Positioning Map

Segmentation Quick Reference

DimensionSub-SegmentsDominant SegmentFastest Growing Segment
By Service TypeHybrid, Fully OutsourcedHybrid (61.9% share)Fully Outsourced (7.8% CAGR)
By Deployment ModelCloud-Based, On-premises/HostedCloud-Based (84.9% share)Cloud-Based (84.9% share)
By Enterprise SizeLarge Enterprises, SMEsLarge Enterprises (59.1% share)SMEs (8.9% CAGR)
By End-User VerticalBFSI, IT & Telecom, Healthcare and Life Sciences, Manufacturing, Retail, Government, OthersBFSI (26.8% share)Healthcare and Life Sciences (9.0% CAGR)
By Payroll ComponentCore Pay-Run, Time & Attendance, Tax Filing & Compliance, Employee Self-Service, Analytics & ReportingCore Pay-Run (41.3% share)Analytics & Reporting (10.4% CAGR)
By RegionNorth America, Europe, Asia-Pacific, South America, Middle East & AfricaNorth America (38.4% share)Asia-Pacific (8.9% CAGR)


Market Segmentation Overview

By Service Type

Sub-SegmentKey Trend
HybridClients retain data validation and approvals while outsourcing calculation and filing.
Fully OutsourcedEnd-to-end hand-offs grow as trust in vendor controls rises.


Hybrid leads with a 61.9% share because employers still want approval control over pay data while privacy policies catch up with external hosting. Fully Outsourced grows fastest at 7.8% CAGR, as modular contracts let clients add tax filing and garnishment handling step by step until the full process sits with the provider.

By Deployment Model

Sub-SegmentKey Trend
Cloud-BasedSaaS delivery with automatic legislative updates and ERP integration
On-premises/HostedRetained in air-gapped defense, energy and public-sector settings


Cloud-Based both leads and grows fastest, holding an 84.9% share, because automatic rule updates and APIs remove upgrade projects. On-premises/Hosted grows at only 1.4% CAGR, limited to buyers with isolation mandates, and accredited government clouds keep eroding even that base.

By Enterprise Size

Sub-SegmentKey Trend
Large EnterprisesMulti-entity, multi-country contracts with high per-client value
SMEsSelf-onboarding portals and tiered SaaS pricing broaden adoption.


Large Enterprises dominate with 59.1% share, driven by complex entity structures and cross-border pay. SMEs grow fastest at 8.9% CAGR because outsourcing fees cost less than the penalty risk of handling multi-state or multi-country compliance with a small internal team.

By End-User Vertical

Sub-SegmentKey Trend
BFSIAudit-ready records across many legal entities
IT & TelecomDistributed and cross-border engineering workforces
Healthcare and Life SciencesShift differentials, union rules and credential-based pay
ManufacturingPlant-level allowances across currencies
RetailVariable hours and seasonal peaks
GovernmentShared-service payroll pilots
OthersEducation, hospitality and energy employers


BFSI leads with a 26.8% share because regulators expect traceable pay records across multiple entities. Healthcare and Life Sciences grows fastest at 9.0% CAGR, as rotating shifts, union differentials and credential-based pay scales overwhelm legacy hospital payroll systems and push providers toward healthcare-specific templates.

By Payroll Component

Sub-SegmentKey Trend
Core Pay-RunGross-to-net calculation remains the contract entry point
Time & AttendanceMobile and biometric capture synced to payroll.
Tax Filing & ComplianceHigh attach rates as statutory rules multiply.
Employee Self-ServicePortals reduce routine HR queries.
Analytics & ReportingLabour-cost dashboards for finance leaders


Core Pay-Run leads with a 41.3% share as the base module in nearly every contract. Analytics & Reporting grows fastest at 10.4% CAGR because CFOs want labour costs broken down by entity and location, and pay transparency rules demand compensation analysis that raw pay-run data cannot provide alone.


Download PDF ×

We do not share your information with anyone. However, we may send you emails based on your report interest from time to time. You may contact us at any time to opt-out.