• Cat-intel
  • MedIntelliX
  • Resources
  • About Us
  • Hero Background
    English
    Chinese
    French
    Japanese
    Korean
    German
    Spanish

    Palletizers Market Trends

    ID: MRFR/IA - E/10597-CR
    146 Pages
    Snehal Singh
    July 2025

    Palletizers Market Research Report Information by Palletizers Type (Conventional, Robotic, Cobot Palletizer), by Automation Level (Fully Automated, Semi-automated, Manual), by Application (Food & Beverages (Bottling & Canning, Packaged Food, Bakery & Confectionery, Others), Pharmaceuticals, Consumer Goods (Electronics Appliances, Household Products, Others), Industrial Goods, Others...

    Share:
    Download PDF ×

    We do not share your information with anyone. However, we may send you emails based on your report interest from time to time. You may contact us at any time to opt-out.

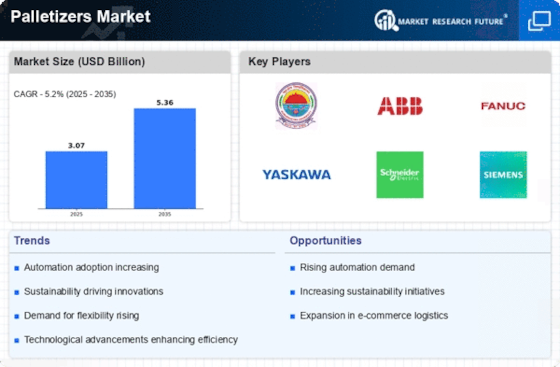
    Palletizers Market Infographic
    $ 4,950.0
    $ 5,950.0
    $ 7,250.0

    Market Trends

    Key Emerging Trends in the Palletizers Market

    The Palletizers market is undergoing significant transformations, shaped by various trends that reflect the dynamic nature of industrial automation and logistics. Rise in Adoption of Robotic Palletizers: One of the noticeable trends in the market is the increasing adoption of robotic palletizers. Companies are leveraging advanced robotic technologies to automate the palletizing process, enhancing efficiency and precision. Robotic palletizers offer the flexibility to handle diverse products and pallet configurations, making them a preferred choice for industries seeking to optimize their operations. Integration of Artificial Intelligence (AI) and Machine Learning (ML): The palletizers market is witnessing a trend towards the integration of AI and ML technologies. This enables palletizing systems to adapt and optimize their performance over time by learning from patterns and data. AI-driven palletizers can analyze various factors, such as product dimensions and stacking patterns, to optimize pallet loading and improve overall efficiency. Focus on Energy Efficiency and Sustainability: As businesses increasingly prioritize sustainability, the palletizers market is responding with a focus on energy-efficient solutions. Manufacturers are developing palletizing systems that consume less energy and incorporate sustainable materials. This shift aligns with the broader industry push towards reducing environmental impact and meeting sustainability goals. Customization and Flexibility in Palletizing Solutions: Companies are seeking palletizing solutions that offer customization and flexibility to accommodate diverse product types and packaging formats. Palletizers with adjustable configurations and the ability to handle a wide range of products contribute to operational versatility, enabling businesses to adapt to changing market demands more effectively. Remote Monitoring and Maintenance: The advent of Industry 4.0 has brought about a trend in remote monitoring and maintenance of palletizing systems. Companies are incorporating IoT (Internet of Things) technologies to enable real-time monitoring of palletizers, allowing for proactive maintenance and minimizing downtime. This trend enhances overall operational efficiency and reduces the need for on-site interventions. Collaborative Palletizing Systems: Collaborative robotics is gaining traction in the palletizers market. These systems work in collaboration with human workers, offering a safe and efficient solution for palletizing tasks. Collaborative palletizers are designed to operate alongside human workers, enhancing productivity and safety in warehouse environments. Increased Demand in E-commerce and Retail Fulfillment Centers: The growth of e-commerce has led to an increased demand for efficient palletizing solutions in fulfillment centers. Palletizers play a crucial role in automating the stacking and sorting of products for shipment, contributing to the scalability and speed required in modern e-commerce operations. Emphasis on User-Friendly Interfaces: Manufacturers are placing a greater emphasis on user-friendly interfaces for palletizing systems. Intuitive interfaces and easy programming enable operators to quickly set up and adjust palletizing configurations, reducing training time and enhancing overall usability. This trend aligns with the industry's goal of making automation technologies accessible to a broader range of businesses.

    Market Summary

    The global palletizers market is projected to grow from 3.07 USD billion in 2024 to 5.39 USD billion by 2035.

    Key Market Trends & Highlights

    Palletizers Key Trends and Highlights

    • The market is expected to experience a compound annual growth rate of 5.25 percent from 2025 to 2035.
    • By 2035, the global palletizers market is anticipated to reach a valuation of 5.39 USD billion.
    • In 2024, the market is valued at 3.07 USD billion, indicating a robust growth trajectory.
    • Growing adoption of automation technology due to increased efficiency demands is a major market driver.

    Market Size & Forecast

    2024 Market Size 3.07 (USD Billion)
    2035 Market Size 5.39 (USD Billion)
    CAGR (2025-2035) 5.25%
    Largest Regional Market Share in 2024 south_america)

    Major Players

    ONExia Inc., Columbia/Okura, LLC, Vention, Robotiq, Premier Tech Ltd., ProMach Inc., FlexLink, FORTNA Inc., Pacteon Group, Sidel

    Market Trends

    The Global Palletizers Market is poised for robust growth as industries increasingly adopt automation technologies to enhance efficiency and reduce labor costs.

    U.S. Department of Commerce

    Palletizers Market Market Drivers

    Market Growth Projections

    The Global Palletizers Market Industry is poised for substantial growth, with projections indicating a market value of 3.07 USD Billion in 2024 and an anticipated increase to 5.39 USD Billion by 2035. This growth trajectory reflects a compound annual growth rate of 5.25% from 2025 to 2035, driven by various factors such as automation, e-commerce expansion, and technological advancements. The market's evolution is expected to be influenced by the increasing demand for efficient and sustainable palletizing solutions across diverse industries. As businesses continue to adapt to changing market dynamics, the Global Palletizers Market Industry is likely to experience robust growth in the coming years.

    Growth in E-commerce Sector

    The Global Palletizers Market Industry is significantly influenced by the rapid expansion of the e-commerce sector. As online shopping continues to gain traction, the demand for efficient packaging and shipping solutions escalates. Automated palletizers play a crucial role in optimizing the logistics of e-commerce businesses, facilitating faster order fulfillment and reducing operational bottlenecks. The increasing volume of goods being shipped necessitates advanced palletizing solutions to manage inventory effectively. This growth trajectory is expected to contribute to the market's expansion, with projections indicating a market value of 5.39 USD Billion by 2035, underscoring the pivotal role of palletizers in the evolving retail landscape.

    Rising Demand for Automation

    The Global Palletizers Market Industry experiences a notable surge in demand for automation across various sectors, including food and beverage, pharmaceuticals, and consumer goods. This trend is driven by the need for increased efficiency and reduced labor costs. As companies strive to enhance productivity, automated palletizers are becoming essential. In 2024, the market is projected to reach 3.07 USD Billion, reflecting the growing inclination towards automated solutions. The shift towards automation not only streamlines operations but also minimizes human error, thereby improving overall output quality. This trend is expected to continue, with the market evolving to meet the needs of diverse industries.

    Sustainability Initiatives in Packaging

    Sustainability initiatives are gaining momentum within the Global Palletizers Market Industry, as companies seek to reduce their environmental impact. The push for eco-friendly packaging solutions is influencing palletizing practices, with manufacturers exploring sustainable materials and processes. Automated palletizers can facilitate the use of recyclable and biodegradable packaging, aligning with corporate sustainability goals. This trend not only addresses consumer preferences for environmentally responsible products but also helps companies comply with regulatory requirements. As sustainability becomes a core focus for businesses, the demand for palletizing solutions that support these initiatives is likely to increase, shaping the future of the market.

    Increased Focus on Supply Chain Efficiency

    The Global Palletizers Market Industry is witnessing a heightened focus on supply chain efficiency, driven by the need for businesses to optimize their operations. Companies are increasingly recognizing that efficient palletizing is integral to reducing lead times and improving overall supply chain performance. By implementing advanced palletizing systems, organizations can enhance their throughput and minimize handling costs. This trend is particularly relevant in industries where time-sensitive delivery is crucial. As businesses strive to remain competitive, the demand for efficient palletizing solutions is expected to rise, further propelling the market forward in the coming years.

    Technological Advancements in Palletizing Solutions

    Technological advancements are reshaping the Global Palletizers Market Industry, with innovations enhancing the efficiency and capabilities of palletizing systems. Developments such as robotics, artificial intelligence, and machine learning are being integrated into palletizers, allowing for greater flexibility and adaptability in operations. These technologies enable palletizers to handle a wider variety of products and packaging types, catering to the diverse needs of manufacturers. As a result, companies are increasingly investing in state-of-the-art palletizing solutions to stay competitive. The anticipated compound annual growth rate of 5.25% from 2025 to 2035 indicates a robust market response to these technological advancements.

    Market Segment Insights

    Palletizers Market

    Palletizers Market Segment Insights

    Palletizers

    Palletizers by Palletizers Type Insights

    Based on Palletizers Type, this segment includes Conventional, Robotic, Cobot Palletizer. The Conventional segment dominated the global market in 2024, while the Cobot Palletizer segment is projected to be the fastest–growing segment during the forecast period. Conventional Industrial Palletizers use mechanical systems such as conveyor belts, gravity rollers, and layer-forming mechanisms to arrange products onto pallets. 

    These palletizers are ideal for high-speed, high-volume production lines in industries like food & beverage, pharmaceuticals, and consumer goods. Their demand is driven by the need for high throughput in mass production facilities, where speed and efficiency are critical. Additionally, they provide a cost-effective bulk handling solution, making them a preferred choice for industries looking to automate without significant investments in robotics.

    FIGURE 2: PALLETIZERS MARKET SHARE BY TYPE 2024 AND 2035 (USD BILLION)

    Palletizers

    Based on Automation Level, this segment includes Fully Automated, Semi-automated, Manual. The Fully Automated segment dominated the global market in 2024, while it is projected to be the fastest–growing segment during the forecast period. A fully automated palletizer is an industrial system designed to stack and organize products onto pallets without human intervention, improving efficiency and safety. 

    These machines are widely used in food and beverage, pharmaceuticals, and consumer goods industries. In food and beverages, they handle packaged items like beverages and dairy products, ensuring hygienic and efficient palletizing. In pharmaceuticals, they precisely stack medication cartons and medical supplies to maintain product integrity. Consumer goods companies use them for household items, electronics, and personal care products. The growing demand for automation is driving adoption, as businesses seek higher productivity and efficiency. Rising labor costs and workforce shortages further accelerate the shift toward automation, reducing reliance on manual labor.

    Palletizers

    Based on Application, this segment includes Food & Beverages (Bottling & Canning, Packaged Food, Bakery & Confectionery, Others), Pharmaceuticals, Consumer Goods (Electronics Appliances, Household Products, Others), Industrial Goods, Others. The Food & Beverages segment dominated the global market in 2024, while the Consumer Goods segment is projected to be the fastest–growing segment during the forecast period. The food and beverage industry are a significant contributor to the global palletizer market. This substantial share underscores the industry's reliance on palletizing solutions to enhance operational efficiency and meet increasing production demands. 

    The adoption of palletizers in the food and beverage sector is driven by the need for automation to handle high-volume production, ensure product safety, and maintain consistency in packaging. Automated palletizing systems streamline the stacking and organizing of products, reducing manual labor and minimizing the risk of contamination, which is crucial in maintaining hygiene standards. Technological advancements, such as the integration of robotics and artificial intelligence, have further enhanced the capabilities of palletizers, making them more adaptable to various product types and packaging formats prevalent in the food and beverage industry.

    Get more detailed insights about Palletizers Market Research Report – Forecast Till 2035

    Regional Insights

    Based on the Region, the Global Palletizers are segmented into North America, Europe, Asia-Pacific, Middle East & Africa and South America. The Asia-Pacific segment dominated the global market in 2024, while the Asia-Pacific is projected to be the fastest–growing segment during the forecast period. Major demand factors driving the Asia-Pacific market are the rapid expansion of e-commerce and warehousing and surge in production volumes in industries such as food and beverage, pharmaceuticals, and consumer goods and the increasing demand for automation in manufacturing, packaging, and logistics. 

    The Asia Pacific palletizer market consists of countries including China, Japan, India, South Korea, Malaysia, Thailand, Indonesia, Australia, and Rest of Asia Pacific. The Asia Pacific region is emerging as one of the fastest-growing markets for palletizers, driven by rapid industrial expansion and substantial investments in automation infrastructure. Major economies like China, Japan, South Korea, and India are increasingly adopting both conventional and robotic palletizing systems to optimize production lines and enhance efficiency. The robust growth in the e-commerce sector across APAC is fueling demand for faster, more reliable logistics solutions, prompting manufacturers to modernize their material handling processes.

    FIGURE 3: PALLETIZERS MARKET VALUE BY REGION 2024 AND 2035 (USD BILLION)

    PALLETIZERS MARKET VALUE BY REGION 2024 AND 2035

    Source: Secondary Research, Primary Research, MRFR Database, and Analyst Review

    Further, the countries considered in the scope of the Application Tracking System Market are the US, Canada, Mexico, Germany, UK, France, Russia, Italy, Spain, China, India, Japan, South Korea, Malaysia, Thailand, Indonesia, Australia, GCC Countries. South Africa, Brazil, Argentina, Peru, Chile and others.

    Key Players and Competitive Insights

    Many global, regional, and local vendors characterize the Palletizers Market. The market is highly competitive, with all the players competing to gain market share. Intense competition, rapid advances in technology, frequent changes in government policies, and environmental regulations are key factors that confront market growth. The vendors compete based on cost, product quality, reliability, and government regulations. Vendors must provide cost-efficient, high-quality products to survive and succeed in an intensely competitive market.

    The major competitors in the market are ONExia Inc., Columbia/Okura, LLC, Vention, Robotiq, Premier Tech Ltd., ProMach Inc., FlexLink, FORTNA Inc., Pacteon Group, Sidel are among others. The Palletizers Market is a consolidated market due to increasing competition, acquisitions, mergers and other strategic market developments and decisions to improve operational effectiveness.

    Key Companies in the Palletizers Market market include

    Industry Developments

    February 2024: ESS Technologies, Inc., partnered with Phoenix Wrappers to create a compact collaborative robotic pallet cell integrated with a Phoenix stretch wrapper.

    October 2024: ProMach announced that it has introduced its Innovation Station, highlighting advancements in packaging technology, including robotic efficiency solutions such as the Brenton RL1000 Palletizer at Pack Expo International. These solutions aim to bring speed and flexibility to packaging end lines.

    March 2023: Sidel unveiled RoboAccess Pal S, a compact palletizer combining robotics and cobotics, designed to replace manual palletizing1. It features a lightweight, carbon fiber and 3D-printed clamping head, a patented folding guarding system, and a patented mobile physical curtain for operator safety during pallet changes.

    July 2022: Premier Tech announced that it has made an investment for its Systems and Automation business group worth USD 33 million for the construction of a new facility in Montgomery, Alabama. With the help of this major investment, the company strengthening its presence in America, and commitment toward its customers and the American market.

    Palletizers Market Segmentation

    Palletizers by Palletizers Type Outlook

    • Conventional
    • Robotic
    • Cobot Palletizer

    Palletizers by Automation Level Outlook

    • Fully Automated
    • Semi-automated
    • Manual

    Palletizers by Application Outlook

    • Food & Beverages
      • Bottling & Canning
      • Packaged Food
      • Bakery & Confectionery
      • Others
    • Pharmaceuticals
    • Consumer Goods
      • Electronics Appliances
      • Household Products
      • Others
    • Industrial Goods
    • Others

    Palletizers Regional Outlook

    • North America
      • US
      • Canada
      • Mexico
    • Europe
      • Germany
      • UK
      • France
      • Russia
      • Italy
      • Spain
      • Rest of Europe
    • Asia-Pacific
      • China
      • India
      • Japan
      • South Korea
      • Malaysia
      • Thailand
      • Indonesia
      • Australia
      • Rest of Asia-Pacific
    • Middle East & Africa
      • GCC Countries
      • South Africa
      • Rest of Middle East & Africa
    • South America
      • Brazil
      • Argentina
      • Peru
      • Chile
      • Rest of South America

    Future Outlook

    Palletizers Market Future Outlook

    The Global Palletizers Market is projected to grow at a 5.25% CAGR from 2024 to 2035, driven by automation, e-commerce expansion, and sustainability initiatives.

    New opportunities lie in:

    • Invest in AI-driven palletizing solutions to enhance efficiency and reduce labor costs.
    • Develop eco-friendly palletizers using sustainable materials to attract environmentally conscious clients.
    • Expand service offerings to include maintenance and upgrades for existing palletizing systems.

    By 2035, the Palletizers Market is expected to exhibit robust growth, reflecting evolving industry demands and technological advancements.

    Market Segmentation

    Type Outlook

    • Conventional
    • Robotic
    • Cobot Palletizer

    Regional Outlook

    • US
    • Canada
    • Mexico

    by Application Outlook

    • Bottling & Canning
    • Packaged Food
    • Bakery & Confectionery
    • Others

    by Automation Level Outlook

    • Fully Automated
    • Semi-automated
    • Manual

    Palletizers Regional Outlook

    • US
    • Canada
    • Mexico

    Palletizers by Application Outlook

    • Bottling & Canning
    • Packaged Food
    • Bakery & Confectionery
    • Others

    Palletizers by Automation Level Outlook

    • Fully Automated
    • Semi-automated
    • Manual

    Palletizers by Palletizers Type Outlook

    • Conventional
    • Robotic
    • Cobot Palletizer

    Report Scope

    Report Attribute/Metric Details
    Market Size 2024 USD 3.07 Billion
    Market Size 2025 USD 3.23 Billion
    Market Size 2035 USD 5.39 Billion
    Compound Annual Growth Rate (CAGR) 5.2% (2025-2035)
    Base Year 2024
    Forecast Period 2025-2035
    Historical Data 2019-2023
    Forecast Units Value (USD Billion)
    Report Coverage Revenue Forecast, Competitive Landscape, Growth Factors, and Trends
    Segments Covered By Palletizer Type, By Automation Level, By Application
    Geographies Covered North America, Europe, Asia Pacific, Middle East & Africa, South America
    Countries Covered The US, Canada, Mexico, Germany, UK, France, Russia, Italy, Spain, China, India, Japan, South Korea, Malaysia, Thailand, Indonesia, Australia, GCC Countries. South Africa, Brazil, Argentina, Peru, Chile
    Key Companies Profiled ONExia Inc., Columbia/Okura, LLC, Vention, Robotiq, Premier Tech Ltd., ProMach Inc., FlexLink, FORTNA Inc., Pacteon Group, Sidel
    Key Market Opportunities ·         Growing demand for Customization and Flexibility for Palletizers
    Key Market Dynamics ·         Rapid expansion of e-commerce and warehousing ·         Surge in production volumes in industries such as food and beverage, pharmaceuticals, and consumer goods ·         Increasing demand for automation in manufacturing, packaging, and logistics

    Market Highlights

    Author

    Snehal Singh
    Assistant Manager - Research

    She holds an experience of about 6+ years in market research and business consulting, working under the spectrum of information communication technology, telecommunications and semiconductor domains. aarti conceptualizes and implements a scalable business strategy and provides strategic leadership to the clients. her expertise lies in market estimation, competitive intelligence, pipeline analysis, customer assessment, etc.

    Leave a Comment

    Latest Comments

    John Doe
    john@example.com

    This is a great article! Really helped me understand the topic better.

    Posted on July 23, 2025, 10:15 AM
    Jane Smith
    jane@domain.com

    Thanks for sharing this. I’ve bookmarked it for later reference.

    Posted on July 22, 2025, 7:45 PM

    FAQs

    How much is the Palletizers Market?

    USD 3.07 Billion is the Palletizers Market in 2024

    Which Palletizers Type holds the largest market share?

    The Conventional segment by Component holds the largest market share and grows at a CAGR of 4.7 % during the forecast period.

    Which region holds the largest market share in the Palletizers Market?

    Asia-Pacific holds the largest market share in the Palletizers Market.

    Who are the prominent players in the Palletizers Market?

    ONExia Inc., Columbia/Okura, LLC, Vention, Robotiq, Premier Tech Ltd., ProMach Inc., FlexLink, FORTNA Inc., Pacteon Group, Sidel are the prominent players in the Palletizers Market.

    Which Application of segment led the Palletizers Market?

    The Food & Beverages segment dominated the market in 2024.

    1. Table of Contents
    2. Executive Summary
    3. Market Introduction
      1. DEFINITION
      2. Scope of the Study
      3. RESEARCH OBJECTIVE
      4. MARKET STRUCTURE
    4. Research Methodology
      1. OVERVIEW
      2. DATA FLOW
        1. DATA MINING PROCESS
      3. PURCHASED DATABASE:
      4. SECONDARY SOURCES:
        1. SECONDARY RESEARCH DATA FLOW:
      5. PRIMARY RESEARCH:
        1. PRIMARY RESEARCH DATA FLOW:
        2. PRIMARY RESEARCH: NUMBER OF INTERVIEWS CONDUCTED
        3. PRIMARY RESEARCH: REGIONAL COVERAGE
      6. APPROACHES FOR MARKET SIZE ESTIMATION:
        1. REVENUE ANALYSIS APPROACH
      7. DATA FORECASTING
        1. DATA FORECASTING TECHNIQUE
      8. DATA MODELING
        1. MICROECONOMIC FACTOR ANALYSIS:
        2. DATA MODELING:
      9. TEAMS AND ANALYST CONTRIBUTION
    5. MARKET DYNAMICS
      1. INTRODUCTION
      2. DRIVERS
        1. RAPID EXPANSION OF E-COMMERCE AND WAREHOUSING
        2. SURGE IN PRODUCTION VOLUMES IN INDUSTRIES SUCH AS FOOD AND BEVERAGE, PHARMACEUTICALS, AND CONSUMER GOODS
        3. INCREASING DEMAND FOR AUTOMATION IN MANUFACTURING, PACKAGING, AND LOGISTICS
        4. DRIVER IMPACT ANALYSIS
      3. RESTRAINTS
        1. HIGH INITIAL INVESTMENT REQUIRED FOR ADVANCED PALLETIZING SYSTEMS
        2. COMPLEXITY OF INTEGRATION INTO EXISTING MANUFACTURING PROCESSES CAN BE COMPLEX AND TIME-CONSUMING
        3. RESTRAINT IMPACT ANALYSIS
      4. OPPORTUNITY
        1. GROWING DEMAND FOR CUSTOMIZATION AND FLEXIBILITY FOR PALLETIZERS
      5. IMPACT ANALYSIS OF COVID-19
        1. IMPACT ON OVERALL PACKAGING INDUSTRY
        2. IMPACT ON PALLETIZERS MARKET
        3. IMPACT ON SUPPLY CHAIN OF PALLETIZER
        4. IMPACT ON MARKET DEMAND OF PALLETIZERS
        5. IMPACT ON PRICING OF PALLETIZERS
    6. MARKET FACTOR ANALYSIS
      1. SUPPLY CHAIN ANALYSIS
        1. RAW MATERIAL/COMPONENTS PROVIDERS
        2. MANUFACTURING
        3. DISTRIBUTORS & RETAILERS
        4. APPLICATION
      2. PORTER’S FIVE FORCES MODEL
        1. THREAT OF NEW ENTRANTS (MODERATE)
        2. BARGAINING POWER OF SUPPLIERS (MODERATE)
        3. THREAT OF SUBSTITUTES (LOW)
        4. BARGAINING POWER OF BUYERS (MODERATE)
        5. INTENSITY OF RIVALRY (HIGH)
    7. GLOBAL PALLETIZERS MARKET, BY PALLETIZER TYPE
      1. INTRODUCTION
      2. CONVENTIONAL
      3. ROBOTIC
      4. COBOT PALLETIZER
    8. GLOBAL PALLETIZERS MARKET, BY AUTOMATION LEVEL
      1. INTRODUCTION
      2. FULLY AUTOMATED
      3. SEMI AUTOMATED
      4. MANUAL
    9. GLOBAL PALLETIZERS MARKET, BY APPLICATION
      1. INTRODUCTION
      2. FOOD & BEVERAGE
      3. PHARMACEUTICAL
      4. CONSUMER GOODS
      5. INDUSTRIAL GOODS
      6. OTHERS
    10. GLOBAL PALLETIZERS MARKET, BY REGION
      1. OVERVIEW
      2. NORTH AMERICA
        1. US
        2. CANADA
        3. MEXICO
      3. EUROPE
        1. GERMANY
        2. UK
        3. FRANCE
        4. RUSSIA
        5. ITALY
        6. SPAIN
        7. REST OF EUROPE
      4. ASIA-PACIFIC
        1. CHINA
        2. INDIA
        3. JAPAN
        4. SOUTH KOREA
        5. MALAYSIA
        6. THAILAND
        7. INDONESIA
        8. AUSTRALIA
        9. REST OF ASIA-PACIFIC
      5. MIDDLE EAST & AFRICA (MEA)
        1. GCC COUNTRIES
        2. SOUTH AFRICA
        3. REST OF MEA
      6. SOUTH AMERICA
        1. BRAZIL
        2. ARGENTINA
        3. PERU
        4. CHILE
        5. REST OF SOUTH AMERICA
    11. Competitive Landscape
      1. INTRODUCTION
      2. COMPETITOR DASHBOARD
      3. THE LEADING PLAYER IN TERMS OF THE NUMBER OF RECENT DEVELOPMENTS IN THE MARKET
      4. KEY DEVELOPMENTS & GROWTH STRATEGIES
        1. PRODUCT LAUNCH
        2. CONTRACTS, JOINT VENTURE, COLLABORATION & PARNERSHIP
        3. EXPANSION & INVESTMENT
    12. COMPANY PROFILES
      1. ONEXIA INC.
        1. COMPANY OVERVIEW
        2. FINANCIAL OVERVIEW
        3. PRODUCTS OFFERED
        4. KEY DEVELOPMENTS
        5. SWOT ANALYSIS
        6. KEY STRATEGIES
      2. COLUMBIA/OKURA, LLC
        1. COMPANY OVERVIEW
        2. FINANCIAL OVERVIEW
        3. PRODUCTS OFFERED
        4. KEY DEVELOPMENTS
        5. SWOT ANALYSIS
        6. KEY STRATEGIES
      3. VENTION
        1. COMPANY OVERVIEW
        2. FINANCIAL OVERVIEW
        3. PRODUCTS OFFERED
        4. KEY DEVELOPMENTS
        5. SWOT ANALYSIS
        6. KEY STRATEGIES
      4. ROBOTIQ
        1. COMPANY OVERVIEW
        2. FINANCIAL OVERVIEW
        3. PRODUCTS OFFERED
        4. KEY DEVELOPMENTS
        5. SWOT ANALYSIS
        6. KEY STRATEGIES
      5. PREMIER TECH LTD.
        1. COMPANY OVERVIEW
        2. FINANCIAL OVERVIEW
        3. PRODUCTS OFFERED
        4. KEY DEVELOPMENTS
        5. SWOT ANALYSIS
        6. KEY STRATEGIES
      6. PROMACH INC.
        1. COMPANY OVERVIEW
        2. FINANCIAL OVERVIEW
        3. PRODUCTS OFFERED
        4. KEY DEVELOPMENTS
        5. SWOT ANALYSIS
        6. KEY STRATEGIES
      7. FLEXLINK
        1. COMPANY OVERVIEW
        2. FINANCIAL OVERVIEW
        3. PRODUCTS OFFERED
        4. KEY DEVELOPMENTS
        5. SWOT ANALYSIS
        6. KEY STRATEGIES
      8. FORTNA INC.
        1. COMPANY OVERVIEW
        2. FINANCIAL OVERVIEW
        3. PRODUCTS OFFERED
        4. KEY DEVELOPMENTS
        5. SWOT ANALYSIS
        6. KEY STRATEGIES
      9. PACTEON GROUP
        1. COMPANY OVERVIEW
        2. FINANCIAL OVERVIEW
        3. PRODUCTS OFFERED
        4. KEY DEVELOPMENTS
        5. SWOT ANALYSIS
        6. KEY STRATEGIES
      10. SIDEL
        1. COMPANY OVERVIEW
        2. FINANCIAL OVERVIEW
        3. PRODUCTS OFFERED
        4. KEY DEVELOPMENTS
        5. SWOT ANALYSIS
        6. KEY STRATEGIES    
    13. List of Tables and Figures
      1. LIST OF TABLES
      2. TABLE 1 QFD MODELING FOR MARKET SHARE ASSESSMENT
      3. TABLE 2 GLOBAL PALLETIZERS MARKET, BY PALLETIZER TYPE, 2020-2035 (USD BILLION)
      4. TABLE 3 GLOBAL PALLETIZERS MARKET, BY AUTOMATION LEVEL, 2020-2035 (USD BILLION)
      5. TABLE 4 GLOBAL PALLETIZERS MARKET, BY APPLICATION, 2020-2035 (USD BILLION)
      6. TABLE 5 GLOBAL PALLETIZERS MARKET, BY FOOD & BEVERAGES, 2020-2035 (USD BILLION)
      7. TABLE 6 GLOBAL PALLETIZERS MARKET, BY CONSUMER GOODS, 2020-2035 (USD BILLION)
      8. TABLE 7 GLOBAL PALLETIZERS MARKET, BY REGION, 2020-2035 (USD BILLION)
      9. TABLE 8 NORTH AMERICA: PALLETIZERS MARKET, BY COUNTRY, 2020-2035 (USD BILLION)
      10. TABLE 9 NORTH AMERICA: PALLETIZERS MARKET, BY PALLETIZER TYPE, 2020-2035 (USD BILLION)
      11. TABLE 10 NORTH AMERICA: PALLETIZERS MARKET, BY AUTOMATION LEVEL, 2020-2035 (USD BILLION)
      12. TABLE 11 NORTH AMERICA: PALLETIZERS MARKET, BY APPLICATION, 2020-2035 (USD BILLION)
      13. TABLE 12 NORTH AMERICA: PALLETIZERS MARKET, BY FOOD & BEVERAGES, 2020-2035 (USD BILLION)
      14. TABLE 13 NORTH AMERICA: PALLETIZERS MARKET, BY CONSUMER GOODS, 2020-2035 (USD BILLION)
      15. TABLE 14 US: PALLETIZERS MARKET, BY PALLETIZER TYPE, 2020-2035 (USD BILLION)
      16. TABLE 15 US: PALLETIZERS MARKET, BY AUTOMATION LEVEL, 2020-2035 (USD BILLION)
      17. TABLE 16 US: PALLETIZERS MARKET, BY APPLICATION, 2020-2035 (USD BILLION)
      18. TABLE 17 US: PALLETIZERS MARKET, BY FOOD & BEVERAGES, 2020-2035 (USD BILLION)
      19. TABLE 18 US: PALLETIZERS MARKET, BY CONSUMER GOODS, 2020-2035 (USD BILLION)
      20. TABLE 19 CANADA: PALLETIZERS MARKET, BY PALLETIZER TYPE, 2020-2035 (USD BILLION)
      21. TABLE 20 CANADA: PALLETIZERS MARKET, BY AUTOMATION LEVEL, 2020-2035 (USD BILLION)
      22. TABLE 21 CANADA: PALLETIZERS MARKET, BY APPLICATION, 2020-2035 (USD BILLION)
      23. TABLE 22 CANADA: PALLETIZERS MARKET, BY FOOD & BEVERAGES, 2020-2035 (USD BILLION)
      24. TABLE 23 CANADA: PALLETIZERS MARKET, BY CONSUMER GOODS, 2020-2035 (USD BILLION)
      25. TABLE 24 MEXICO: PALLETIZERS MARKET, BY PALLETIZER TYPE, 2020-2035 (USD BILLION)
      26. TABLE 25 MEXICO: PALLETIZERS MARKET, BY AUTOMATION LEVEL, 2020-2035 (USD BILLION)
      27. TABLE 26 MEXICO: PALLETIZERS MARKET, BY APPLICATION, 2020-2035 (USD BILLION)
      28. TABLE 27 MEXICO: PALLETIZERS MARKET, BY FOOD & BEVERAGES, 2020-2035 (USD BILLION)
      29. TABLE 28 MEXICO: PALLETIZERS MARKET, BY CONSUMER GOODS, 2020-2035 (USD BILLION)
      30. TABLE 29 EUROPE: PALLETIZERS MARKET, BY COUNTRY, 2020-2035 (USD BILLION)
      31. TABLE 30 EUROPE: PALLETIZERS MARKET, BY PALLETIZER TYPE, 2020-2035 (USD BILLION)
      32. TABLE 31 EUROPE: PALLETIZERS MARKET, BY AUTOMATION LEVEL, 2020-2035 (USD BILLION)
      33. TABLE 32 EUROPE: PALLETIZERS MARKET, BY APPLICATION, 2020-2035 (USD BILLION)
      34. TABLE 33 EUROPE: PALLETIZERS MARKET, BY FOOD & BEVERAGES, 2020-2035 (USD BILLION)
      35. TABLE 34 EUROPE: PALLETIZERS MARKET, BY CONSUMER GOODS, 2020-2035 (USD BILLION)
      36. TABLE 35 GERMANY: PALLETIZERS MARKET, BY PALLETIZER TYPE, 2020-2035 (USD BILLION)
      37. TABLE 36 GERMANY: PALLETIZERS MARKET, BY AUTOMATION LEVEL, 2020-2035 (USD BILLION)
      38. TABLE 37 GERMANY: PALLETIZERS MARKET, BY APPLICATION, 2020-2035 (USD BILLION)
      39. TABLE 38 GERMANY: PALLETIZERS MARKET, BY FOOD & BEVERAGES, 2020-2035 (USD BILLION)
      40. TABLE 39 GERMANY: PALLETIZERS MARKET, BY CONSUMER GOODS, 2020-2035 (USD BILLION)
      41. TABLE 40 UK: PALLETIZERS MARKET, BY PALLETIZER TYPE, 2020-2035 (USD BILLION)
      42. TABLE 41 UK: PALLETIZERS MARKET, BY AUTOMATION LEVEL, 2020-2035 (USD BILLION)
      43. TABLE 42 UK: PALLETIZERS MARKET, BY APPLICATION, 2020-2035 (USD BILLION)
      44. TABLE 43 UK: PALLETIZERS MARKET, BY FOOD & BEVERAGES, 2020-2035 (USD BILLION)
      45. TABLE 44 UK: PALLETIZERS MARKET, BY CONSUMER GOODS, 2020-2035 (USD BILLION)
      46. TABLE 45 FRANCE: PALLETIZERS MARKET, BY PALLETIZER TYPE, 2020-2035 (USD BILLION)
      47. TABLE 46 FRANCE: PALLETIZERS MARKET, BY AUTOMATION LEVEL, 2020-2035 (USD BILLION)
      48. TABLE 47 FRANCE: PALLETIZERS MARKET, BY APPLICATION, 2020-2035 (USD BILLION)
      49. TABLE 48 FRANCE: PALLETIZERS MARKET, BY FOOD & BEVERAGES, 2020-2035 (USD BILLION)
      50. TABLE 49 FRANCE: PALLETIZERS MARKET, BY CONSUMER GOODS, 2020-2035 (USD BILLION)
      51. TABLE 50 RUSSIA: PALLETIZERS MARKET, BY PALLETIZER TYPE, 2020-2035 (USD BILLION)
      52. TABLE 51 RUSSIA: PALLETIZERS MARKET, BY AUTOMATION LEVEL, 2020-2035 (USD BILLION)
      53. TABLE 52 RUSSIA: PALLETIZERS MARKET, BY APPLICATION, 2020-2035 (USD BILLION)
      54. TABLE 53 RUSSIA: PALLETIZERS MARKET, BY FOOD & BEVERAGES, 2020-2035 (USD BILLION)
      55. TABLE 54 RUSSIA: PALLETIZERS MARKET, BY CONSUMER GOODS, 2020-2035 (USD BILLION)
      56. TABLE 55 ITALY: PALLETIZERS MARKET, BY PALLETIZER TYPE, 2020-2035 (USD BILLION)
      57. TABLE 56 ITALY: PALLETIZERS MARKET, BY AUTOMATION LEVEL, 2020-2035 (USD BILLION)
      58. TABLE 57 ITALY: PALLETIZERS MARKET, BY APPLICATION, 2020-2035 (USD BILLION)
      59. TABLE 58 ITALY: PALLETIZERS MARKET, BY FOOD & BEVERAGES, 2020-2035 (USD BILLION)
      60. TABLE 59 ITALY: PALLETIZERS MARKET, BY CONSUMER GOODS, 2020-2035 (USD BILLION)
      61. TABLE 60 SPAIN: PALLETIZERS MARKET, BY PALLETIZER TYPE, 2020-2035 (USD BILLION)
      62. TABLE 61 SPAIN: PALLETIZERS MARKET, BY AUTOMATION LEVEL, 2020-2035 (USD BILLION)
      63. TABLE 62 SPAIN: PALLETIZERS MARKET, BY APPLICATION, 2020-2035 (USD BILLION)
      64. TABLE 63 SPAIN: PALLETIZERS MARKET, BY FOOD & BEVERAGES, 2020-2035 (USD BILLION)
      65. TABLE 64 SPAIN: PALLETIZERS MARKET, BY CONSUMER GOODS, 2020-2035 (USD BILLION)
      66. TABLE 65 REST OF EUROPE: PALLETIZERS MARKET, BY PALLETIZER TYPE, 2020-2035 (USD BILLION)
      67. TABLE 66 REST OF EUROPE: PALLETIZERS MARKET, BY AUTOMATION LEVEL, 2020-2035 (USD BILLION)
      68. TABLE 67 REST OF EUROPE: PALLETIZERS MARKET, BY APPLICATION, 2020-2035 (USD BILLION)
      69. TABLE 68 REST OF EUROPE: PALLETIZERS MARKET, BY FOOD & BEVERAGES, 2020-2035 (USD BILLION)
      70. TABLE 69 REST OF EUROPE: PALLETIZERS MARKET, BY CONSUMER GOODS, 2020-2035 (USD BILLION)
      71. TABLE 70 ASIA-PACIFIC: PALLETIZERS MARKET, BY COUNTRY, 2020-2035 (USD BILLION)
      72. TABLE 71 ASIA-PACIFIC: PALLETIZERS MARKET, BY PALLETIZER TYPE, 2020-2035 (USD BILLION)
      73. TABLE 72 ASIA-PACIFIC: PALLETIZERS MARKET, BY AUTOMATION LEVEL, 2020-2035 (USD BILLION)
      74. TABLE 73 EU ASIA-PACIFIC ROPE: PALLETIZERS MARKET, BY APPLICATION, 2020-2035 (USD BILLION)
      75. TABLE 74 ASIA-PACIFIC: PALLETIZERS MARKET, BY FOOD & BEVERAGES, 2020-2035 (USD BILLION)
      76. TABLE 75 ASIA-PACIFIC: PALLETIZERS MARKET, BY CONSUMER GOODS, 2020-2035 (USD BILLION)
      77. TABLE 76 CHINA: PALLETIZERS MARKET, BY PALLETIZER TYPE, 2020-2035 (USD BILLION)
      78. TABLE 77 CHINA: PALLETIZERS MARKET, BY AUTOMATION LEVEL, 2020-2035 (USD BILLION)
      79. TABLE 78 CHINA: PALLETIZERS MARKET, BY APPLICATION, 2020-2035 (USD BILLION)
      80. TABLE 79 CHINA: PALLETIZERS MARKET, BY FOOD & BEVERAGES, 2020-2035 (USD BILLION)
      81. TABLE 80 CHINA: PALLETIZERS MARKET, BY CONSUMER GOODS, 2020-2035 (USD BILLION)
      82. TABLE 81 INDIA: PALLETIZERS MARKET, BY PALLETIZER TYPE, 2020-2035 (USD BILLION)
      83. TABLE 82 INDIA: PALLETIZERS MARKET, BY AUTOMATION LEVEL, 2020-2035 (USD BILLION)
      84. TABLE 83 INDIA: PALLETIZERS MARKET, BY APPLICATION, 2020-2035 (USD BILLION)
      85. TABLE 84 INDIA: PALLETIZERS MARKET, BY FOOD & BEVERAGES, 2020-2035 (USD BILLION)
      86. TABLE 85 INDIA: PALLETIZERS MARKET, BY CONSUMER GOODS, 2020-2035 (USD BILLION)
      87. TABLE 86 JAPAN: PALLETIZERS MARKET, BY PALLETIZER TYPE, 2020-2035 (USD BILLION)
      88. TABLE 87 JAPAN: PALLETIZERS MARKET, BY AUTOMATION LEVEL, 2020-2035 (USD BILLION)
      89. TABLE 88 JAPAN: PALLETIZERS MARKET, BY APPLICATION, 2020-2035 (USD BILLION)
      90. TABLE 89 JAPAN: PALLETIZERS MARKET, BY FOOD & BEVERAGES, 2020-2035 (USD BILLION)
      91. TABLE 90 JAPAN: PALLETIZERS MARKET, BY CONSUMER GOODS, 2020-2035 (USD BILLION)
      92. TABLE 91 SOUTH KOREA: PALLETIZERS MARKET, BY PALLETIZER TYPE, 2020-2035 (USD BILLION)
      93. TABLE 92 SOUTH KOREA: PALLETIZERS MARKET, BY AUTOMATION LEVEL, 2020-2035 (USD BILLION)
      94. TABLE 93 SOUTH KOREA: PALLETIZERS MARKET, BY APPLICATION, 2020-2035 (USD BILLION)
      95. TABLE 94 SOUTH KOREA: PALLETIZERS MARKET, BY FOOD & BEVERAGES, 2020-2035 (USD BILLION)
      96. TABLE 95 SOUTH KOREA: PALLETIZERS MARKET, BY CONSUMER GOODS, 2020-2035 (USD BILLION)
      97. TABLE 96 MALAYSIA: PALLETIZERS MARKET, BY PALLETIZER TYPE, 2020-2035 (USD BILLION)
      98. TABLE 97 MALAYSIA: PALLETIZERS MARKET, BY AUTOMATION LEVEL, 2020-2035 (USD BILLION)
      99. TABLE 98 MALAYSIA: PALLETIZERS MARKET, BY APPLICATION, 2020-2035 (USD BILLION)
      100. TABLE 99 MALAYSIA: PALLETIZERS MARKET, BY FOOD & BEVERAGES, 2020-2035 (USD BILLION)
      101. TABLE 100 MALAYSIA: PALLETIZERS MARKET, BY CONSUMER GOODS, 2020-2035 (USD BILLION)
      102. TABLE 101 THAILAND: PALLETIZERS MARKET, BY PALLETIZER TYPE, 2020-2035 (USD BILLION)
      103. TABLE 102 THAILAND: PALLETIZERS MARKET, BY AUTOMATION LEVEL, 2020-2035 (USD BILLION)
      104. TABLE 103 THAILAND: PALLETIZERS MARKET, BY APPLICATION, 2020-2035 (USD BILLION)
      105. TABLE 104 THAILAND: PALLETIZERS MARKET, BY FOOD & BEVERAGES, 2020-2035 (USD BILLION)
      106. TABLE 105 THAILAND: PALLETIZERS MARKET, BY CONSUMER GOODS, 2020-2035 (USD BILLION)
      107. TABLE 106 INDONESIA: PALLETIZERS MARKET, BY PALLETIZER TYPE, 2020-2035 (USD BILLION)
      108. TABLE 107 INDONESIA: PALLETIZERS MARKET, BY AUTOMATION LEVEL, 2020-2035 (USD BILLION)
      109. TABLE 108 INDONESIA: PALLETIZERS MARKET, BY APPLICATION, 2020-2035 (USD BILLION)
      110. TABLE 109 INDONESIA: PALLETIZERS MARKET, BY FOOD & BEVERAGES, 2020-2035 (USD BILLION)
      111. TABLE 110 INDONESIA: PALLETIZERS MARKET, BY CONSUMER GOODS, 2020-2035 (USD BILLION)
      112. TABLE 111 AUSTRALIA: PALLETIZERS MARKET, BY PALLETIZER TYPE, 2020-2035 (USD BILLION)
      113. TABLE 112 AUSTRALIA: PALLETIZERS MARKET, BY AUTOMATION LEVEL, 2020-2035 (USD BILLION)
      114. TABLE 113 AUSTRALIA: PALLETIZERS MARKET, BY APPLICATION, 2020-2035 (USD BILLION)
      115. TABLE 114 AUSTRALIA: PALLETIZERS MARKET, BY FOOD & BEVERAGES, 2020-2035 (USD BILLION)
      116. TABLE 115 AUSTRALIA: PALLETIZERS MARKET, BY CONSUMER GOODS, 2020-2035 (USD BILLION)
      117. TABLE 116 REST OF ASIA-PACIFIC: PALLETIZERS MARKET, BY PALLETIZER TYPE, 2020-2035 (USD BILLION)
      118. TABLE 117 REST OF ASIA-PACIFIC: PALLETIZERS MARKET, BY AUTOMATION LEVEL, 2020-2035 (USD BILLION)
      119. TABLE 118 REST OF ASIA-PACIFIC: PALLETIZERS MARKET, BY APPLICATION, 2020-2035 (USD BILLION)
      120. TABLE 119 REST OF ASIA-PACIFIC: PALLETIZERS MARKET, BY FOOD & BEVERAGES, 2020-2035 (USD BILLION)
      121. TABLE 120 REST OF ASIA-PACIFIC: PALLETIZERS MARKET, BY CONSUMER GOODS, 2020-2035 (USD BILLION)
      122. TABLE 121 MIDDLE EAST & AFRICA: PALLETIZERS MARKET, BY COUNTRY, 2020-2035 (USD BILLION)
      123. TABLE 122 MIDDLE EAST & AFRICA: PALLETIZERS MARKET, BY PALLETIZER TYPE, 2020-2035 (USD BILLION)
      124. TABLE 123 MIDDLE EAST & AFRICA: PALLETIZERS MARKET, BY AUTOMATION LEVEL, 2020-2035 (USD BILLION)
      125. TABLE 124 MIDDLE EAST & AFRICA: PALLETIZERS MARKET, BY APPLICATION, 2020-2035 (USD BILLION)
      126. TABLE 125 MIDDLE EAST & AFRICA: PALLETIZERS MARKET, BY FOOD & BEVERAGES, 2020-2035 (USD BILLION)
      127. TABLE 126 MIDDLE EAST & AFRICA: PALLETIZERS MARKET, BY CONSUMER GOODS, 2020-2035 (USD BILLION)
      128. TABLE 127 GCC COUNTRIES: PALLETIZERS MARKET, BY PALLETIZER TYPE, 2020-2035 (USD BILLION)
      129. TABLE 128 GCC COUNTRIES: PALLETIZERS MARKET, BY AUTOMATION LEVEL, 2020-2035 (USD BILLION)
      130. TABLE 129 GCC COUNTRIES: PALLETIZERS MARKET, BY APPLICATION, 2020-2035 (USD BILLION)
      131. TABLE 130 GCC COUNTRIES: PALLETIZERS MARKET, BY FOOD & BEVERAGES, 2020-2035 (USD BILLION)
      132. TABLE 131 GCC COUNTRIES: PALLETIZERS MARKET, BY CONSUMER GOODS, 2020-2035 (USD BILLION)
      133. TABLE 132 SOUTH AFRICA: PALLETIZERS MARKET, BY PALLETIZER TYPE, 2020-2035 (USD BILLION)
      134. TABLE 133 SOUTH AFRICA: PALLETIZERS MARKET, BY AUTOMATION LEVEL, 2020-2035 (USD BILLION)
      135. TABLE 134 SOUTH AFRICA: PALLETIZERS MARKET, BY APPLICATION, 2020-2035 (USD BILLION)
      136. TABLE 135 SOUTH AFRICA: PALLETIZERS MARKET, BY FOOD & BEVERAGES, 2020-2035 (USD BILLION)
      137. TABLE 136 SOUTH AFRICA: PALLETIZERS MARKET, BY CONSUMER GOODS, 2020-2035 (USD BILLION)
      138. TABLE 137 REST OF MEA: PALLETIZERS MARKET, BY PALLETIZER TYPE, 2020-2035 (USD BILLION)
      139. TABLE 138 REST OF MEA: PALLETIZERS MARKET, BY AUTOMATION LEVEL, 2020-2035 (USD BILLION)
      140. TABLE 139 REST OF MEA: PALLETIZERS MARKET, BY APPLICATION, 2020-2035 (USD BILLION)
      141. TABLE 140 REST OF MEA: PALLETIZERS MARKET, BY FOOD & BEVERAGES, 2020-2035 (USD BILLION)
      142. TABLE 141 REST OF MEA: PALLETIZERS MARKET, BY CONSUMER GOODS, 2020-2035 (USD BILLION)
      143. TABLE 142 SOUTH AMERICA: PALLETIZERS MARKET, BY COUNTRY, 2020-2035 (USD BILLION)
      144. TABLE 143 SOUTH AMERICA: PALLETIZERS MARKET, BY PALLETIZER TYPE, 2020-2035 (USD BILLION)
      145. TABLE 144 SOUTH AMERICA: PALLETIZERS MARKET, BY AUTOMATION LEVEL, 2020-2035 (USD BILLION)
      146. TABLE 145 SOUTH AMERICA: PALLETIZERS MARKET, BY APPLICATION, 2020-2035 (USD BILLION)
      147. TABLE 146 SOUTH AMERICA: PALLETIZERS MARKET, BY FOOD & BEVERAGES, 2020-2035 (USD BILLION)
      148. TABLE 147 SOUTH AMERICA: PALLETIZERS MARKET, BY CONSUMER GOODS, 2020-2035 (USD BILLION)
      149. TABLE 148 BRAZIL: PALLETIZERS MARKET, BY PALLETIZER TYPE, 2020-2035 (USD BILLION)
      150. TABLE 149 BRAZIL: PALLETIZERS MARKET, BY AUTOMATION LEVEL, 2020-2035 (USD BILLION)
      151. TABLE 150 BRAZIL: PALLETIZERS MARKET, BY APPLICATION, 2020-2035 (USD BILLION)
      152. TABLE 151 BRAZIL: PALLETIZERS MARKET, BY FOOD & BEVERAGES, 2020-2035 (USD BILLION)
      153. TABLE 152 BRAZIL: PALLETIZERS MARKET, BY CONSUMER GOODS, 2020-2035 (USD BILLION)
      154. TABLE 153 ARGENTINA: PALLETIZERS MARKET, BY PALLETIZER TYPE, 2020-2035 (USD BILLION)
      155. TABLE 154 ARGENTINA: PALLETIZERS MARKET, BY AUTOMATION LEVEL, 2020-2035 (USD BILLION)
      156. TABLE 155 ARGENTINA: PALLETIZERS MARKET, BY APPLICATION, 2020-2035 (USD BILLION)
      157. TABLE 156 ARGENTINA: PALLETIZERS MARKET, BY FOOD & BEVERAGES, 2020-2035 (USD BILLION)
      158. TABLE 157 ARGENTINA: PALLETIZERS MARKET, BY CONSUMER GOODS, 2020-2035 (USD BILLION)
      159. TABLE 158 PERU: PALLETIZERS MARKET, BY PALLETIZER TYPE, 2020-2035 (USD BILLION)
      160. TABLE 159 PERU: PALLETIZERS MARKET, BY AUTOMATION LEVEL, 2020-2035 (USD BILLION)
      161. TABLE 160 PERU: PALLETIZERS MARKET, BY APPLICATION, 2020-2035 (USD BILLION)
      162. TABLE 161 PERU: PALLETIZERS MARKET, BY FOOD & BEVERAGES, 2020-2035 (USD BILLION)
      163. TABLE 162 PERU: PALLETIZERS MARKET, BY CONSUMER GOODS, 2020-2035 (USD BILLION)
      164. TABLE 163 CHILE: PALLETIZERS MARKET, BY PALLETIZER TYPE, 2020-2035 (USD BILLION)
      165. TABLE 164 CHILE: PALLETIZERS MARKET, BY AUTOMATION LEVEL, 2020-2035 (USD BILLION)
      166. TABLE 165 CHILE: PALLETIZERS MARKET, BY APPLICATION, 2020-2035 (USD BILLION)
      167. TABLE 166 CHILE: PALLETIZERS MARKET, BY FOOD & BEVERAGES, 2020-2035 (USD BILLION)
      168. TABLE 167 CHILE: PALLETIZERS MARKET, BY CONSUMER GOODS, 2020-2035 (USD BILLION)
      169. TABLE 168 REST OF SOUTH AMERICA: PALLETIZERS MARKET, BY PALLETIZER TYPE, 2020-2035 (USD BILLION)
      170. TABLE 169 REST OF SOUTH AMERICA: PALLETIZERS MARKET, BY AUTOMATION LEVEL, 2020-2035 (USD BILLION)
      171. TABLE 170 REST OF SOUTH AMERICA: PALLETIZERS MARKET, BY APPLICATION, 2020-2035 (USD BILLION)
      172. TABLE 171 REST OF SOUTH AMERICA: PALLETIZERS MARKET, BY FOOD & BEVERAGES, 2020-2035 (USD BILLION)
      173. TABLE 172 REST OF SOUTH AMERICA: PALLETIZERS MARKET, BY CONSUMER GOODS, 2020-2035 (USD BILLION)
      174. TABLE 173 MOST ACTIVE PLAYER IN THE GLOBAL PALLETIZER MARKET
      175. TABLE 174 PRODUCT LAUNCH
      176. TABLE 175 CONTRACTS, JOINT VENTURE, COLLABORATION & PARNERSHIP
      177. TABLE 176 EXPANSION & INVESTMENT
      178. TABLE 177 ONEXIA INC.: PRODUCTS OFFERED
      179. TABLE 178 ONEXIA INC.: KEY DEVELOPMENTS
      180. TABLE 179 COLUMBIA/OKURA, LLC: PRODUCTS OFFERED
      181. TABLE 180 COLUMBIA/OKURA, LLC: KEY DEVELOPMENTS
      182. TABLE 181 VENTION: PRODUCTS OFFERED
      183. TABLE 182 ROBOTIQ: PRODUCTS OFFERED
      184. TABLE 183 ROBOTIQ: KEY DEVELOPMENTS
      185. TABLE 184 PREMIERE TECH: PRODUCTS OFFERED
      186. TABLE 185 PREMIERE TECH: KEY DEVELOPMENTS
      187. TABLE 186 PROMACH INC.: PRODUCTS OFFERED
      188. TABLE 187 PROMACH INC.: KEY DEVELOPMENTS
      189. TABLE 188 FLEXLINK: PRODUCTS OFFERED
      190. TABLE 189 FORTNA INC.: PRODUCTS OFFERED
      191. TABLE 190 PACTEON GROUP: PRODUCTS OFFERED
      192. TABLE 191 PACTEON GROUP: KEY DEVELOPMENTS
      193. TABLE 192 SIDEL: PRODUCTS OFFERED
      194. TABLE 193 SIDEL: KEY DEVELOPMENTS LIST OF FIGURES
      195. FIGURE 1 GLOBAL PALLETIZERS MARKET: STRUCTURE
      196. FIGURE 2 GLOBAL PALLETIZER MARKET: GROWTH FACTOR ANALYSIS (2025-2032)
      197. FIGURE 3 DRIVER IMPACT ANALYSIS: GLOBAL PALLETIZERS MARKET
      198. FIGURE 4 RESTRAINT IMPACT ANALYSIS: GLOBAL PALLETIZERS MARKET
      199. FIGURE 5 SUPPLY CHAIN ANALYSIS: GLOBAL PALLETIZERS MARKET
      200. FIGURE 6 PORTER’S FIVE FORCES ANALYSIS: GLOBAL PALLETIZERS MARKET
      201. FIGURE 7 GLOBAL PALLETIZERS MARKET, BY PALLETIZER TYPE, 2024 (% SHARE)
      202. FIGURE 8 GLOBAL PALLETIZERS MARKET, BY AUTOMATION LEVEL, 2024 (% SHARE)
      203. FIGURE 9 GLOBAL PALLETIZERS MARKET, BY APPLICATION, 2024 (% SHARE)
      204. FIGURE 10 GLOBAL PALLETIZERS MARKET, BY REGION, 2024 (% SHARE)
      205. FIGURE 11 COMPETITOR DASHBOARD: GLOBAL PALLETIZER MARKET
      206. FIGURE 12 ONEXIA INC.: SWOT ANALYSIS
      207. FIGURE 13 COLUMBIA/OKURA, LLC: SWOT ANALYSIS
      208. FIGURE 14 VENTION: SWOT ANALYSIS
      209. FIGURE 15 ROBOTIQ: SWOT ANALYSIS
      210. FIGURE 16 PREMIERE TECH: SWOT ANALYSIS
      211. FIGURE 17 PROMACH INC.: SWOT ANALYSIS
      212. FIGURE 18 FLEXLINK: SWOT ANALYSIS
      213. FIGURE 19 FORTNA INC.: SWOT ANALYSIS
      214. FIGURE 20 PACTEON GROUP: SWOT ANALYSIS
      215. FIGURE 21 SIDEL: SWOT ANALYSIS  

    Global Outlook (USD Billion,2019-2035)

    Global Palletizersy, By Palletizer Type (USD Billion,2019-2035)

    • Conventional
    • Robotic
    • Cobot Palletizer

    Global Palletizersy, By Automation Level (USD Billion,2019-2035)

    • Fully Automated
    • Semi-automated
    • Manual

    Global Palletizersy, By Application (USD Billion,2019-2035)

    • Food & Beverages
      • Bottling & Canning
      • Packaged Food
      • Bakery & Confectionery
      • Others
    • Pharmaceuticals
    • Consumer Goods
      • Electronics Appliances
      • Household Products
      • Others
    • Industrial Goods
    • Others

    North America Outlook (USD Billion,2019-2035)

    North America Palletizersy, By Palletizer Type (USD Billion,2019-2035)

    • Conventional
    • Robotic
    • Cobot Palletizer

    North America Palletizersy, By Automation Level (USD Billion,2019-2035)

    • Fully Automated
    • Semi-automated
    • Manual

    North America Palletizersy, By Application (USD Billion,2019-2035)

    • Food & Beverages
      • Bottling & Canning
      • Packaged Food
      • Bakery & Confectionery
      • Others
    • Pharmaceuticals
    • Consumer Goods
      • Electronics Appliances
      • Household Products
      • Others
    • Industrial Goods
    • Others

    US Outlook (USD Billion,2019-2035)

    US Palletizersy, By Palletizer Type (USD Billion,2019-2035)

    • Conventional
    • Robotic
    • Cobot Palletizer

    US Palletizersy, By Automation Level (USD Billion,2019-2035)

    • Fully Automated
    • Semi-automated
    • Manual

    US Palletizersy, By Application (USD Billion,2019-2035)

    • Food & Beverages
      • Bottling & Canning
      • Packaged Food
      • Bakery & Confectionery
      • Others
    • Pharmaceuticals
    • Consumer Goods
      • Electronics Appliances
      • Household Products
      • Others
    • Industrial Goods
    • Others

    Canada Outlook (USD Billion,2019-2035)

    Canada Palletizersy, By Palletizer Type (USD Billion,2019-2035)

    • Conventional
    • Robotic
    • Cobot Palletizer

    Canada Palletizersy, By Automation Level (USD Billion,2019-2035)

    • Fully Automated
    • Semi-automated
    • Manual

    Canada Palletizersy, By Application (USD Billion,2019-2035)

    • Food & Beverages
      • Bottling & Canning
      • Packaged Food
      • Bakery & Confectionery
      • Others
    • Pharmaceuticals
    • Consumer Goods
      • Electronics Appliances
      • Household Products
      • Others
    • Industrial Goods
    • Others

    Mexico Outlook (USD Billion,2019-2035)

    Mexico Palletizersy, By Palletizer Type (USD Billion,2019-2035)

    • Conventional
    • Robotic
    • Cobot Palletizer

    Mexico Palletizersy, By Automation Level (USD Billion,2019-2035)

    • Fully Automated
    • Semi-automated
    • Manual

    Mexico Palletizersy, By Application (USD Billion,2019-2035)

    • Food & Beverages
      • Bottling & Canning
      • Packaged Food
      • Bakery & Confectionery
      • Others
    • Pharmaceuticals
    • Consumer Goods
      • Electronics Appliances
      • Household Products
      • Others
    • Industrial Goods
    • Others

    Europe Outlook (USD Billion,2019-2035)

    Europe Palletizersy, By Palletizer Type (USD Billion,2019-2035)

    • Conventional
    • Robotic
    • Cobot Palletizer

    Europe Palletizersy, By Automation Level (USD Billion,2019-2035)

    • Fully Automated
    • Semi-automated
    • Manual

    Europe Palletizersy, By Application (USD Billion,2019-2035)

    • Food & Beverages
      • Bottling & Canning
      • Packaged Food
      • Bakery & Confectionery
      • Others
    • Pharmaceuticals
    • Consumer Goods
      • Electronics Appliances
      • Household Products
      • Others
    • Industrial Goods
    • Others

    Germany Outlook (USD Billion,2019-2035)

    Germany Palletizersy, By Palletizer Type (USD Billion,2019-2035)

    • Conventional
    • Robotic
    • Cobot Palletizer

    Germany Palletizersy, By Automation Level (USD Billion,2019-2035)

    • Fully Automated
    • Semi-automated
    • Manual

    Germany Palletizersy, By Application (USD Billion,2019-2035)

    • Food & Beverages
      • Bottling & Canning
      • Packaged Food
      • Bakery & Confectionery
      • Others
    • Pharmaceuticals
    • Consumer Goods
      • Electronics Appliances
      • Household Products
      • Others
    • Industrial Goods
    • Others

    UK Outlook (USD Billion,2019-2035)

    UK Palletizersy, By Palletizer Type (USD Billion,2019-2035)

    • Conventional
    • Robotic
    • Cobot Palletizer

    UK Palletizersy, By Automation Level (USD Billion,2019-2035)

    • Fully Automated
    • Semi-automated
    • Manual

    UK Palletizersy, By Application (USD Billion,2019-2035)

    • Food & Beverages
      • Bottling & Canning
      • Packaged Food
      • Bakery & Confectionery
      • Others
    • Pharmaceuticals
    • Consumer Goods
      • Electronics Appliances
      • Household Products
      • Others
    • Industrial Goods
    • Others

    France Outlook (USD Billion,2019-2035)

    France Palletizersy, By Palletizer Type (USD Billion,2019-2035)

    • Conventional
    • Robotic
    • Cobot Palletizer

    France Palletizersy, By Automation Level (USD Billion,2019-2035)

    • Fully Automated
    • Semi-automated
    • Manual

    France Palletizersy, By Application (USD Billion,2019-2035)

    • Food & Beverages
      • Bottling & Canning
      • Packaged Food
      • Bakery & Confectionery
      • Others
    • Pharmaceuticals
    • Consumer Goods
      • Electronics Appliances
      • Household Products
      • Others
    • Industrial Goods
    • Others

    Russia Outlook (USD Billion,2019-2035)

    Russia Palletizersy, By Palletizer Type (USD Billion,2019-2035)

    • Conventional
    • Robotic
    • Cobot Palletizer

    Russia Palletizersy, By Automation Level (USD Billion,2019-2035)

    • Fully Automated
    • Semi-automated
    • Manual

    Russia Palletizersy, By Application (USD Billion,2019-2035)

    • Food & Beverages
      • Bottling & Canning
      • Packaged Food
      • Bakery & Confectionery
      • Others
    • Pharmaceuticals
    • Consumer Goods
      • Electronics Appliances
      • Household Products
      • Others
    • Industrial Goods
    • Others

    Italy Outlook (USD Billion,2019-2035)

    Italy Palletizersy, By Palletizer Type (USD Billion,2019-2035)

    • Conventional
    • Robotic
    • Cobot Palletizer

    Italy Palletizersy, By Automation Level (USD Billion,2019-2035)

    • Fully Automated
    • Semi-automated
    • Manual

    Italy Palletizersy, By Application (USD Billion,2019-2035)

    • Food & Beverages
      • Bottling & Canning
      • Packaged Food
      • Bakery & Confectionery
      • Others
    • Pharmaceuticals
    • Consumer Goods
      • Electronics Appliances
      • Household Products
      • Others
    • Industrial Goods
    • Others

    Spain Outlook (USD Billion,2019-2035)

    Spain Palletizersy, By Palletizer Type (USD Billion,2019-2035)

    • Conventional
    • Robotic
    • Cobot Palletizer

    Spain Palletizersy, By Automation Level (USD Billion,2019-2035)

    • Fully Automated
    • Semi-automated
    • Manual

    Spain Palletizersy, By Application (USD Billion,2019-2035)

    • Food & Beverages
      • Bottling & Canning
      • Packaged Food
      • Bakery & Confectionery
      • Others
    • Pharmaceuticals
    • Consumer Goods
      • Electronics Appliances
      • Household Products
      • Others
    • Industrial Goods
    • Others

    Rest of Europe Outlook (USD Billion,2019-2035)

    Rest of Europe Palletizersy, By Palletizer Type (USD Billion,2019-2035)

    • Conventional
    • Robotic
    • Cobot Palletizer

    Rest of Europe Palletizersy, By Automation Level (USD Billion,2019-2035)

    • Fully Automated
    • Semi-automated
    • Manual

    Rest of Europe Palletizersy, By Application (USD Billion,2019-2035)

    • Food & Beverages
      • Bottling & Canning
      • Packaged Food
      • Bakery & Confectionery
      • Others
    • Pharmaceuticals
    • Consumer Goods
      • Electronics Appliances
      • Household Products
      • Others
    • Industrial Goods
    • Others

    Asia-Pacific Outlook (USD Billion,2019-2035)

    Asia-Pacific Palletizersy, By Palletizer Type (USD Billion,2019-2035)

    • Conventional
    • Robotic
    • Cobot Palletizer

    Asia-Pacific Palletizersy, By Automation Level (USD Billion,2019-2035)

    • Fully Automated
    • Semi-automated
    • Manual

    Asia-Pacific Palletizersy, By Application (USD Billion,2019-2035)

    • Food & Beverages
      • Bottling & Canning
      • Packaged Food
      • Bakery & Confectionery
      • Others
    • Pharmaceuticals
    • Consumer Goods
      • Electronics Appliances
      • Household Products
      • Others
    • Industrial Goods
    • Others

    China Outlook (USD Billion,2019-2035)

    China Palletizersy, By Palletizer Type (USD Billion,2019-2035)

    • Conventional
    • Robotic
    • Cobot Palletizer

    China Palletizersy, By Automation Level (USD Billion,2019-2035)

    • Fully Automated
    • Semi-automated
    • Manual

    China Palletizersy, By Application (USD Billion,2019-2035)

    • Food & Beverages
      • Bottling & Canning
      • Packaged Food
      • Bakery & Confectionery
      • Others
    • Pharmaceuticals
    • Consumer Goods
      • Electronics Appliances
      • Household Products
      • Others
    • Industrial Goods
    • Others

    India Outlook (USD Billion,2019-2035)

    India Palletizersy, By Palletizer Type (USD Billion,2019-2035)

    • Conventional
    • Robotic
    • Cobot Palletizer

    India Palletizersy, By Automation Level (USD Billion,2019-2035)

    • Fully Automated
    • Semi-automated
    • Manual

    India Palletizersy, By Application (USD Billion,2019-2035)

    • Food & Beverages
      • Bottling & Canning
      • Packaged Food
      • Bakery & Confectionery
      • Others
    • Pharmaceuticals
    • Consumer Goods
      • Electronics Appliances
      • Household Products
      • Others
    • Industrial Goods
    • Others

    Japan Outlook (USD Billion,2019-2035)

    Japan Palletizersy, By Palletizer Type (USD Billion,2019-2035)

    • Conventional
    • Robotic
    • Cobot Palletizer

    Japan Palletizersy, By Automation Level (USD Billion,2019-2035)

    • Fully Automated
    • Semi-automated
    • Manual

    Japan Palletizersy, By Application (USD Billion,2019-2035)

    • Food & Beverages
      • Bottling & Canning
      • Packaged Food
      • Bakery & Confectionery
      • Others
    • Pharmaceuticals
    • Consumer Goods
      • Electronics Appliances
      • Household Products
      • Others
    • Industrial Goods
    • Others

    South Korea Outlook (USD Billion,2019-2035)

    South Korea Palletizersy, By Palletizer Type (USD Billion,2019-2035)

    • Conventional
    • Robotic
    • Cobot Palletizer

    South Korea Palletizersy, By Automation Level (USD Billion,2019-2035)

    • Fully Automated
    • Semi-automated
    • Manual

    South Korea Palletizersy, By Application (USD Billion,2019-2035)

    • Food & Beverages
      • Bottling & Canning
      • Packaged Food
      • Bakery & Confectionery
      • Others
    • Pharmaceuticals
    • Consumer Goods
      • Electronics Appliances
      • Household Products
      • Others
    • Industrial Goods
    • Others

    Malaysia Outlook (USD Billion,2019-2035)

    Malaysia Palletizersy, By Palletizer Type (USD Billion,2019-2035)

    • Conventional
    • Robotic
    • Cobot Palletizer

    Malaysia Palletizersy, By Automation Level (USD Billion,2019-2035)

    • Fully Automated
    • Semi-automated
    • Manual

    Malaysia Palletizersy, By Application (USD Billion,2019-2035)

    • Food & Beverages
      • Bottling & Canning
      • Packaged Food
      • Bakery & Confectionery
      • Others
    • Pharmaceuticals
    • Consumer Goods
      • Electronics Appliances
      • Household Products
      • Others
    • Industrial Goods
    • Others

    Thailand Outlook (USD Billion,2019-2035)

    Thailand Palletizersy, By Palletizer Type (USD Billion,2019-2035)

    • Conventional
    • Robotic
    • Cobot Palletizer

    Thailand Palletizersy, By Automation Level (USD Billion,2019-2035)

    • Fully Automated
    • Semi-automated
    • Manual

    Thailand Palletizersy, By Application (USD Billion,2019-2035)

    • Food & Beverages
      • Bottling & Canning
      • Packaged Food
      • Bakery & Confectionery
      • Others
    • Pharmaceuticals
    • Consumer Goods
      • Electronics Appliances
      • Household Products
      • Others
    • Industrial Goods
    • Others

    Indonesia Outlook (USD Billion,2019-2035)

    Indonesia Palletizersy, By Palletizer Type (USD Billion,2019-2035)

    • Conventional
    • Robotic
    • Cobot Palletizer

    Indonesia Palletizersy, By Automation Level (USD Billion,2019-2035)

    • Fully Automated
    • Semi-automated
    • Manual

    Indonesia Palletizersy, By Application (USD Billion,2019-2035)

    • Food & Beverages
      • Bottling & Canning
      • Packaged Food
      • Bakery & Confectionery
      • Others
    • Pharmaceuticals
    • Consumer Goods
      • Electronics Appliances
      • Household Products
      • Others
    • Industrial Goods
    • Others

    Australia Outlook (USD Billion,2019-2035)

    Australia Palletizersy, By Palletizer Type (USD Billion,2019-2035)

    • Conventional
    • Robotic
    • Cobot Palletizer

    Australia Palletizersy, By Automation Level (USD Billion,2019-2035)

    • Fully Automated
    • Semi-automated
    • Manual

    Australia Palletizersy, By Application (USD Billion,2019-2035)

    • Food & Beverages
      • Bottling & Canning
      • Packaged Food
      • Bakery & Confectionery
      • Others
    • Pharmaceuticals
    • Consumer Goods
      • Electronics Appliances
      • Household Products
      • Others
    • Industrial Goods
    • Others

    Rest of Asia-Pacific Outlook (USD Billion,2019-2035)

    Rest of Asia-Pacific Palletizersy, By Palletizer Type (USD Billion,2019-2035)

    • Conventional
    • Robotic
    • Cobot Palletizer

    Rest of Asia-Pacific Palletizersy, By Automation Level (USD Billion,2019-2035)

    • Fully Automated
    • Semi-automated
    • Manual

    Rest of Asia-Pacific Palletizersy, By Application (USD Billion,2019-2035)

    • Food & Beverages
      • Bottling & Canning
      • Packaged Food
      • Bakery & Confectionery
      • Others
    • Pharmaceuticals
    • Consumer Goods
      • Electronics Appliances
      • Household Products
      • Others
    • Industrial Goods
    • Others

    Middle East & Africa Outlook (USD Billion,2019-2035)

    Middle East & Africa Palletizersy, By Palletizer Type (USD Billion,2019-2035)

    • Conventional
    • Robotic
    • Cobot Palletizer

    Middle East & Africa Palletizersy, By Automation Level (USD Billion,2019-2035)

    • Fully Automated
    • Semi-automated
    • Manual

    Middle East & Africa Palletizersy, By Application (USD Billion,2019-2035)

    • Food & Beverages
      • Bottling & Canning
      • Packaged Food
      • Bakery & Confectionery
      • Others
    • Pharmaceuticals
    • Consumer Goods
      • Electronics Appliances
      • Household Products
      • Others
    • Industrial Goods
    • Others

    GCC Countries Outlook (USD Billion,2019-2035)

    GCC Countries Palletizersy, By Palletizer Type (USD Billion,2019-2035)

    • Conventional
    • Robotic
    • Cobot Palletizer

    GCC Countries Palletizersy, By Automation Level (USD Billion,2019-2035)

    • Fully Automated
    • Semi-automated
    • Manual

    GCC Countries Palletizersy, By Application (USD Billion,2019-2035)

    • Food & Beverages
      • Bottling & Canning
      • Packaged Food
      • Bakery & Confectionery
      • Others
    • Pharmaceuticals
    • Consumer Goods
      • Electronics Appliances
      • Household Products
      • Others
    • Industrial Goods
    • Others

    South Africa Outlook (USD Billion,2019-2035)

    South Africa Palletizersy, By Palletizer Type (USD Billion,2019-2035)

    • Conventional
    • Robotic
    • Cobot Palletizer

    South Africa Palletizersy, By Automation Level (USD Billion,2019-2035)

    • Fully Automated
    • Semi-automated
    • Manual

    South Africa Palletizersy, By Application (USD Billion,2019-2035)

    • Food & Beverages
      • Bottling & Canning
      • Packaged Food
      • Bakery & Confectionery
      • Others
    • Pharmaceuticals
    • Consumer Goods
      • Electronics Appliances
      • Household Products
      • Others
    • Industrial Goods
    • Others

    Rest of Middle East & Africa Outlook (USD Billion,2019-2035)

    Rest of Middle East & Africa Palletizersy, By Palletizer Type (USD Billion,2019-2035)

    • Conventional
    • Robotic
    • Cobot Palletizer

    Rest of Middle East & Africa Palletizersy, By Automation Level (USD Billion,2019-2035)

    • Fully Automated
    • Semi-automated
    • Manual

    Rest of Middle East & Africa Palletizersy, By Application (USD Billion,2019-2035)

    • Food & Beverages
      • Bottling & Canning
      • Packaged Food
      • Bakery & Confectionery
      • Others
    • Pharmaceuticals
    • Consumer Goods
      • Electronics Appliances
      • Household Products
      • Others
    • Industrial Goods
    • Others

    South America Outlook (USD Billion,2019-2035)

    South America Palletizersy, By Palletizer Type (USD Billion,2019-2035)

    • Conventional
    • Robotic
    • Cobot Palletizer

    South America Palletizersy, By Automation Level (USD Billion,2019-2035)

    • Fully Automated
    • Semi-automated
    • Manual

    South America Palletizersy, By Application (USD Billion,2019-2035)

    • Food & Beverages
      • Bottling & Canning
      • Packaged Food
      • Bakery & Confectionery
      • Others
    • Pharmaceuticals
    • Consumer Goods
      • Electronics Appliances
      • Household Products
      • Others
    • Industrial Goods
    • Others

    Brazil Outlook (USD Billion,2019-2035)

    Brazil Palletizersy, By Palletizer Type (USD Billion,2019-2035)

    • Conventional
    • Robotic
    • Cobot Palletizer

    Brazil Palletizersy, By Automation Level (USD Billion,2019-2035)

    • Fully Automated
    • Semi-automated
    • Manual

    Brazil Palletizersy, By Application (USD Billion,2019-2035)

    • Food & Beverages
      • Bottling & Canning
      • Packaged Food
      • Bakery & Confectionery
      • Others
    • Pharmaceuticals
    • Consumer Goods
      • Electronics Appliances
      • Household Products
      • Others
    • Industrial Goods
    • Others

    Argentina Outlook (USD Billion,2019-2035)

    Argentina Palletizersy, By Palletizer Type (USD Billion,2019-2035)

    • Conventional
    • Robotic
    • Cobot Palletizer

    Argentina Palletizersy, By Automation Level (USD Billion,2019-2035)

    • Fully Automated
    • Semi-automated
    • Manual

    Argentina Palletizersy, By Application (USD Billion,2019-2035)

    • Food & Beverages
      • Bottling & Canning
      • Packaged Food
      • Bakery & Confectionery
      • Others
    • Pharmaceuticals
    • Consumer Goods
      • Electronics Appliances
      • Household Products
      • Others
    • Industrial Goods
    • Others

    Peru Outlook (USD Billion,2019-2035)

    Peru Palletizersy, By Palletizer Type (USD Billion,2019-2035)

    • Conventional
    • Robotic
    • Cobot Palletizer

    Peru Palletizersy, By Automation Level (USD Billion,2019-2035)

    • Fully Automated
    • Semi-automated
    • Manual

    Peru Palletizersy, By Application (USD Billion,2019-2035)

    • Food & Beverages
      • Bottling & Canning
      • Packaged Food
      • Bakery & Confectionery
      • Others
    • Pharmaceuticals
    • Consumer Goods
      • Electronics Appliances
      • Household Products
      • Others
    • Industrial Goods
    • Others

    Chile Outlook (USD Billion,2019-2035)

    Chile Palletizersy, By Palletizer Type (USD Billion,2019-2035)

    • Conventional
    • Robotic
    • Cobot Palletizer

    Chile Palletizersy, By Automation Level (USD Billion,2019-2035)

    • Fully Automated
    • Semi-automated
    • Manual

    Chile Palletizersy, By Application (USD Billion,2019-2035)

    • Food & Beverages
      • Bottling & Canning
      • Packaged Food
      • Bakery & Confectionery
      • Others
    • Pharmaceuticals
    • Consumer Goods
      • Electronics Appliances
      • Household Products
      • Others
    • Industrial Goods
    • Others

    Rest of South America Outlook (USD Billion,2019-2035)

    Rest of South America Palletizersy, By Palletizer Type (USD Billion,2019-2035)

    • Conventional
    • Robotic
    • Cobot Palletizer

    Rest of South America Palletizersy, By Automation Level (USD Billion,2019-2035)

    • Fully Automated
    • Semi-automated
    • Manual

    Rest of South America Palletizersy, By Application (USD Billion,2019-2035)

    • Food & Beverages
      • Bottling & Canning
      • Packaged Food
      • Bakery & Confectionery
      • Others
    • Pharmaceuticals
    • Consumer Goods
      • Electronics Appliances
      • Household Products
      • Others
    • Industrial Goods
    • Others
    Infographic

    Free Sample Request

    Kindly complete the form below to receive a free sample of this Report

    Get Free Sample

    Customer Strories

    “I am very pleased with how market segments have been defined in a relevant way for my purposes (such as "Portable Freezers & refrigerators" and "last-mile"). In general the report is well structured. Thanks very much for your efforts.”

    Victoria Milne

    Founder
    Case Study
    Chemicals and Materials