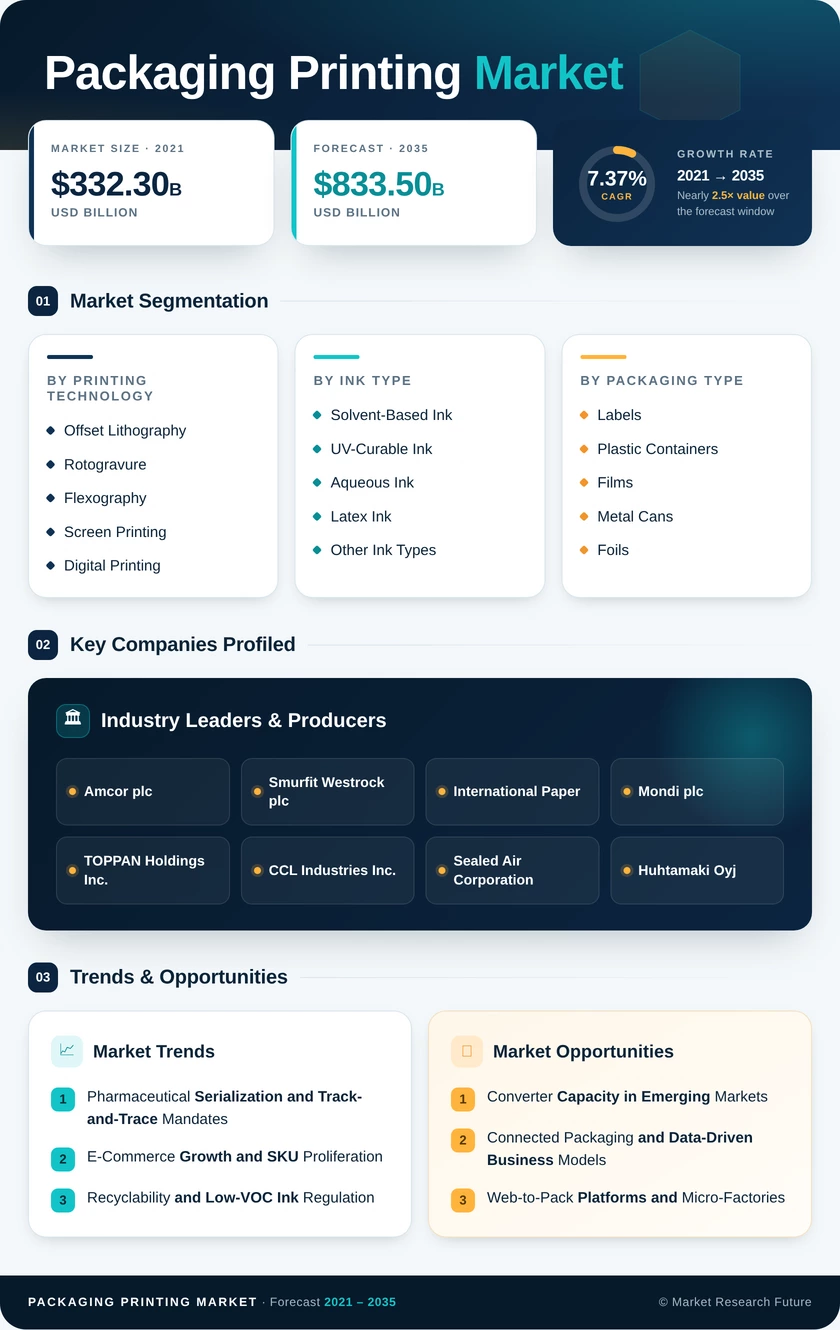
Packaging Printing Market (2026 - 2035)

ID: MRFR/PCM/1583-HCR 188 Pages Pradeep Nandi Last Updated: November 21, 2026
Packaging Printing Market Research Report Information By Printing Technology (Flexography, Offset Lithography, Rotogravure, Screen Printing, Digital Printing, and Other Printing Technologies), By Ink Type (Solvent-Based Ink, Aqueous Ink, UV-Curable Ink, Latex Ink, and Other Ink Types), By Packaging Type (Labels, Plastic Containers and Films, Metal Cans and Foils, Corrugated Boxes, Folding Cartons, Flexible Pouches, and Other Packaging Types), By End-Use Industry (Food and Beverage, Pharmaceutical and Healthcare, Cosmetics and Personal Care, Household Chemicals, Electronics, and Other End-Use Industries), And By Region (North America, Europe, Asia-Pacific, and Rest of the World) – Market Forecast Till 2035.
Packaging Printing Market
Market Size
Forecast Period2026-2035
CAGR (2026-2035)7.37%
2025 Market SizeUSD 409.3 Billion
2035 Market SizeUSD 833.5 Billion
Key Players
Amcor plc
Smurfit Westrock plc
International Paper
Mondi plc
TOPPAN Holdings Inc.
CCL Industries Inc.
Opportunities
  • Converter Capacity in Emerging Markets
  • Connected Packaging and Data-Driven Business Models
  • Web-to-Pack Platforms and Micro-Factories
  1. 1 Market Summary | |
  2. 2 Key Report Takeaways | |
    1. 2.1 By Printing Technology | |
    2. 2.2 By Ink Type | |
    3. 2.3 By Packaging Type | |
    4. 2.4 By End-Use Industry | |
    5. 2.5 By Region | |
  3. 3 Market Size and Forecast (2021–2035) | |
  4. 4 Driver Impact Analysis | |
    1. 4.1 Pharmaceutical Serialization and Track-and-Trace Mandates | |
    2. 4.2 E-Commerce Growth and SKU Proliferation | |
    3. 4.3 Recyclability and Low-VOC Ink Regulation | |
    4. 4.4 Rigid-to-Flexible Packaging Conversion | |
    5. 4.5 Digital and Hybrid Press Adoption | |
    6. 4.6 Retail Transition to 2D Barcodes | |
  5. 5 Restraints Impact Analysis | |
    1. 5.1 Raw Material and Energy Cost Volatility | |
    2. 5.2 High Capital Cost of Digital and Hybrid Presses | |
    3. 5.3 Emission Control Compliance Costs | |
    4. 5.4 Ink and Substrate Recycling Incompatibility | |
    5. 5.5 Single-Use Plastic Restrictions | |
  6. 6 Opportunities | |
    1. 6.1 Converter Capacity in Emerging Markets | |
    2. 6.2 Connected Packaging and Data-Driven Business Models | |
    3. 6.3 Web-to-Pack Platforms and Micro-Factories | |
    4. 6.4 Recyclable Mono-Material Structures with Compatible Inks | |
    5. 6.5 Pharmaceutical Security Printing | |
  7. 7 Regional Market Share and Country-Level Analysis | |
    1. 7.1 North America | | |
      1. 7.1.1 US | | |
      2. 7.1.2 Canada | | |
      3. 7.1.3 Mexico | |
    2. 7.2 Europe | | |
      1. 7.2.1 Germany | | |
      2. 7.2.2 UK | | |
      3. 7.2.3 France | | |
      4. 7.2.4 Italy | | |
      5. 7.2.5 Spain | | |
      6. 7.2.6 Nordic Countries | | |
      7. 7.2.7 Russia | | |
      8. 7.2.8 Rest of Europe | |
    3. 7.3 Asia Pacific | | |
      1. 7.3.1 China | | |
      2. 7.3.2 India | | |
      3. 7.3.3 Japan | | |
      4. 7.3.4 South Korea | | |
      5. 7.3.5 ASEAN | | |
      6. 7.3.6 Rest of Asia-Pacific | |
    4. 7.4 South America | | |
      1. 7.4.1 Brazil | | |
      2. 7.4.2 Argentina | | |
      3. 7.4.3 Rest of South America | |
    5. 7.5 Middle East and Africa | | |
      1. 7.5.1 Saudi Arabia | | |
      2. 7.5.2 UAE | | |
      3. 7.5.3 South Africa | | |
      4. 7.5.4 Egypt | | |
      5. 7.5.5 Rest of MEA | |
  8. 8 Future Outlook (2026–2035) | |
    1. 8.1 AI-Enabled Prepress and Inline Quality Control | |
    2. 8.2 Platform Economics and Distributed Production | |
    3. 8.3 Circular Design and Material Substitution | |
    4. 8.4 ESG Reporting and Scope 3 Disclosure | |
  9. 9 Segmentation Analysis | |
    1. 9.1 By Printing Technology | | |
      1. 9.1.1 Offset Lithography | | |
      2. 9.1.2 Rotogravure | | |
      3. 9.1.3 Flexography | | |
      4. 9.1.4 Screen Printing | | |
      5. 9.1.5 Digital Printing | | |
      6. 9.1.6 Other Printing Technologies | |
    2. 9.2 By Ink Type | | |
      1. 9.2.1 Solvent-Based Ink | | |
      2. 9.2.2 UV-Curable Ink | | |
      3. 9.2.3 Aqueous Ink | | |
      4. 9.2.4 Latex Ink | | |
      5. 9.2.5 Other Ink Types | |
    3. 9.3 By Packaging Type | | |
      1. 9.3.1 Labels | | |
      2. 9.3.2 Plastic Containers and Films | | |
      3. 9.3.3 Metal Cans and Foils | | |
      4. 9.3.4 Corrugated Boxes | | |
      5. 9.3.5 Folding Cartons | | |
      6. 9.3.6 Flexible Pouches | | |
      7. 9.3.7 Other Packaging Types | |
    4. 9.4 By End-Use Industry | | |
      1. 9.4.1 Food and Beverage | | |
      2. 9.4.2 Pharmaceutical and Healthcare | | |
      3. 9.4.3 Cosmetics and Personal Care | | |
      4. 9.4.4 Household Chemicals | | |
      5. 9.4.5 Electronics | | |
      6. 9.4.6 Other End-Use Industries | |
  10. 10 Competitive Landscape | |
  11. 11 Recent News & Developments | |
  12. 12 Report Scope and Methodology | |
  13. 13 Detailed Sources and Citations | |
  14. 14 Frequently Asked Questions (FAQs) | | LIST OF TABLES | |
  15. TABLE 1 Global Market Snapshot, 2025–2035 | |
  16. TABLE 2 Global Market Size and Forecast, by Revenue (USD Billion), 2021–2035 | |
  17. TABLE 3 Driver Impact Analysis | |
  18. TABLE 4 Restraints Impact Analysis | |
  19. TABLE 5 Regional Summary, 2025 | |
  20. TABLE 6 North America Market, by Country, 2025 | |
  21. TABLE 7 Europe Market, by Country, 2025 | |
  22. TABLE 8 Asia Pacific Market, by Country, 2025 | |
  23. TABLE 9 South America Market, by Country, 2025 | |
  24. TABLE 10 Middle East and Africa Market, by Country, 2025 | |
  25. TABLE 11 Global Market, by Printing Technology, 2025 | |
  26. TABLE 12 Global Market, by Ink Type, 2025 | |
  27. TABLE 13 Global Market, by Packaging Type, 2025 | |
  28. TABLE 14 Global Market, by End-Use Industry, 2025 | |
  29. TABLE 15 Competitive Benchmarking Matrix, 2025 | |
  30. TABLE 16 Report Scope and Methodology | |
  31. TABLE 17 Detailed Sources and Citations | | LIST OF FIGURES | |
  32. FIGURE 1 Market Dynamics Overview (Drivers, Restraints, Opportunities) | |
  33. FIGURE 2 Packaging Printing Value Chain Analysis | |
  34. FIGURE 3 Porter's Five Forces Analysis | |
  35. FIGURE 4 Global Market Size Trend, 2021–2035 (USD Billion) | |
  36. FIGURE 5 Market Share, by Printing Technology, 2025 | |
  37. FIGURE 6 Market Share, by Ink Type, 2025 | |
  38. FIGURE 7 Market Share, by Packaging Type, 2025 | |
  39. FIGURE 8 Market Share, by End-Use Industry, 2025 | |
  40. FIGURE 9 Regional Market Share, 2025 | |
  41. FIGURE 10 Country-Level Market Share Comparison, 2025 | |
  42. FIGURE 11 Competitive Landscape and Market Concentration, 2025

Segmentation Quick Reference

DimensionSub-SegmentsDominant SegmentFastest Growing Segment
By Printing TechnologyOffset Lithography, Rotogravure, Flexography, Screen Printing, Digital Printing, Other Printing TechnologiesFlexography (33.5% share)Digital Printing (8.0% CAGR)
By Ink TypeSolvent-Based Ink, UV-Curable Ink, Aqueous Ink, Latex Ink, Other Ink TypesSolvent-Based Ink (36.9% share)UV-Curable Ink (7.7% CAGR)
By Packaging TypeLabels, Plastic Containers and Films, Metal Cans and Foils, Corrugated Boxes, Folding Cartons, Flexible Pouches, Other Packaging TypesLabels (28.7% share)Flexible Pouches (8.3% CAGR)
By End-Use IndustryFood and Beverage, Pharmaceutical and Healthcare, Cosmetics and Personal Care, Household Chemicals, Electronics, Other End-Use IndustriesFood and Beverage (27.0% share)Cosmetics and Personal Care (8.5% CAGR)
By RegionNorth America, Europe, Asia Pacific, South America, Middle East and AfricaAsia Pacific (41.2% share)Middle East and Africa (8.6% CAGR)

Market Segmentation Overview

By Printing Technology

Sub-SegmentKey Trend
Offset LithographyGradual loss of folding-carton work to water-based flexo
RotogravureConcentrated in ultra-long runs of laminated films
FlexographyHD plates and automation closing the quality gap with gravure
Screen PrintingNiche use for rigid containers and tactile finishes
Digital PrintingPlate-free variable imaging scaling into production runs
Other Printing TechnologiesHybrid and specialty processes for niche formats

Flexography leads with a 33.5% share because HD plates and automated register control now deliver near-gravure quality at lower setup cost. Digital Printing grows fastest at an 8.0% CAGR, as plate-free imaging handles the serialized codes and frequent artwork changes that analog presses manage poorly. Rotogravure keeps its place only where run lengths are long enough to recover cylinder costs.

By Ink Type

Sub-SegmentKey Trend
Solvent-Based InkRetained for film adhesion but under emission pressure
UV-Curable InkLED curing lowers energy use and speeds throughput
Aqueous InkExpanding from paperboard into film applications
Latex InkLow-odor option for labels and flexible films
Other Ink TypesSecurity, conductive and specialty effect inks

Solvent-Based Ink holds a 36.9% share because it bonds reliably to non-porous films that dominate flexible packaging. UV-Curable Ink grows fastest at a 7.7% CAGR, since LED curing removes drying bottlenecks and cuts energy use while meeting VOC limits in China and the US. Aqueous Ink gains as converters reformulate to avoid costly emission controls.

By Packaging Type

Sub-SegmentKey Trend
LabelsShrink sleeves and wash-off labels for recyclable containers
Plastic Containers and FilmsShift toward mono-material recyclable films
Metal Cans and FoilsStable demand in beverage cans and aerosols
Corrugated BoxesHigher graphics on e-commerce shippers
Folding CartonsSerialization and tamper evidence in pharmaceuticals
Flexible PouchesReplacing rigid jars in pet food, coffee and home care
Other Packaging TypesTubes, sleeves and specialty formats

Labels lead with a 28.7% share, as pressure-sensitive and shrink-sleeve formats give beverage and household chemical brands full-body graphics at low cost. Flexible Pouches grow fastest at an 8.3% CAGR, because stand-up formats cut material and freight weight versus rigid jars. Folding Cartons and Corrugated Boxes gain from serialization rules and e-commerce shipper graphics, respectively.

By End-Use Industry

Sub-SegmentKey Trend
Food and BeverageMandatory labelling and 2D barcode adoption
Pharmaceutical and HealthcareSerialization and anti-tamper requirements
Cosmetics and Personal CarePremium foils, varnishes and limited editions
Household ChemicalsHazard labelling and refill packaging
ElectronicsSecure packaging and tamper-evident seals
Other End-Use IndustriesTobacco, industrial and agricultural applications

Food and Beverage leads with a 27.0% share, driven by statutory ingredient panels and barcodes that must stay legible through chilled supply chains. Cosmetics and Personal Care grows fastest at an 8.5% CAGR, as holographic foils, soft-touch varnishes and short limited-edition runs command premium print pricing. Pharmaceutical and Healthcare adds steady, high-value volume through serialization mandates.


Download PDF ×

We do not share your information with anyone. However, we may send you emails based on your report interest from time to time. You may contact us at any time to opt-out.