• Cat-intel
  • MedIntelliX
  • Resources
  • About Us
  • Hero Background
    English
    Chinese
    French
    Japanese
    Korean
    German
    Spanish

    Osteosarcoma Market Analysis

    ID: MRFR/MED/3003-CR
    103 Pages
    Kinjoll Dey
    October 2019

    Osteosarcoma Market Research Report Information by Type (Intramedullary Osteosarcoma, Juxtacortical Osteosarcoma, Extraskeletal Osteosarcoma), Diagnosis & Treatment (Treatment and Diagnosis), End User (Hospitals & Clinics, Diagnostic Centers and Academic & Research Organizations), by Region (Americas, Europe, Asia-Pacific and the Middle East & Africa) - Forecast till 2035

    Share:
    Download PDF ×

    We do not share your information with anyone. However, we may send you emails based on your report interest from time to time. You may contact us at any time to opt-out.

    Osteosarcoma Market Infographic
    $ 4,950.0
    $ 5,950.0
    $ 7,250.0

    Market Analysis

    In-depth Analysis of Osteosarcoma Market Industry Landscape

    Patients with osteosarcoma have a lot of medical needs that aren't being met, which is driving the market for new and effective treatments. The lack of osteosarcoma-specific medicines with few side effects gives drug companies and academics a chance to improve patient results. Osteosarcoma study and growth change the way the market works. To make tailored and immunotherapies for osteosarcoma, drug companies, study centers, and activist groups work together. As DNA analysis is used in osteosarcoma studies, the market is changing. Understanding genetic changes and molecular traits can lead to personalized and custom treatments for osteosarcoma. Genomic progress allows for more accurate development of therapies that are tailored to each patient. Osteosarcoma is affected by changes in chemotherapy and tailored medicines. Osteosarcoma might be able to be cured with drugs and medicines that target certain biological pathways. These improvements make therapy more possible. Pediatric cancer partnerships change the way the osteosarcoma market works. Collaborations speed up the search for new osteosarcoma treatments, especially for kids and teens, by sharing resources, information, and people who want to take part in clinical trials. Patient support groups and efforts to raise understanding change the way the market works. These groups help people with osteosarcoma and their families, raise awareness, and push for money for study. Osteosarcoma becomes more well known, and people work together more in healthcare. Osteosarcoma clinical studies that change all the time drive market growth. In clinical research, new immunotherapies and focused medicines are being tried out. The results of these tests could change how osteosarcoma is treated. Problems with diagnosing and finding osteosarcoma change the way the market works. A late finding may make treatment less effective. Better early identification and tests help the business by making it easier to help patients and better their results. Osteosarcoma treatments that are available and how much they cost affect how the market works. Therapy uptake is affected by how easy it is to get new medicines and how much patients and doctors are paid. These rules are very important for getting osteosarcoma drugs on the market.

    Market Summary

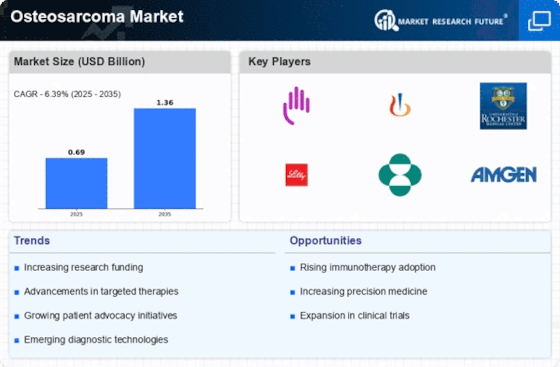
    As per Market Research Future Analysis, the Osteosarcoma Market was valued at USD 0.64 Billion in 2023 and is projected to grow to USD 1.21 Billion by 2032, with a CAGR of 6.39% from 2024 to 2032. The market is driven by the high incidence of osteosarcoma, increasing oncology expenditure, and demand for new treatments. However, high treatment costs and chemotherapy side effects pose challenges. The market is segmented by type, diagnosis & treatment, end-user, and region, with intramedullary osteosarcoma holding the largest share. The Americas accounted for 40.02% of the market in 2018, followed by Europe and Asia-Pacific. Prominent players include Pfizer Inc., Bristol-Myers Squibb, and Eli Lilly.

    Key Market Trends & Highlights

    The Osteosarcoma Market is witnessing significant growth driven by various factors.

    • Market Size in 2023: USD 0.64 Billion.
    • Projected Market Size by 2032: USD 1.21 Billion.
    • CAGR from 2024 to 2032: 6.39%.
    • Americas market share in 2018: 40.02%.

    Market Size & Forecast

    2023 Market Size USD 0.64 Billion
    2024 Market Size USD 0.69 Billion
    2032 Market Size USD 1.21 Billion
    CAGR (2024-2032) 6.39%.

    Major Players

    Pfizer Inc., Bristol-Myers Squibb Company, Eli Lilly and Company, Teva Pharmaceutical Industries Ltd., Baxter, Novartis AG, Aurobindo Pharma, Hikma Pharmaceuticals PLC, Mylan N.V., ADVAXIS, INC.

    Market Trends

    The increasing incidence of osteosarcoma among adolescents and young adults underscores the urgent need for enhanced research and innovative treatment strategies to improve patient outcomes.

    National Cancer Institute

    Osteosarcoma Market Market Drivers

    Increased Research Funding

    The Global Osteosarcoma Market Industry is benefiting from increased research funding aimed at understanding and treating this rare cancer. Government and private organizations are allocating more resources to osteosarcoma research, which is crucial for developing effective therapies. This influx of funding supports clinical trials and the exploration of novel treatment approaches, enhancing the overall knowledge base surrounding the disease. As research progresses, it is likely that new treatment options will emerge, further stimulating market growth. The commitment to advancing osteosarcoma research underscores the industry's potential to innovate and improve patient outcomes in the coming years.

    Market Trends and Projections

    Growing Awareness and Advocacy

    Growing awareness and advocacy efforts surrounding osteosarcoma are playing a pivotal role in shaping the Global Osteosarcoma Market Industry. Organizations dedicated to raising awareness about this rare cancer are increasing public knowledge, which may lead to earlier diagnosis and treatment. Campaigns aimed at educating healthcare professionals and the general public about the signs and symptoms of osteosarcoma are crucial. As awareness grows, it is likely that more patients will seek medical attention sooner, thereby increasing the demand for treatment options. This heightened awareness is expected to contribute positively to the market's growth trajectory in the coming years.

    Rising Incidence of Osteosarcoma

    The Global Osteosarcoma Market Industry is experiencing growth due to the increasing incidence of osteosarcoma, particularly among adolescents and young adults. This demographic is particularly vulnerable, as osteosarcoma is the most common primary bone cancer in this age group. In 2024, the market is valued at approximately 0.69 USD Billion, reflecting a heightened awareness and diagnosis of this condition. As healthcare systems improve their diagnostic capabilities, the number of diagnosed cases is likely to rise, thereby driving demand for treatment options and supportive care. This trend suggests a robust market trajectory as the industry adapts to meet the needs of an expanding patient population.

    Advancements in Treatment Modalities

    Innovations in treatment modalities are significantly influencing the Global Osteosarcoma Market Industry. The introduction of targeted therapies and immunotherapies is changing the landscape of osteosarcoma treatment, offering new hope to patients. For instance, the development of novel agents that specifically target cancer cells while minimizing damage to healthy tissues is gaining traction. These advancements not only improve patient outcomes but also expand the market for new therapeutic agents. As the industry evolves, it is anticipated that these innovative treatments will contribute to the market's growth, potentially doubling its value to 1.46 USD Billion by 2035, with a projected CAGR of 7.03% from 2025 to 2035.

    Emerging Markets and Global Expansion

    The Global Osteosarcoma Market Industry is witnessing expansion into emerging markets, which presents new opportunities for growth. Countries with developing healthcare infrastructures are increasingly recognizing the need for effective cancer treatments, including those for osteosarcoma. As these markets evolve, they are likely to adopt advanced treatment modalities and technologies, thereby enhancing patient access to care. This expansion is expected to drive market growth as companies seek to establish a presence in these regions. The potential for increased patient populations in emerging markets could significantly impact the overall market dynamics, contributing to a more robust global industry.

    Market Segment Insights

    Regional Insights

    Key Companies in the Osteosarcoma Market market include

    Industry Developments

    Future Outlook

    Osteosarcoma Market Future Outlook

    The Global Osteosarcoma Market is projected to grow at a 7.03% CAGR from 2024 to 2035, driven by advancements in treatment modalities and increasing awareness.

    New opportunities lie in:

    • Develop targeted therapies leveraging genomic insights for personalized treatment.
    • Expand telemedicine services to enhance patient access to specialists globally.
    • Invest in innovative diagnostic tools to improve early detection rates.

    By 2035, the Osteosarcoma Market is expected to exhibit robust growth, reflecting advancements in treatment and increased patient engagement.

    Market Segmentation

    Osteosarcoma Market Segmentation

    Market for Osteosarcoma, by Type
    • Intramedullary Osteosarcoma
    • Juxtacortical Osteosarcoma
    • Extraskeletal Osteosarcoma
    Market for Osteosarcoma, by Region
    • {"North America"=>[]}
    • US
    • Canada
    • {"Latin America"=>[]}
    • {"Europe"=>[]}
    • Germany
    • UK
    • France
    • Spain
    • Italy
    • Rest of Europe
    • {"Asia-Pacific"=>[]}
    • China
    • India
    • Japan
    • Australia & New Zealand
    • Southeast Asia
    • Rest of Asia-Pacific
    • {"Middle East & Africa"=>[]}
    • Middle East
    • Africa
    Market for Osteosarcoma, by End User
    • Hospitals & Clinics
    • Diagnostic Centers
    • Academic & Research Organizations
    Market for Osteosarcoma, by Diagnosis & Treatment
    • Treatment
    • Chemotherapy
    • Cisplatin
    • Doxorubicin
    • Epirubicin
    • Others
    • Surgery
    • Limb-Sparing Surgery
    • Amputation
    • Radiation Therapy
    • Others
    • Diagnosis
    • Imaging
    • Computerized Tomography (CT)
    • Magnetic Resonance Imaging (MRI)
    • X-Ray
    •  (PET)
    • Others
    • Biopsies
    • Needle Biopsy
    • Surgical Biopsy
    • Blood Tests
    • Alkaline Phosphatase Profiling
    • Lactate Dehydrogenase Profiling
    • Others

    Report Scope

    Attribute/Metric Details
    Market Size 2023 0.64 (USD Billion)
    Market Size 2024 0.69 (USD Billion)
    Market Size 2032 1.21 (USD Billion)
    Compound Annual Growth Rate (CAGR) 6.39 % (2024 - 2032)
    Report Coverage Revenue Forecast, Competitive Landscape, Growth Factors, and Trends
    Base Year 2023
    Market Forecast Period 2024 - 2032
    Historical Data 2019 - 2023
    Geographies Covered North America, Europe, Asia Pacific, and Rest of the World
    Countries Covered The U.S, Canada, Germany, France, UK, Italy, Spain, China, Japan, India, Australia, South Korea, and Brazil
    Key Companies Profiled Pfizer Inc., Bristol-Myers Squibb Company, Eli Lilly and Company, Teva Pharmaceutical Industries Ltd., Baxter, Novartis AG, Aurobindo Pharma, Hikma Pharmaceuticals PLC, Mylan N.V., and ADVAXIS, INC.
    Key Market Opportunities The major companies are rigorously investing in R&D
    Key Market Dynamics Growing research and development efforts and increasing awareness about early diagnosis are driving the osteosarcoma market, while challenges in treatment innovation and limited therapeutic options pose significant constraints.

    Market Highlights

    Author

    Kinjoll Dey
    Research Analyst Level I

    She holds an experience of about 6+ years in market research and business consulting, working under the spectrum of information communication technology, telecommunications and semiconductor domains. aarti conceptualizes and implements a scalable business strategy and provides strategic leadership to the clients. her expertise lies in market estimation, competitive intelligence, pipeline analysis, customer assessment, etc.

    Leave a Comment

    Latest Comments

    John Doe
    john@example.com

    This is a great article! Really helped me understand the topic better.

    Posted on July 23, 2025, 10:15 AM
    Jane Smith
    jane@domain.com

    Thanks for sharing this. I’ve bookmarked it for later reference.

    Posted on July 22, 2025, 7:45 PM

    FAQs

    At what CAGR is the Osteosarcoma Market projected to grow during the forecast period?

    Osteosarcoma Market is projected to grow at a 6.39% CAGR between 2024-2032.

    Which region is expected to dominate the Osteosarcoma Market?

    The Americas is expected to dominate the Osteosarcoma Market.

    What will be the value of the Osteosarcoma Market during the forecast period?

    Osteosarcoma Market is predicted to touch USD 1.21 Billion by 2032.

    What are the different end users of the Osteosarcoma Market?

    Different end users of the Osteosarcoma Market include diagnostic centers, hospitals and clinics, and academic and research organizations.

    Which factors may limit the Osteosarcoma Market growth?

    Side effects of chemotherapy and high treatment cost may limit the Osteosarcoma Market growth.

    1. Executive Summary
      1. OVERVIEW 18
      2. MARKET SYNOPSIS 18
      3. KEY CONTRIBUTING FACTORS 19
    2. Market Introduction
      1. DEFINITION 20
      2. Scope of the Study 20
      3. RESEARCH OBJECTIVE 20
      4. MARKET STRUCTURE 21
    3. Research Methodology
      1. RESEARCH PROCESS 22
      2. PRIMARY RESEARCH 24
      3. SECONDARY RESEARCH 25
      4. MARKET SIZE ESTIMATION 25
      5. FORECAST MODEL 27
      6. LIST OF ASSUMPTIONS 28
    4. MARKET DYNAMICS
      1. OVERVIEW 29
      2. DRIVERS 30
        1. HIGH INCIDENCE OF OSTEOSARCOMA 30
        2. RISING EXPENDITURE ON ONCOLOGY MEDICINE AND RESEARCH 30
        3. RISING DEMAND FOR NEW TREATMENTS 30
      3. RESTRAINTS 31
        1. HIGH COST OF TREATMENT 31
        2. SIDE-EFFECTS OF CHEMOTHERAPY 31
      4. OPPORTUNITIES 32
        1. ENTERING DEVELOPING ECONOMIES 32
      5. MACROECONOMIC INDICATORS 33
    5. MARKET FACTOR ANALYSIS
      1. PORTER’S FIVE FORCES MODEL 34
        1. BARGAINING POWER OF SUPPLIERS 35
        2. BARGAINING POWER OF BUYERS 35
        3. THREAT OF NEW ENTRANTS 35
        4. THREAT OF SUBSTITUTES 35
        5. INTENSITY OF RIVALRY 35
      2. VALUE CHAIN ANALYSIS 36
        1. R&D AND DESIGNING 37
        2. MANUFACTURING 37
        3. DISTRIBUTION 37
        4. MARKETING & SALES 37
        5. POST-SALES MONITORING 37
      3. EPIDEMIOLOGY DATA 38
      4. CLINICAL TRIALS ANALYSIS 39
      5. PIPELINE ANALYSIS 41
        1. PEMETREXED 41
        2. INHALED LIPID CISPLATIN 41
    6. OSTEOSARCOMA MARKET, BY TYPE
      1. OVERVIEW 42
      2. INTRAMEDULLARY OSTEOSARCOMA 43
      3. JUXTACORTICAL OSTEOSARCOMA 44
      4. EXTRASKELETAL OSTEOSARCOMA 44
    7. OSTEOSARCOMA MARKET, BY DIAGNOSIS & TREATMENT
      1. OVERVIEW 45
      2. TREATMENT 46
        1. CHEMOTHERAPY 47
        2. SURGERY 47
        3. RADIATION THERAPY 47
      3. DIAGNOSIS 48
        1. IMAGING 48
        2. BIOPSIES 49
        3. BLOOD TESTS 50
    8. OSTEOSARCOMA MARKET, BY END USER
      1. OVERVIEW 51
      2. HOSPITALS & CLINICS 52
      3. DIAGNOSTIC CENTERS 52
      4. ACADEMIC & RESEARCH ORGANIZATIONS 53
    9. GLOBAL OSTEOSARCOMA MARKET, BY REGION
      1. OVERVIEW 54
      2. AMERICAS 56
    10. OSTEOSARCOMA MARKET, BY TYPE
    11. OSTEOSARCOMA MARKET, BY DIAGNOSIS & TREATMENT
    12. OSTEOSARCOMA MARKET, BY END USER
      1. NORTH AMERICA 60
    13. OSTEOSARCOMA MARKET, BY DIAGNOSIS & TREATMENT
    14. OSTEOSARCOMA MARKET, BY END USER
      1. US 63
    15. OSTEOSARCOMA MARKET, BY END USER
      1. US: OSTEOSARCOMA MARKET FOR DIAGNOSIS, BY TYPE 2020–2027 (USD MILLION) 65
        1. CANADA 66
    16. OSTEOSARCOMA MARKET, BY TYPE
      1. LATIN AMERICA 69
      2. EUROPE 73
    17. OSTEOSARCOMA MARKET, BY TYPE
      1. WESTERN EUROPE 76
        1. GERMANY 80
    18. OSTEOSARCOMA MARKET, BY TYPE
      1. EASTERN EUROPE 99
    19. OSTEOSARCOMA MARKET, BY DIAGNOSIS & TREATMENT
      1. ASIA-PACIFIC 103
    20. OSTEOSARCOMA MARKET, BY DIAGNOSIS & TREATMENT
      1. JAPAN 107
        1. CHINA 110
        2. INDIA 113
        3. SOUTH KOREA 116
    21. OSTEOSARCOMA MARKET, BY DIAGNOSIS & TREATMENT
      1. REST OF ASIA-PACIFIC 119
      2. MIDDLE EAST & AFRICA 123
        1. MIDDLE EAST 127
        2. AFRICA 130
    22. Competitive Landscape
      1. OVERVIEW 134
      2. KEY DEVELOPMENTS 134
    23. COMPANY PROFILES
      1. PFIZER INC. 136
        1. COMPANY OVERVIEW 136
        2. FINANCIAL OVERVIEW 137
        3. PRODUCTS/SERVICES OFFERED 137
        4. KEY DEVELOPMENTS 138
        5. SWOT ANALYSIS 138
        6. KEY STRATEGIES 138
      2. BRISTOL-MYERS SQUIBB COMPANY 139
        1. COMPANY OVERVIEW 139
        2. FINANCIAL OVERVIEW 139
        3. PRODUCTS/SERVICES OFFERED 140
        4. KEY DEVELOPMENTS 140
        5. SWOT ANALYSIS 140
        6. EY STRATEGIES 141
      3. ELI LILLY AND COMPANY 142
        1. COMPANY OVERVIEW 142
        2. FINANCIAL OVERVIEW 143
        3. PRODUCTS/SERVICES OFFERED 143
        4. KEY DEVELOPMENTS 143
        5. SWOT ANALYSIS 144
        6. KEY STRATEGIES 144
      4. TEVA PHARMACEUTICAL INDUSTRIES LTD 145
        1. COMPANY OVERVIEW 145
        2. FINANCIAL OVERVIEW 146
        3. PRODUCTS/SERVICES OFFERED 146
        4. KEY DEVELOPMENTS 146
        5. SWOT ANALYSIS 147
        6. KEY STRATEGIES 147
      5. BAXTER INTERNATIONAL 148
        1. COMPANY OVERVIEW 148
        2. FINANCIAL OVERVIEW 148
        3. PRODUCTS/SERVICES OFFERED 149
        4. KEY DEVELOPMENTS 149
        5. SWOT ANALYSIS 150
        6. KEY STRATEGIES 150
      6. NOVARTIS AG 151
        1. COMPANY OVERVIEW 151
        2. FINANCIAL OVERVIEW 151
        3. PRODUCTS/SERVICES OFFERED 152
        4. KEY DEVELOPMENTS 152
        5. SWOT ANALYSIS 153
        6. KEY STRATEGIES 153
      7. AUROBINDO PHARMA LIMITED 154
        1. COMPANY OVERVIEW 154
        2. FINANCIAL OVERVIEW 154
        3. PRODUCTS/SERVICES OFFERED 155
        4. KEY DEVELOPMENTS 155
        5. SWOT ANALYSIS 156
        6. KEY STRATEGIES 156
      8. HIKMA PHARMACEUTICALS PLC 157
        1. COMPANY OVERVIEW 157
        2. FINANCIAL OVERVIEW 157
        3. PRODUCTS/SERVICES OFFERED 158
        4. KEY DEVELOPMENTS 158
        5. SWOT ANALYSIS 159
        6. KEY STRATEGIES 159
      9. MYLAN NV 160
        1. COMPANY OVERVIEW 160
        2. FINANCIAL OVERVIEW 161
        3. PRODUCTS/SERVICES OFFERED 162
        4. KEY DEVELOPMENTS 162
        5. SWOT ANALYSIS 163
        6. KEY STRATEGIES 163
      10. ADVAXIS, INC. 164
        1. COMPANY OVERVIEW 164
        2. FINANCIAL OVERVIEW 164
        3. PRODUCTS/SERVICES OFFERED 164
        4. KEY DEVELOPMENTS 165
        5. SWOT ANALYSIS 165
        6. KEY STRATEGIES 166
    24. APPENDIX
      1. REFERENCES 167
      2. RELATED REPORTS 167
    25. List of Tables and Figures
      1. 13 LIST OF TABLES
      2. TABLE 1 PRIMARY INTERVIEWS 24
      3. TABLE 2 LIST OF ASSUMPTIONS 28
      4. TABLE 3 INCIDENCE OF OSTEOSARCOMA, BY AGE IN THE US 38
      5. TABLE 4 CLINICAL TRIALS 39
      6. TABLE 5 PIPELINE ANALYSIS 41
      7. TABLE 6 GLOBAL OSTEOSARCOMA MARKET, BY TYPE 2020–2027 (USD MILLION) 42
      8. TABLE 7 GLOBAL INTRAMEDULLARY OSTEOSARCOMA: MARKET ESTIMATES & FORECAST, BY REGION, 2020–2027 (USD MILLION) 43
      9. TABLE 8 GLOBAL JUXTACORTICAL OSTEOSARCOMA: MARKET ESTIMATES & FORECAST, BY REGION, 2020–2027 (USD MILLION) 44
      10. TABLE 9 GLOBAL EXTRASKELETAL OSTEOSARCOMA: MARKET ESTIMATES & FORECAST, BY REGION, 2020–2027 (USD MILLION) 44
      11. TABLE 10 GLOBAL OSTEOSARCOMA MARKET, BY DIAGNOSIS & TREATMENT 2020–2027 (USD MILLION) 45
      12. TABLE 11 GLOBAL TREATMENT: MARKET ESTIMATES & FORECAST, BY REGION, 2020–2027 (USD MILLION) 46
      13. TABLE 12 GLOBAL TREATMENT: MARKET ESTIMATES & FORECAST, BY TYPE, 2020–2027 (USD MILLION) 46
      14. TABLE 13 GLOBAL CHEMOTHERAPY: MARKET ESTIMATES & FORECAST, BY TYPE, 2020–2027 (USD MILLION) 47
      15. TABLE 14 GLOBAL SURGERY: MARKET ESTIMATES & FORECAST, BY TYPE, 2020–2027 (USD MILLION) 47
      16. TABLE 15 GLOBAL DIAGNOSIS: MARKET ESTIMATES & FORECAST, BY REGION, 2020–2027 (USD MILLION) 48
      17. TABLE 16 GLOBAL DIAGNOSIS: MARKET ESTIMATES & FORECAST, BY TYPE, 2020–2027 (USD MILLION) 48
      18. TABLE 17 GLOBAL IMAGING: MARKET ESTIMATES & FORECAST, BY TYPE, 2020–2027 (USD MILLION) 49
      19. TABLE 18 GLOBAL BIOPSIES: MARKET ESTIMATES & FORECAST, BY TYPE, 2020–2027 (USD MILLION) 49
      20. TABLE 19 GLOBAL BLOOD TESTS: MARKET ESTIMATES & FORECAST, BY TYPE, 2020–2027 (USD MILLION) 50
      21. TABLE 20 GLOBAL OSTEOSARCOMA MARKET, BY END USER, 2020–2027 (USD MILLION) 51
      22. TABLE 21 GLOBAL HOSPITALS & CLINICS: MARKET ESTIMATES & FORECAST, BY REGION, 2020–2027 (USD MILLION) 52
      23. TABLE 22 GLOBAL DIAGNOSTIC CENTERS: MARKET ESTIMATES & FORECAST, BY REGION, 2020–2027 (USD MILLION) 53
      24. TABLE 23 GLOBAL ACADEMIC INSTITUTES & RESEARCH ORGANIZATIONS: MARKET ESTIMATES & FORECAST, BY REGION, 2020–2027 (USD MILLION) 53
      25. TABLE 24 GLOBAL OSTEOSARCOMA MARKET, BY REGION, 2020–2027 (USD MILLION) 55
      26. TABLE 25 AMERICAS: OSTEOSARCOMA MARKET, BY REGION, 2020–2027 (USD MILLION) 56
      27. TABLE 26 AMERICAS: OSTEOSARCOMA MARKET, BY TYPE, 2020–2027 (USD MILLION) 56
      28. TABLE 27 AMERICAS: OSTEOSARCOMA MARKET, BY DIAGNOSIS & TREATMENT 2020–2027 (USD MILLION) 57
      29. TABLE 28 AMERICAS: OSTEOSARCOMA MARKET FOR TREATMENT, BY TYPE, 2020–2027 (USD MILLION) 57
      30. TABLE 29 AMERICAS: OSTEOSARCOMA MARKET FOR CHEMOTHERAPY, BY TYPE, 2020–2027 (USD MILLION) 57
      31. TABLE 30 AMERICAS: OSTEOSARCOMA MARKET FOR SURGERY, BY TYPE, 2020–2027 (USD MILLION) 58
      32. TABLE 31 AMERICAS: OSTEOSARCOMA MARKET FOR DIAGNOSIS, BY TYPE 2020–2027 (USD MILLION) 58
      33. TABLE 32 AMERICAS: OSTEOSARCOMA MARKET FOR IMAGING, BY TYPE 2020–2027 (USD MILLION) 58
      34. TABLE 33 AMERICAS: OSTEOSARCOMA MARKET FOR BIOPSIES, BY TYPE 2020–2027 (USD MILLION) 59
      35. TABLE 34 AMERICAS: OSTEOSARCOMA MARKET FOR BLOOD TESTS, BY TYPE 2020–2027 (USD MILLION) 59
      36. TABLE 35 AMERICAS: OSTEOSARCOMA MARKET, BY END USER, 2020–2027 (USD MILLION) 59
      37. TABLE 36 NORTH AMERICA: OSTEOSARCOMA MARKET, BY COUNTRY, 2020–2027 (USD MILLION) 60
      38. TABLE 37 NORTH AMERICA: OSTEOSARCOMA MARKET, BY TYPE, 2020–2027 (USD MILLION) 60
      39. TABLE 38 NORTH AMERICA: OSTEOSARCOMA MARKET, BY DIAGNOSIS & TREATMENT 2020–2027 (USD MILLION) 60
      40. TABLE 39 NORTH AMERICA: OSTEOSARCOMA MARKET FOR TREATMENT, BY TYPE, 2020–2027 (USD MILLION) 61
      41. TABLE 40 NORTH AMERICA: OSTEOSARCOMA MARKET FOR CHEMOTHERAPY, BY TYPE, 2020–2027 (USD MILLION) 61
      42. TABLE 41 NORTH AMERICA: OSTEOSARCOMA MARKET FOR SURGERY, BY TYPE, 2020–2027 (USD MILLION) 61
      43. TABLE 42 NORTH AMERICA: OSTEOSARCOMA MARKET FOR DIAGNOSIS, BY TYPE 2020–2027 (USD MILLION) 62
      44. TABLE 43 NORTH AMERICA: OSTEOSARCOMA MARKET FOR IMAGING, BY TYPE 2020–2027 (USD MILLION) 62
      45. TABLE 44 NORTH AMERICA: OSTEOSARCOMA MARKET FOR BIOPSIES, BY TYPE 2020–2027 (USD MILLION) 62
      46. TABLE 45 NORTH AMERICA: OSTEOSARCOMA MARKET FOR BLOOD TESTS, BY TYPE 2020–2027 (USD MILLION) 63
      47. TABLE 46 NORTH AMERICA: OSTEOSARCOMA MARKET, BY END USER, 2020–2027 (USD MILLION) 63
      48. TABLE 47 US: OSTEOSARCOMA MARKET, BY TYPE, 2020–2027 (USD MILLION) 63
      49. TABLE 48 US: OSTEOSARCOMA MARKET, BY DIAGNOSIS & TREATMENT 2020–2027 (USD MILLION) 64
      50. TABLE 49 US: OSTEOSARCOMA MARKET FOR TREATMENT, BY TYPE, 2020–2027 (USD MILLION) 64
      51. TABLE 50 US: OSTEOSARCOMA MARKET FOR CHEMOTHERAPY, BY TYPE, 2020–2027 (USD MILLION) 64
      52. TABLE 51 US: OSTEOSARCOMA MARKET FOR SURGERY, BY TYPE, 2020–2027 (USD MILLION) 64
      53. TABLE 52 US: OSTEOSARCOMA MARKET FOR IMAGING, BY TYPE 2020–2027 (USD MILLION) 65
      54. TABLE 53 US: OSTEOSARCOMA MARKET FOR BIOPSIES, BY TYPE 2020–2027 (USD MILLION) 65
      55. TABLE 54 US: OSTEOSARCOMA MARKET FOR BLOOD TESTS, BY TYPE 2020–2027 (USD MILLION) 66
      56. TABLE 55 US: OSTEOSARCOMA MARKET, BY END USER, 2020–2027 (USD MILLION) 66
      57. TABLE 56 CANADA: OSTEOSARCOMA MARKET, BY TYPE, 2020–2027 (USD MILLION) 66
      58. TABLE 57 CANADA: OSTEOSARCOMA MARKET, BY DIAGNOSIS & TREATMENT 2020–2027 (USD MILLION) 67
      59. TABLE 58 CANADA: OSTEOSARCOMA MARKET FOR TREATMENT, BY TYPE, 2020–2027 (USD MILLION) 67
      60. TABLE 59 CANADA: OSTEOSARCOMA MARKET FOR CHEMOTHERAPY, BY TYPE, 2020–2027 (USD MILLION) 67
      61. TABLE 60 CANADA: OSTEOSARCOMA MARKET FOR SURGERY, BY TYPE, 2020–2027 (USD MILLION) 67
      62. TABLE 61 CANADA: OSTEOSARCOMA MARKET FOR DIAGNOSIS, BY TYPE 2020–2027 (USD MILLION) 68
      63. TABLE 62 CANADA: OSTEOSARCOMA MARKET FOR IMAGING, BY TYPE 2020–2027 (USD MILLION) 68
      64. TABLE 63 CANADA: OSTEOSARCOMA MARKET FOR BIOPSIES, BY TYPE 2020–2027 (USD MILLION) 68
      65. TABLE 64 CANADA: OSTEOSARCOMA MARKET FOR BLOOD TESTS, BY TYPE 2020–2027 (USD MILLION) 69
      66. TABLE 65 CANADA: OSTEOSARCOMA MARKET, BY END USER, 2020–2027 (USD MILLION) 69
      67. TABLE 66 LATIN AMERICA: OSTEOSARCOMA MARKET, BY TYPE, 2020–2027 (USD MILLION) 69
      68. TABLE 67 LATIN AMERICA: OSTEOSARCOMA MARKET, BY DIAGNOSIS & TREATMENT 2020–2027 (USD MILLION) 70
      69. TABLE 68 LATIN AMERICA: OSTEOSARCOMA MARKET FOR TREATMENT, BY TYPE, 2020–2027 (USD MILLION) 70
      70. TABLE 69 LATIN AMERICA: OSTEOSARCOMA MARKET FOR CHEMOTHERAPY, BY TYPE, 2020–2027 (USD MILLION) 70
      71. TABLE 70 LATIN AMERICA: OSTEOSARCOMA MARKET FOR SURGERY, BY TYPE, 2020–2027 (USD MILLION) 70
      72. TABLE 71 LATIN AMERICA: OSTEOSARCOMA MARKET FOR DIAGNOSIS, BY TYPE 2020–2027 (USD MILLION) 71
      73. TABLE 72 LATIN AMERICA: OSTEOSARCOMA MARKET FOR IMAGING, BY TYPE 2020–2027 (USD MILLION) 71
      74. TABLE 73 LATIN AMERICA: OSTEOSARCOMA MARKET FOR BIOPSIES, BY TYPE 2020–2027 (USD MILLION) 71
      75. TABLE 74 LATIN AMERICA: OSTEOSARCOMA MARKET FOR BLOOD TESTS, BY TYPE 2020–2027 (USD MILLION) 72
      76. TABLE 75 LATIN AMERICA: OSTEOSARCOMA MARKET, BY END USER, 2020–2027 (USD MILLION) 72
      77. TABLE 76 EUROPE: OSTEOSARCOMA MARKET, BY REGION, 2020–2027 (USD MILLION) 73
      78. TABLE 77 EUROPE: OSTEOSARCOMA MARKET, BY TYPE, 2020–2027 (USD MILLION) 73
      79. TABLE 78 EUROPE: OSTEOSARCOMA MARKET, BY DIAGNOSIS & TREATMENT 2020–2027 (USD MILLION) 74
      80. TABLE 79 EUROPE: OSTEOSARCOMA MARKET FOR TREATMENT, BY TYPE, 2020–2027 (USD MILLION) 74
      81. TABLE 80 EUROPE: OSTEOSARCOMA MARKET FOR CHEMOTHERAPY, BY TYPE, 2020–2027 (USD MILLION) 74
      82. TABLE 81 EUROPE: OSTEOSARCOMA MARKET FOR SURGERY, BY TYPE, 2020–2027 (USD MILLION) 74
      83. TABLE 82 EUROPE: OSTEOSARCOMA MARKET FOR DIAGNOSIS, BY TYPE 2020–2027 (USD MILLION) 75
      84. TABLE 83 EUROPE: OSTEOSARCOMA MARKET FOR IMAGING, BY TYPE 2020–2027 (USD MILLION) 75
      85. TABLE 84 EUROPE: OSTEOSARCOMA MARKET FOR BIOPSIES, BY TYPE 2020–2027 (USD MILLION) 75
      86. TABLE 85 EUROPE: OSTEOSARCOMA MARKET FOR BLOOD TESTS, BY TYPE 2020–2027 (USD MILLION) 76
      87. TABLE 86 EUROPE: OSTEOSARCOMA MARKET, BY END USER, 2020–2027 (USD MILLION) 76
      88. TABLE 87 WESTERN EUROPE: OSTEOSARCOMA MARKET, BY COUNTRY, 2020–2027 (USD MILLION) 76
      89. TABLE 88 WESTERN EUROPE: OSTEOSARCOMA MARKET, BY TYPE, 2020–2027 (USD MILLION) 77
      90. TABLE 89 WESTERN EUROPE: OSTEOSARCOMA MARKET, BY DIAGNOSIS & TREATMENT 2020–2027 (USD MILLION) 77
      91. TABLE 90 WESTERN EUROPE: OSTEOSARCOMA MARKET FOR TREATMENT, BY TYPE, 2020–2027 (USD MILLION) 77
      92. TABLE 91 WESTERN EUROPE: OSTEOSARCOMA MARKET FOR CHEMOTHERAPY, BY TYPE, 2020–2027 (USD MILLION) 78
      93. TABLE 92 WESTERN EUROPE: OSTEOSARCOMA MARKET FOR SURGERY, BY TYPE, 2020–2027 (USD MILLION) 78
      94. TABLE 93 WESTERN EUROPE: OSTEOSARCOMA MARKET FOR DIAGNOSIS, BY TYPE 2020–2027 (USD MILLION) 78
      95. TABLE 94 WESTERN EUROPE: OSTEOSARCOMA MARKET FOR IMAGING, BY TYPE 2020–2027 (USD MILLION) 79
      96. TABLE 95 WESTERN EUROPE: OSTEOSARCOMA MARKET FOR BIOPSIES, BY TYPE 2020–2027 (USD MILLION) 79
      97. TABLE 96 WESTERN EUROPE: OSTEOSARCOMA MARKET FOR BLOOD TESTS, BY TYPE 2020–2027 (USD MILLION) 79
      98. TABLE 97 WESTERN EUROPE: OSTEOSARCOMA MARKET, BY END USER, 2020–2027 (USD MILLION) 80
      99. TABLE 98 GERMANY: OSTEOSARCOMA MARKET, BY TYPE, 2020–2027 (USD MILLION) 80
      100. TABLE 99 GERMANY: OSTEOSARCOMA MARKET, BY DIAGNOSIS & TREATMENT 2020–2027 (USD MILLION) 80
      101. TABLE 100 GERMANY: OSTEOSARCOMA MARKET FOR TREATMENT, BY TYPE, 2020–2027 (USD MILLION) 81
      102. TABLE 101 GERMANY: OSTEOSARCOMA MARKET FOR CHEMOTHERAPY, BY TYPE, 2020–2027 (USD MILLION) 81
      103. TABLE 102 GERMANY: OSTEOSARCOMA MARKET FOR SURGERY, BY TYPE, 2020–2027 (USD MILLION) 81
      104. TABLE 103 GERMANY: OSTEOSARCOMA MARKET FOR DIAGNOSIS, BY TYPE 2020–2027 (USD MILLION) 82
      105. TABLE 104 GERMANY: OSTEOSARCOMA MARKET FOR IMAGING, BY TYPE 2020–2027 (USD MILLION) 82
      106. TABLE 105 GERMANY: OSTEOSARCOMA MARKET FOR BIOPSIES, BY TYPE 2020–2027 (USD MILLION) 82
      107. TABLE 106 GERMANY: OSTEOSARCOMA MARKET FOR BLOOD TESTS, BY TYPE 2020–2027 (USD MILLION) 83
      108. TABLE 107 GERMANY: OSTEOSARCOMA MARKET, BY END USER, 2020–2027 (USD MILLION) 83
      109. TABLE 108 FRANCE: OSTEOSARCOMA MARKET, BY TYPE, 2020–2027 (USD MILLION) 83
      110. TABLE 109 FRANCE: OSTEOSARCOMA MARKET, BY DIAGNOSIS & TREATMENT 2020–2027 (USD MILLION) 84
      111. TABLE 110 FRANCE: OSTEOSARCOMA MARKET FOR TREATMENT, BY TYPE, 2020–2027 (USD MILLION) 84
      112. TABLE 111 FRANCE: OSTEOSARCOMA MARKET FOR CHEMOTHERAPY, BY TYPE, 2020–2027 (USD MILLION) 84
      113. TABLE 112 FRANCE: OSTEOSARCOMA MARKET FOR SURGERY, BY TYPE, 2020–2027 (USD MILLION) 84
      114. TABLE 113 FRANCE: OSTEOSARCOMA MARKET FOR DIAGNOSIS, BY TYPE 2020–2027 (USD MILLION) 85
      115. TABLE 114 FRANCE: OSTEOSARCOMA MARKET FOR IMAGING, BY TYPE 2020–2027 (USD MILLION) 85
      116. TABLE 115 FRANCE: OSTEOSARCOMA MARKET FOR BIOPSIES, BY TYPE 2020–2027 (USD MILLION) 85
      117. TABLE 116 FRANCE: OSTEOSARCOMA MARKET FOR BLOOD TESTS, BY TYPE 2020–2027 (USD MILLION) 86
      118. TABLE 117 FRANCE: OSTEOSARCOMA MARKET, BY END USER, 2020–2027 (USD MILLION) 86
      119. TABLE 118 UK: OSTEOSARCOMA MARKET, BY TYPE, 2020–2027 (USD MILLION) 86
      120. TABLE 119 UK: OSTEOSARCOMA MARKET, BY DIAGNOSIS & TREATMENT 2020–2027 (USD MILLION) 87
      121. TABLE 120 UK: OSTEOSARCOMA MARKET FOR TREATMENT, BY TYPE, 2020–2027 (USD MILLION) 87
      122. TABLE 121 UK: OSTEOSARCOMA MARKET FOR CHEMOTHERAPY, BY TYPE, 2020–2027 (USD MILLION) 87
      123. TABLE 122 UK: OSTEOSARCOMA MARKET FOR SURGERY, BY TYPE, 2020–2027 (USD MILLION) 87
      124. TABLE 123 UK: OSTEOSARCOMA MARKET FOR DIAGNOSIS, BY TYPE 2020–2027 (USD MILLION) 88
      125. TABLE 124 UK: OSTEOSARCOMA MARKET FOR IMAGING, BY TYPE 2020–2027 (USD MILLION) 88
      126. TABLE 125 UK: OSTEOSARCOMA MARKET FOR BIOPSIES, BY TYPE 2020–2027 (USD MILLION) 88
      127. TABLE 126 UK: OSTEOSARCOMA MARKET FOR BLOOD TESTS, BY TYPE 2020–2027 (USD MILLION) 89
      128. TABLE 127 UK: OSTEOSARCOMA MARKET, BY END USER, 2020–2027 (USD MILLION) 89
      129. TABLE 128 ITALY: OSTEOSARCOMA MARKET, BY TYPE, 2020–2027 (USD MILLION) 89
      130. TABLE 129 ITALY: OSTEOSARCOMA MARKET, BY DIAGNOSIS & TREATMENT 2020–2027 (USD MILLION) 90
      131. TABLE 130 ITALY: OSTEOSARCOMA MARKET FOR TREATMENT, BY TYPE, 2020–2027 (USD MILLION) 90
      132. TABLE 131 ITALY: OSTEOSARCOMA MARKET FOR CHEMOTHERAPY, BY TYPE, 2020–2027 (USD MILLION) 90
      133. TABLE 132 ITALY: OSTEOSARCOMA MARKET FOR SURGERY, BY TYPE, 2020–2027 (USD MILLION) 90
      134. TABLE 133 ITALY: OSTEOSARCOMA MARKET FOR DIAGNOSIS, BY TYPE 2020–2027 (USD MILLION) 91
      135. TABLE 134 ITALY: OSTEOSARCOMA MARKET FOR IMAGING, BY TYPE 2020–2027 (USD MILLION) 91
      136. TABLE 135 ITALY: OSTEOSARCOMA MARKET FOR BIOPSIES, BY TYPE 2020–2027 (USD MILLION) 91
      137. TABLE 136 ITALY: OSTEOSARCOMA MARKET FOR BLOOD TESTS, BY TYPE 2020–2027 (USD MILLION) 92
      138. TABLE 137 ITALY: OSTEOSARCOMA MARKET, BY END USER, 2020–2027 (USD MILLION) 92
      139. TABLE 138 SPAIN: OSTEOSARCOMA MARKET, BY TYPE, 2020–2027 (USD MILLION) 92
      140. TABLE 139 SPAIN: OSTEOSARCOMA MARKET, BY DIAGNOSIS & TREATMENT 2020–2027 (USD MILLION) 93
      141. TABLE 140 SPAIN: OSTEOSARCOMA MARKET FOR TREATMENT, BY TYPE, 2020–2027 (USD MILLION) 93
      142. TABLE 141 SPAIN: OSTEOSARCOMA MARKET FOR CHEMOTHERAPY, BY TYPE, 2020–2027 (USD MILLION) 93
      143. TABLE 142 SPAIN: OSTEOSARCOMA MARKET FOR SURGERY, BY TYPE, 2020–2027 (USD MILLION) 93
      144. TABLE 143 SPAIN: OSTEOSARCOMA MARKET FOR DIAGNOSIS, BY TYPE 2020–2027 (USD MILLION) 94
      145. TABLE 144 SPAIN: OSTEOSARCOMA MARKET FOR IMAGING, BY TYPE 2020–2027 (USD MILLION) 94
      146. TABLE 145 SPAIN: OSTEOSARCOMA MARKET FOR BIOPSIES, BY TYPE 2020–2027 (USD MILLION) 94
      147. TABLE 146 SPAIN: OSTEOSARCOMA MARKET FOR BLOOD TESTS, BY TYPE 2020–2027 (USD MILLION) 95
      148. TABLE 147 SPAIN: OSTEOSARCOMA MARKET, BY END USER, 2020–2027 (USD MILLION) 95
      149. TABLE 148 REST OF WESTERN EUROPE: OSTEOSARCOMA MARKET, BY TYPE, 2020–2027 (USD MILLION) 95
      150. TABLE 149 REST OF WESTERN EUROPE: OSTEOSARCOMA MARKET, BY DIAGNOSIS & TREATMENT 2020–2027 (USD MILLION) 96
      151. TABLE 150 REST OF WESTERN EUROPE: OSTEOSARCOMA MARKET FOR TREATMENT, BY TYPE, 2020–2027 (USD MILLION) 96
      152. TABLE 151 REST OF WESTERN EUROPE: OSTEOSARCOMA MARKET FOR CHEMOTHERAPY, BY TYPE, 2020–2027 (USD MILLION) 96
      153. TABLE 152 REST OF WESTERN EUROPE: OSTEOSARCOMA MARKET FOR SURGERY, BY TYPE, 2020–2027 (USD MILLION) 97
      154. TABLE 153 REST OF WESTERN EUROPE: OSTEOSARCOMA MARKET FOR DIAGNOSIS, BY TYPE 2020–2027 (USD MILLION) 97
      155. TABLE 154 REST OF WESTERN EUROPE: OSTEOSARCOMA MARKET FOR IMAGING, BY TYPE 2020–2027 (USD MILLION) 97
      156. TABLE 155 REST OF WESTERN EUROPE: OSTEOSARCOMA MARKET FOR BIOPSIES, BY TYPE 2020–2027 (USD MILLION) 98
      157. TABLE 156 REST OF WESTERN EUROPE: OSTEOSARCOMA MARKET FOR BLOOD TESTS, BY TYPE 2020–2027 (USD MILLION) 98
      158. TABLE 157 REST OF WESTERN EUROPE: OSTEOSARCOMA MARKET, BY END USER, 2020–2027 (USD MILLION) 98
      159. TABLE 158 EASTERN EUROPE: OSTEOSARCOMA MARKET, BY TYPE, 2020–2027 (USD MILLION) 99
      160. TABLE 159 EASTERN EUROPE: OSTEOSARCOMA MARKET, BY DIAGNOSIS & TREATMENT 2020–2027 (USD MILLION) 99
      161. TABLE 160 EASTERN EUROPE: OSTEOSARCOMA MARKET FOR TREATMENT, BY TYPE, 2020–2027 (USD MILLION) 99
      162. TABLE 161 EASTERN EUROPE: OSTEOSARCOMA MARKET FOR CHEMOTHERAPY, BY TYPE, 2020–2027 (USD MILLION) 100
      163. TABLE 162 EASTERN EUROPE: OSTEOSARCOMA MARKET FOR SURGERY, BY TYPE, 2020–2027 (USD MILLION) 100
      164. TABLE 163 EASTERN EUROPE: OSTEOSARCOMA MARKET FOR DIAGNOSIS, BY TYPE 2020–2027 (USD MILLION) 100
      165. TABLE 164 EASTERN EUROPE: OSTEOSARCOMA MARKET FOR IMAGING, BY TYPE 2020–2027 (USD MILLION) 101
      166. TABLE 165 EASTERN EUROPE: OSTEOSARCOMA MARKET FOR BIOPSIES, BY TYPE 2020–2027 (USD MILLION) 101
      167. TABLE 166 EASTERN EUROPE: OSTEOSARCOMA MARKET FOR BLOOD TESTS, BY TYPE 2020–2027 (USD MILLION) 101
      168. TABLE 167 EASTERN EUROPE: OSTEOSARCOMA MARKET, BY END USER, 2020–2027 (USD MILLION) 102
      169. TABLE 168 ASIA-PACIFIC: OSTEOSARCOMA MARKET, BY COUNTRY, 2020–2027 (USD MILLION) 103
      170. TABLE 169 ASIA-PACIFIC: OSTEOSARCOMA MARKET, BY TYPE, 2020–2027 (USD MILLION) 104
      171. TABLE 170 ASIA-PACIFIC: OSTEOSARCOMA MARKET, BY DIAGNOSIS & TREATMENT 2020–2027 (USD MILLION) 104
      172. TABLE 171 ASIA-PACIFIC: OSTEOSARCOMA MARKET FOR TREATMENT, BY TYPE, 2020–2027 (USD MILLION) 104
      173. TABLE 172 ASIA-PACIFIC: OSTEOSARCOMA MARKET FOR CHEMOTHERAPY, BY TYPE, 2020–2027 (USD MILLION) 105
      174. TABLE 173 ASIA-PACIFIC: OSTEOSARCOMA MARKET FOR SURGERY, BY TYPE, 2020–2027 (USD MILLION) 105
      175. TABLE 174 ASIA-PACIFIC: OSTEOSARCOMA MARKET FOR DIAGNOSIS, BY TYPE 2020–2027 (USD MILLION) 105
      176. TABLE 175 ASIA-PACIFIC: OSTEOSARCOMA MARKET FOR IMAGING, BY TYPE 2020–2027 (USD MILLION) 106
      177. TABLE 176 ASIA-PACIFIC: OSTEOSARCOMA MARKET FOR BIOPSIES, BY TYPE 2020–2027 (USD MILLION) 106
      178. TABLE 177 ASIA-PACIFIC: OSTEOSARCOMA MARKET FOR BLOOD TESTS, BY TYPE 2020–2027 (USD MILLION) 106
      179. TABLE 178 ASIA-PACIFIC: OSTEOSARCOMA MARKET, BY END USER, 2020–2027 (USD MILLION) 107
      180. TABLE 179 JAPAN: OSTEOSARCOMA MARKET, BY TYPE, 2020–2027 (USD MILLION) 107
      181. TABLE 180 JAPAN: OSTEOSARCOMA MARKET, BY DIAGNOSIS & TREATMENT 2020–2027 (USD MILLION) 107
      182. TABLE 181 JAPAN: OSTEOSARCOMA MARKET FOR TREATMENT, BY TYPE, 2020–2027 (USD MILLION) 108
      183. TABLE 182 JAPAN: OSTEOSARCOMA MARKET FOR CHEMOTHERAPY, BY TYPE, 2020–2027 (USD MILLION) 108
      184. TABLE 183 JAPAN: OSTEOSARCOMA MARKET FOR SURGERY, BY TYPE, 2020–2027 (USD MILLION) 108
      185. TABLE 184 JAPAN: OSTEOSARCOMA MARKET FOR DIAGNOSIS, BY TYPE 2020–2027 (USD MILLION) 109
      186. TABLE 185 JAPAN: OSTEOSARCOMA MARKET FOR IMAGING, BY TYPE 2020–2027 (USD MILLION) 109
      187. TABLE 186 JAPAN: OSTEOSARCOMA MARKET FOR BIOPSIES, BY TYPE 2020–2027 (USD MILLION) 109
      188. TABLE 187 JAPAN: OSTEOSARCOMA MARKET FOR BLOOD TESTS, BY TYPE 2020–2027 (USD MILLION) 110
      189. TABLE 188 JAPAN: OSTEOSARCOMA MARKET, BY END USER, 2020–2027 (USD MILLION) 110
      190. TABLE 189 CHINA: OSTEOSARCOMA MARKET, BY TYPE, 2020–2027 (USD MILLION) 110
      191. TABLE 190 CHINA: OSTEOSARCOMA MARKET, BY DIAGNOSIS & TREATMENT 2020–2027 (USD MILLION) 111
      192. TABLE 191 CHINA: OSTEOSARCOMA MARKET FOR TREATMENT, BY TYPE, 2020–2027 (USD MILLION) 111
      193. TABLE 192 CHINA: OSTEOSARCOMA MARKET FOR CHEMOTHERAPY, BY TYPE, 2020–2027 (USD MILLION) 111
      194. TABLE 193 CHINA: OSTEOSARCOMA MARKET FOR SURGERY, BY TYPE, 2020–2027 (USD MILLION) 111
      195. TABLE 194 CHINA: OSTEOSARCOMA MARKET FOR DIAGNOSIS, BY TYPE 2020–2027 (USD MILLION) 112
      196. TABLE 195 CHINA: OSTEOSARCOMA MARKET FOR IMAGING, BY TYPE 2020–2027 (USD MILLION) 112
      197. TABLE 196 CHINA: OSTEOSARCOMA MARKET FOR BIOPSIES, BY TYPE 2020–2027 (USD MILLION) 112
      198. TABLE 197 CHINA: OSTEOSARCOMA MARKET FOR BLOOD TESTS, BY TYPE 2020–2027 (USD MILLION) 113
      199. TABLE 198 CHINA: OSTEOSARCOMA MARKET, BY END USER, 2020–2027 (USD MILLION) 113
      200. TABLE 199 INDIA: OSTEOSARCOMA MARKET, BY TYPE, 2020–2027 (USD MILLION) 113
      201. TABLE 200 INDIA: OSTEOSARCOMA MARKET, BY DIAGNOSIS & TREATMENT 2020–2027 (USD MILLION) 114
      202. TABLE 201 INDIA: OSTEOSARCOMA MARKET FOR TREATMENT, BY TYPE, 2020–2027 (USD MILLION) 114
      203. TABLE 202 INDIA: OSTEOSARCOMA MARKET FOR CHEMOTHERAPY, BY TYPE, 2020–2027 (USD MILLION) 114
      204. TABLE 203 INDIA: OSTEOSARCOMA MARKET FOR SURGERY, BY TYPE, 2020–2027 (USD MILLION) 114
      205. TABLE 204 INDIA: OSTEOSARCOMA MARKET FOR DIAGNOSIS, BY TYPE 2020–2027 (USD MILLION) 115
      206. TABLE 205 INDIA: OSTEOSARCOMA MARKET FOR IMAGING, BY TYPE 2020–2027 (USD MILLION) 115
      207. TABLE 206 INDIA: OSTEOSARCOMA MARKET FOR BIOPSIES, BY TYPE 2020–2027 (USD MILLION) 115
      208. TABLE 207 INDIA: OSTEOSARCOMA MARKET FOR BLOOD TESTS, BY TYPE 2020–2027 (USD MILLION) 116
      209. TABLE 208 INDIA: OSTEOSARCOMA MARKET, BY END USER, 2020–2027 (USD MILLION) 116
      210. TABLE 209 SOUTH KOREA: OSTEOSARCOMA MARKET, BY TYPE, 2020–2027 (USD MILLION) 116
      211. TABLE 210 SOUTH KOREA: OSTEOSARCOMA MARKET, BY DIAGNOSIS & TREATMENT 2020–2027 (USD MILLION) 117
      212. TABLE 211 SOUTH KOREA: OSTEOSARCOMA MARKET FOR TREATMENT, BY TYPE, 2020–2027 (USD MILLION) 117
      213. TABLE 212 SOUTH KOREA: OSTEOSARCOMA MARKET FOR CHEMOTHERAPY, BY TYPE, 2020–2027 (USD MILLION) 117
      214. TABLE 213 SOUTH KOREA: OSTEOSARCOMA MARKET FOR SURGERY, BY TYPE, 2020–2027 (USD MILLION) 117
      215. TABLE 214 SOUTH KOREA: OSTEOSARCOMA MARKET FOR DIAGNOSIS, BY TYPE 2020–2027 (USD MILLION) 118
      216. TABLE 215 SOUTH KOREA: OSTEOSARCOMA MARKET FOR IMAGING, BY TYPE 2020–2027 (USD MILLION) 118
      217. TABLE 216 SOUTH KOREA: OSTEOSARCOMA MARKET FOR BIOPSIES, BY TYPE 2020–2027 (USD MILLION) 118

    Osteosarcoma Market Segmentation

    Market Segmentation Overview

    • Detailed segmentation data will be available in the full report
    • Comprehensive analysis by multiple parameters
    • Regional and country-level breakdowns
    • Market size forecasts by segment
    Infographic

    Free Sample Request

    Kindly complete the form below to receive a free sample of this Report

    Get Free Sample

    Customer Strories

    “I am very pleased with how market segments have been defined in a relevant way for my purposes (such as "Portable Freezers & refrigerators" and "last-mile"). In general the report is well structured. Thanks very much for your efforts.”

    Victoria Milne

    Founder
    Case Study
    Chemicals and Materials