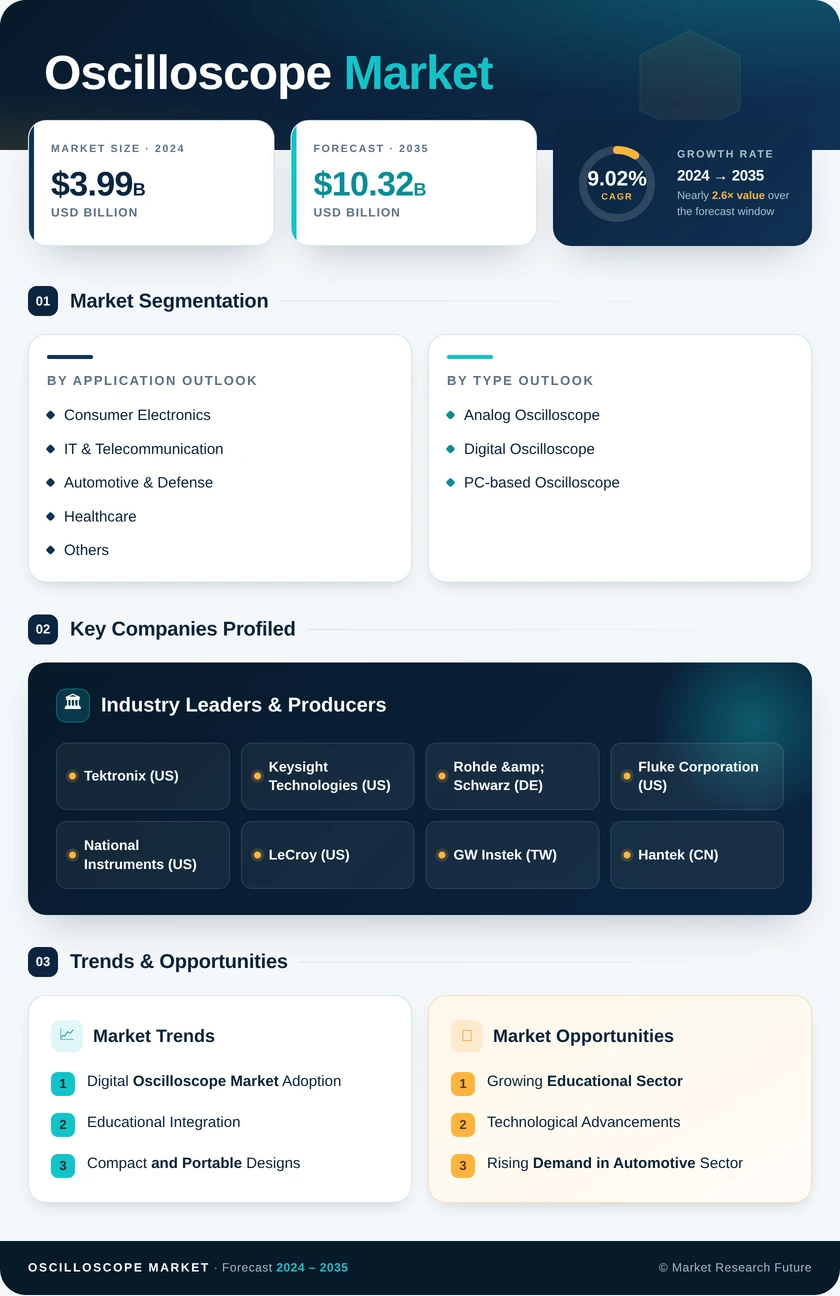
Oscilloscope Market (2026 - 2035)

Oscilloscope Market Size, Share and Research Report By Component (Hardware, Software, Services), By Type (Analog, Digital/Mixed-Signal, PC-Based/USB, Handheld/Portable), By Bandwidth (≤500 MHz, 500 MHz–1 GHz, 1 GHz–4 GHz, >4 GHz), By End-User Industry (Automotive and Transportation, IT and Telecommunications, Consumer Electronics, Industrial and Energy, Aerospace and Defence, Education and Research, Healthcare and Others), By Sales Channel (Direct, Distributors and VARs, Online/E-commerce) and By Region (North America, Europe, Asia-Pacific, South America, Middle East & Africa) – Industry Forecast to 2035

Forecast Period
2026-2035
CAGR
8.3%
2025 Market Size
USD 4.00 Billion
2035 Market Size
USD 8.83 Billion
Test and Measurement ● Updated August 2026 Report ID: MRFR/SEM/1341-CR | Pages: 110 | Author: Nirmit Biswas, Aarti Dhapte
  1. 1 Market Overview |
    1. 1.1 Study Assumptions & Market Definition |
    2. 1.2 Scope of the Study |
    3. 1.3 Research Methodology
  2. 2 Market Summary & Key Takeaways |
    1. 2.1 By Technology |
    2. 2.2 By Sector |
    3. 2.3 By Geography
  3. 3 Market Size & Forecast (2021–2035) |
    1. 3.1 Historical Market Size (2021–2025) |
    2. 3.2 Current & Forecast Market Size (2026–2035) |
    3. 3.3 Year-over-Year Growth Analysis
  4. 4 Driver Impact Analysis |
    1. 4.1 Electric Vehicle Powertrain Validation |
    2. 4.2 Communications Infrastructure and Spectrum Expansion |
    3. 4.3 Semiconductor Manufacturing Capacity |
    4. 4.4 Software-Defined Instrument Licensing
  5. 5 Restraints Impact Analysis |
    1. 5.1 Converter and Component Supply Constraints |
    2. 5.2 Capital Intensity and Budget Access |
    3. 5.3 Export Control Friction
  6. 6 Opportunity Analysis |
    1. 6.1 Cloud-Connected Measurement and Remote Debug |
    2. 6.2 India and ASEAN Capacity Localisation |
    3. 6.3 Wide-Bandgap Power Measurement |
    4. 6.4 Measurement Data Monetisation |
    5. 6.5 Education and Workforce Pipelines
  7. 7 Regional Market Share & Country-Level Analysis |
    1. 7.1 North America | |
      1. 7.1.1 US | |
      2. 7.1.2 Canada | |
      3. 7.1.3 Mexico |
    2. 7.2 Europe | |
      1. 7.2.1 Germany | |
      2. 7.2.2 UK | |
      3. 7.2.3 France | |
      4. 7.2.4 Italy | |
      5. 7.2.5 Spain | |
      6. 7.2.6 Nordic Countries | |
      7. 7.2.7 Russia | |
      8. 7.2.8 Rest of Europe |
    3. 7.3 Asia-Pacific | |
      1. 7.3.1 China | |
      2. 7.3.2 India | |
      3. 7.3.3 Japan | |
      4. 7.3.4 South Korea | |
      5. 7.3.5 ASEAN | |
      6. 7.3.6 Rest of Asia-Pacific |
    4. 7.4 South America | |
      1. 7.4.1 Brazil | |
      2. 7.4.2 Argentina | |
      3. 7.4.3 Rest of South America |
    5. 7.5 Middle East & Africa | |
      1. 7.5.1 Saudi Arabia | |
      2. 7.5.2 UAE | |
      3. 7.5.3 South Africa | |
      4. 7.5.4 Egypt | |
      5. 7.5.5 Rest of Middle East & Africa
  8. 8 Future Outlook (2026–2035) |
    1. 8.1 Autonomous Debug and Machine-Assisted Analysis |
    2. 8.2 Platform Economics and Recurring Revenue |
    3. 8.3 Electrification Supercycle |
    4. 8.4 Sustainability and Instrument Lifecycle Reporting
  9. 9 Market Segmentation Analysis |
    1. 9.1 By Component | |
      1. 9.1.1 Hardware | |
      2. 9.1.2 Software | |
      3. 9.1.3 Services |
    2. 9.2 By Type | |
      1. 9.2.1 Analog | |
      2. 9.2.2 Digital/Mixed-Signal | |
      3. 9.2.3 PC-Based/USB | |
      4. 9.2.4 Handheld/Portable |
    3. 9.3 By Bandwidth | |
      1. 9.3.1 ≤500 MHz | |
      2. 9.3.2 500 MHz–1 GHz | |
      3. 9.3.3 1 GHz–4 GHz | |
      4. 9.3.4 >4 GHz |
    4. 9.4 By End-User Industry | |
      1. 9.4.1 Automotive and Transportation | |
      2. 9.4.2 IT and Telecommunications | |
      3. 9.4.3 Consumer Electronics | |
      4. 9.4.4 Industrial and Energy | |
      5. 9.4.5 Aerospace and Defence | |
      6. 9.4.6 Education and Research | |
      7. 9.4.7 Healthcare and Others |
    5. 9.5 By Sales Channel | |
      1. 9.5.1 Direct | |
      2. 9.5.2 Distributors and VARs | |
      3. 9.5.3 Online/E-commerce
  10. 10 Competitive Landscape |
    1. 10.1 Market Concentration Analysis (2026) |
    2. 10.2 Competitive Benchmarking Matrix |
    3. 10.3 Company Profiles | |
      1. 10.3.1 Keysight Technologies | |
      2. 10.3.2 Tektronix (Fortive) | |
      3. 10.3.3 Rohde & Schwarz | |
      4. 10.3.4 Teledyne LeCroy | |
      5. 10.3.5 Yokogawa Test & Measurement | |
      6. 10.3.6 RIGOL Technologies | |
      7. 10.3.7 Siglent Technologies | |
      8. 10.3.8 National Instruments (Emerson) | |
      9. 10.3.9 Fluke Corporation | |
      10. 10.3.10 GW Instek | |
      11. 10.3.11 Pico Technology | |
      12. 10.3.12 B&K Precision
  11. 11 Recent News & Developments
  12. 12 Report Scope & Methodology |
    1. 12.1 Study Period & Base Year |
    2. 12.2 Valuation Currency & Assumptions |
    3. 12.3 Abbreviations
  13. 13 Detailed Sources & Citations
  14. 14 Frequently Asked Questions
  15. 15 LIST OF TABLES |
  16. TABLE 1 Global Oscilloscope Market Size & Forecast, by Revenue (USD Billion), 2021–2035 |
  17. TABLE 2 Global Oscilloscope Market – Year-over-Year Growth Analysis, 2021–2035 |
  18. TABLE 3 Driver Impact Analysis Matrix, 2026–2035 |
  19. TABLE 4 Restraint Impact Analysis Matrix, 2026–2035 |
  20. TABLE 5 Global Oscilloscope Market Size, by Region, 2021–2035 (USD Billion) |
  21. TABLE 6 North America Oscilloscope Market Size, by Country, 2021–2035 (USD Billion) |
  22. TABLE 7 Europe Oscilloscope Market Size, by Country, 2021–2035 (USD Billion) |
  23. TABLE 8 Asia-Pacific Oscilloscope Market Size, by Country, 2021–2035 (USD Billion) |
  24. TABLE 9 South America Oscilloscope Market Size, by Country, 2021–2035 (USD Billion) |
  25. TABLE 10 Middle East & Africa Oscilloscope Market Size, by Country, 2021–2035 (USD Billion) |
  26. TABLE 11 Global Oscilloscope Market Size, by Component, 2021–2035 (USD Billion) |
  27. TABLE 12 Global Oscilloscope Market Size, by Type, 2021–2035 (USD Billion) |
  28. TABLE 13 Global Oscilloscope Market Size, by Bandwidth, 2021–2035 (USD Billion) |
  29. TABLE 14 Global Oscilloscope Market Size, by End-User Industry, 2021–2035 (USD Billion) |
  30. TABLE 15 Global Oscilloscope Market Size, by Sales Channel, 2021–2035 (USD Billion) |
  31. TABLE 16 North America Oscilloscope Market Size, by Component and Type, 2021–2035 (USD Billion) |
  32. TABLE 17 Europe Oscilloscope Market Size, by Bandwidth and End-User Industry, 2021–2035 (USD Billion) |
  33. TABLE 18 Asia-Pacific Oscilloscope Market Size, by Component and Bandwidth, 2021–2035 (USD Billion) |
  34. TABLE 19 South America Oscilloscope Market Size, by Type and End-User Industry, 2021–2035 (USD Billion) |
  35. TABLE 20 Middle East & Africa Oscilloscope Market Size, by Component and Sales Channel, 2021–2035 (USD Billion) |
  36. TABLE 21 Competitive Benchmarking Matrix – Global Oscilloscope Market, 2026 |
  37. TABLE 22 Company Profiles – Key Players, Global Oscilloscope Market |
  38. TABLE 23 Recent Developments & Strategic Announcements, 2023–2025 |
  39. TABLE 24 Report Scope & Methodology Summary |
  40. TABLE 25 Detailed Sources & Citations Index
  41. 16 LIST OF FIGURES |
  42. FIGURE 1 Global Oscilloscope Market Dynamics – Drivers, Restraints and Opportunities |
  43. FIGURE 2 Industry Value Chain Analysis |
  44. FIGURE 3 Porter's Five Forces Analysis |
  45. FIGURE 4 Global Market Size Trend & Forecast, 2021–2035 (USD Billion) |
  46. FIGURE 5 Year-over-Year Growth Trajectory, 2022–2035 |
  47. FIGURE 6 Market Share by Component, 2025 vs 2035 |
  48. FIGURE 7 Market Share by Type, 2025 vs 2035 |
  49. FIGURE 8 Market Share by Bandwidth, 2025 vs 2035 |
  50. FIGURE 9 Market Share by End-User Industry, 2025 |
  51. FIGURE 10 Market Share by Sales Channel, 2025 |
  52. FIGURE 11 Regional Revenue Share Distribution, 2025 |
  53. FIGURE 12 Regional CAGR Comparison, 2026–2035 |
  54. FIGURE 13 Country-Level Growth Heat Map, 2026–2035 |
  55. FIGURE 14 Competitive Landscape – Estimated Revenue Share Positioning, 2026 |
  56. FIGURE 15 Vendor Capability Quadrant – Bandwidth Leadership vs Software Ecosystem Depth
Share::
Request Free Sample

Segmentation Quick Reference

DimensionSub-SegmentsDominant SegmentFastest Growing Segment
By ComponentHardware; Software; ServicesHardwareServices
By TypeAnalog; Digital/Mixed-Signal; PC-Based/USB; Handheld/PortableDigital/Mixed-SignalPC-Based/USB
By Bandwidth≤500 MHz; 500 MHz–1 GHz; 1 GHz–4 GHz; >4 GHz1 GHz–4 GHz>4 GHz
By End-User IndustryAutomotive and Transportation; IT and Telecommunications; Consumer Electronics; Industrial and Energy; Aerospace and Defence; Education and Research; Healthcare and OthersAutomotive and TransportationIT and Telecommunications
By Sales ChannelDirect; Distributors and VARs; Online/E-commerceDirectOnline/E-commerce
By GeographyNorth America; Europe; Asia-Pacific; South America; Middle East & AfricaAsia-PacificAsia-Pacific


Market Segmentation Overview

By Component

Sub-SegmentKey Trend
HardwareUpgradeable chassis architectures decouple bandwidth from purchase decisions.
SoftwareProtocol decode and compliance suites shift toward annual licence models.
ServicesAccredited calibration capacity tightens as installed base outgrows lab supply.


Component economics are rebalancing. Hardware remains the visible line item, yet the value migrating into licences and service contracts is what stabilises vendor revenue across the cycle.

By Type

Sub-SegmentKey Trend
AnalogRetained in teaching labs and field maintenance where simplicity outweighs features
Digital/Mixed-SignalStandard tool for embedded designs combining analog rails with logic buses
PC-Based/USBAdopted for dense channel counts in automated production test
Handheld/PortableBattery-powered isolation channels serve utility and automotive service fleets.


While analog systems continue to be used in field maintenance and teaching laboratories where simplicity is valued, digital/mixed-signal systems continue to be the norm for embedded designs that integrate analog rails with logic buses. Because of their dense channel capacity, PC-based/USB systems are becoming more popular in automated production testing, while portable and handheld systems with battery-powered isolation channels are used by utility and car fleets.


By Bandwidth

Sub-SegmentKey Trend
≤500 MHzVolume tier anchored by education and general embedded work
500 MHz–1 GHzAutomotive bus and industrial control validation sweet spot
1 GHz–4 GHzCommercial centre of gravity for mainstream compliance testing
>4 GHzFastest expansion as interconnect lane rates double every few years


Bandwidth demand is bifurcating. Entry tiers compete almost entirely on price and channel availability, while the premium band competes on jitter floor, noise performance, and standards coverage.

By End-User Industry

Sub-SegmentKey Trend
Automotive and TransportationZonal architectures and 800V platforms multiply validation stations
IT and TelecommunicationsOptical and electrical interconnect upgrades drive premium purchases.
Consumer ElectronicsFast-charging and wearable display interfaces sustain mid-tier demand.
Industrial and EnergyMotor drives and grid inverters require high-voltage differential probing.
Aerospace and DefenceWideband radar and electronic warfare programmes favour top-tier instruments.
Education and ResearchInstitutional procurement cycles favour bundled curriculum offerings.
Healthcare and OthersDevice certification and imaging electronics create steady replacement demand.


End-user concentration is loosening. Automotive still leads, but telecommunications growth means the revenue gap between the top two industries narrows materially before 2035.

By Sales Channel

Sub-SegmentKey Trend
DirectEnterprise agreements bundle instruments, software, and calibration
Distributors and VARsLocal service coverage decides mid-market and emerging-economy tenders.
Online/E-commerceEntry-tier and PC-based instruments migrate to self-service purchasing.


Channel strategy increasingly mirrors price tier. Premium configurations stay with direct account teams, while transactional volume moves online without meaningful margin loss.

By Region

Sub-SegmentKey Trend
North AmericaDefence and hyperscale interconnect programmes sustain premium demand
EuropeChips Act pilot lines and automotive compliance rules drive replacement.
Asia-PacificFab capacity and EV supply chains make it both largest and fastest-growing
South AmericaTelecom modernisation and R&D tax incentives support mid-tier purchases.
Middle East & AfricaIndustrial localisation programmes create new institutional demand.


Geography follows manufacturing. Regions adding fabrication, assembly, or radio design capacity add benches within the same capital cycle, which is why Asia-Pacific compounds faster than any peer.




Share::
Request Free Sample
Download PDF ×

We do not share your information with anyone. However, we may send you emails based on your report interest from time to time. You may contact us at any time to opt-out.