ID: MRFR/F-B & N/1830-HCR | February 2021 | Region: Global | 90 pages
Market Scenario:
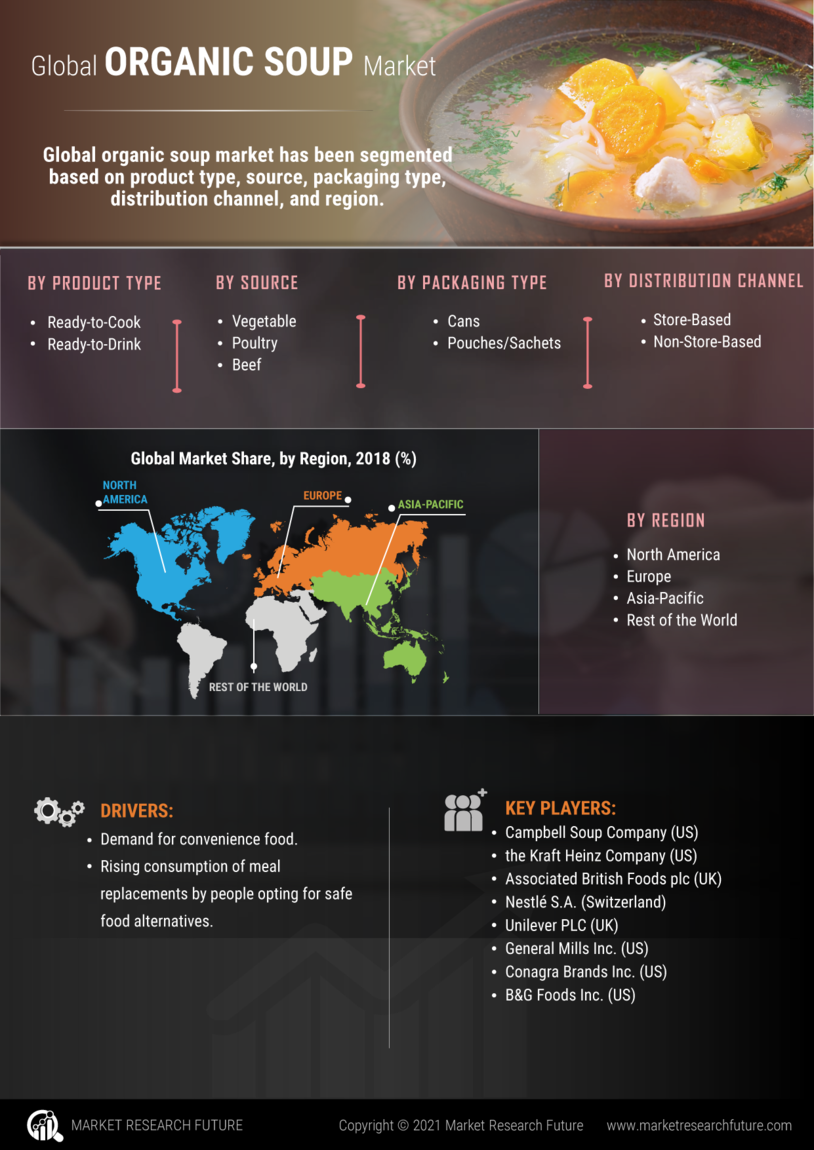
Demand for convenience food and rising consumption of meal replacements by people opting for safe food alternatives are expected to boost the global organic soup market during the forecast period. Organic soups are manufactured using organically grown ingredients and processed without the use of synthetic additives, thereby making them a safer alternative to regular soups.
The global market for organic soup is expected to grow substantially during the forecast period due to several health benefits, such as lowered risk of allergies and chronic diseases. Consumption of Genetically Modified (GM) ingredients in soup lead to numerous health issues, including food poisoning and digestive disorders. Therefore, these factors are expected to drive consumers towards organic soup during the assessment period. Moreover, urbanization and changing lifestyle trends have motivated people to switch to the adoption of convenience foods, ready-to-drink, and wholesome meal options, thus, influencing the demand for organic soups among consumers, worldwide.
Segmentation:
The global organic soup market has been segmented based on product type, source, packaging type, distribution channel, and region.
By product type, the global organic soup market has been classified as frozen, ready-to-cook, ready-to-drink, and others.
On the basis of source, the global organic soup market has been divided into vegetables, poultry, beef, seafood, and others.
Cans, pouches/sachets, and others are classified under packaging type segment for global organic soup market.
The global organic soup market has also been divided, on the basis of distribution channel, into store-based and non-store-based. The store-based segment has been further classified as supermarkets and hypermarkets, convenience stores, and others.
The global organic soup market has been studied for four regions—North America, Europe, Asia-Pacific, and the rest of the World.
The North American organic soup market has further been segmented into the US, Canada, and Mexico. The European organic soup market has been classified into the UK, Germany, France, Italy, Spain, and the rest of Europe. The organic soup market in Asia-Pacific has been divided into China, India, Japan, Australia and New Zealand, and the rest of Asia-Pacific. The organic soup market in the rest of the World has been segmented into South America, the Middle East, and Africa.
Key Players:
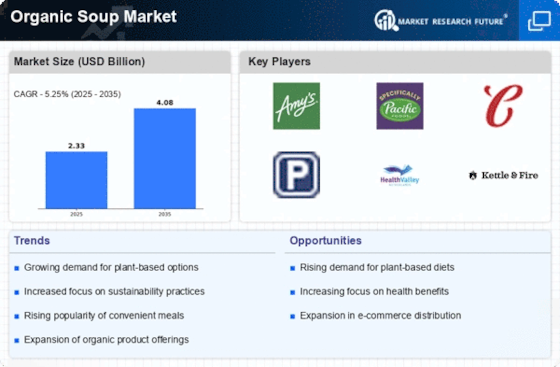
Campbell Soup Company (US), the Kraft Heinz Company (US), Associated British Foods plc (UK), Nestlé S.A. (Switzerland), Unilever PLC (UK), General Mills, Inc. (US), Conagra Brands, Inc. (US), and B&G Foods, Inc. (US) are some of the key players in the global organic soup market.
Regional Market Summary
Global Organic Soup Market Share (%), by Region, 2017
Source: Secondary Sources and MRFR Analysis
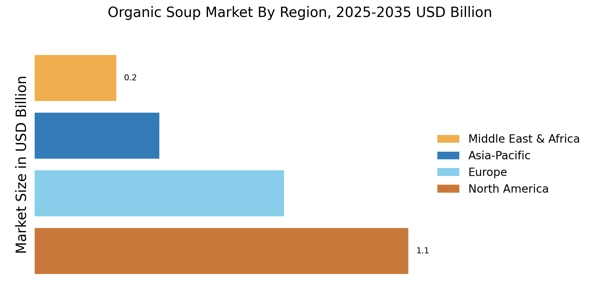
The organic soup market in Europe is expected to be the largest during the forecast period due to changing consumer preferences towards organic food products, from conventionally produced foods. Growing importance of health and wellness among the consumers, especially in Germany, the UK, and Russia, is expected to boost the regional growth of the organic soup market during the forecast period. The North American market for organic soups is expected to witness a steady growth during the forecast period owing to the changing lifestyle and increasing consumption of convenience food due to busy schedules. Increasing health concerns regarding the intake of artificial and synthetic additives used in the processing of soups and preference for natural additives are expected to drive consumer inclination towards safer food alternatives as compared to conventional food.
Asia-Pacific is expected to be the fastest-growing market for organic soup during the review period due to a change in consumer preference for organic food over conventionally processed food.
The organic soup market in the rest of the world is expected to witness a significant growth due to growing inclination for organic food and growing awareness about its associated health benefits. Food manufacturers in the region are introducing new and innovative organic soups with several flavor blends. Moreover, liberalization of foreign direct investments in the region is expected to offer an opportunity to players in the regional market during the forecast period.
Intended Audience
Global Organic Soup Market, by Product Type
Global Organic Soup Market, by Source
Global Organic Soup Market, by Packaging Type
Global Organic Soup Market, by Distribution Channel
Global Organic Soup Market, by Region
TABLE OF CONTENTS
1 Executive Summary
2 Scope of the Report
2.1 Market Definition
2.2 Scope of the Study
2.2.1 Research Objectives
2.2.2 Assumptions & Limitations
2.3 Market Structure
3 Market Research Methodology
3.1 Research Process
3.2 Secondary Research
3.3 Primary Research
3.4 Forecast Model
4 Market Landscape
4.1 Supply Chain Analysis
4.1.1 Raw Material Suppliers
4.1.2 Manufacturers/Producers
4.1.3 Distributors/Retailers/Wholesalers/E-Commerce
4.1.4 End Users
4.2 Porter’s Five Forces Analysis
4.2.1 Threat of New Entrants
4.2.2 Bargaining Power of Buyers
4.2.3 Bargaining Power of Suppliers
4.2.4 Threat of Substitutes
4.2.5 Internal Rivalry
5 Market Dynamics of Global Organic Soup Market
5.1 Introduction
5.2 Drivers
5.3 Restraints
5.4 Opportunities
5.5 Challenges
6. Global Organic Soup Market, by Product Type
6.1 Introduction
6.2 Frozen
6.2.1 Market Estimates & Forecast, 2018–2023
6.2.2 Market Estimates & Forecast, by Region, 2018–2023
6.3 Ready-to-Cook
6.3.1 Market Estimates & Forecast, 2018–2023
6.3.2 Market Estimates & Forecast, by Region, 2018–2023
6.4 Ready-to-Drink
6.4.1 Market Estimates & Forecast, 2018–2023
6.4.2 Market Estimates & Forecast, by Region, 2018–2023
6.5 Others
6.5.1 Market Estimates & Forecast, 2018–2023
6.5.2 Market Estimates & Forecast, by Region, 2018–2023
7. Global Organic Soup Market, by Source
7.1 Introduction
7.2 Vegetable
7.2.1 Market Estimates & Forecast, 2018–2023
7.2.2 Market Estimates & Forecast, by Region, 2018–2023
7.3 Poultry
7.3.1 Market Estimates & Forecast, 2018–2023
7.3.2 Market Estimates & Forecast, by Region, 2018–2023
7.4 Beef
7.4.1 Market Estimates & Forecast, 2018–2023
7.4.2 Market Estimates & Forecast, by Region, 2018–2023
7.5 Seafood
7.5.1 Market Estimates & Forecast, 2018–2023
7.5.2 Market Estimates & Forecast, by Region, 2018–2023
7.6 Others
7.6.1 Market Estimates & Forecast, 2018–2023
7.6.2 Market Estimates & Forecast, by Region, 2018–2023
8. Global Organic Soup Market, by Packaging Type
8.1 Introduction
8.2 Cans
8.2.1 Market Estimates & Forecast, 2018–2023
8.2.2 Market Estimates & Forecast, by Region, 2018–2023
8.3 Pouches/Sachets
8.3.1 Market Estimates & Forecast, 2018–2023
8.3.2 Market Estimates & Forecast, by Region, 2018–2023
8.4 Others
8.4.1 Market Estimates & Forecast, 2018–2023
8.4.2 Market Estimates & Forecast, by Region, 2018–2023
9. Global Organic Soup Market, by Distribution Channel
9.1 Introduction
9.2 Store-Based
9.2.1 Market Estimates & Forecast, 2018–2023
9.2.2 Market Estimates & Forecast, by Region, 2018–2023
9.2.3 Supermarkets & Hypermarkets
9.2.3.1 Market Estimates & Forecast, 2018–2023
9.2.3.2 Market Estimates & Forecast, by Region, 2018–2023
9.2.4 Convenience Stores
9.2.4.1 Market Estimates & Forecast, 2018–2023
9.2.4.2 Market Estimates & Forecast, by Region, 2018–2023
9.2.5 Others
9.2.5.1 Market Estimates & Forecast, 2018–2023
9.2.5.2 Market Estimates & Forecast, by Region, 2018–2023
9.3 Non-Store-Based
9.3.1 Market Estimates & Forecast, 2018–2023
9.3.2 Market Estimates & Forecast, by Region, 2018–2023
10. Global Organic Soup Market, by Region
10.1 Introduction
10.2 North America
10.2.1 Market Estimates & Forecast, 2018–2023
10.2.2 Market Estimates & Forecast, by Product Type, 2018–2023
10.2.3 Market Estimates & Forecast, by Source, 2018–2023
10.2.4 Market Estimates & Forecast, by Packaging Type, 2018–2023
10.2.5 Market Estimates & Forecast, by Distribution Channel, 2018–2023
10.2.6 US
10.2.6.1 Market Estimates & Forecast, 2018–2023
10.2.6.2 Market Estimates & Forecast, by Product Type, 2018–2023
10.2.6.3 Market Estimates & Forecast, by Source, 2018–2023
10.2.6.4 Market Estimates & Forecast, by Packaging Type, 2018–2023
10.2.6.5 Market Estimates & Forecast, by Distribution Channel, 2018–2023
10.2.7 Canada
10.2.7.1 Market Estimates & Forecast, 2018–2023
10.2.7.2 Market Estimates & Forecast, by Product Type, 2018–2023
10.2.7.3 Market Estimates & Forecast, by Source, 2018–2023
10.2.7.4 Market Estimates & Forecast, by Packaging Type, 2018–2023
10.2.7.5 Market Estimates & Forecast, by Distribution Channel, 2018–2023
10.2.8 Mexico
10.2.8.1 Market Estimates & Forecast, 2018–2023
10.2.8.2 Market Estimates & Forecast, by Product Type, 2018–2023
10.2.8.3 Market Estimates & Forecast, by Source, 2018–2023
10.2.8.4 Market Estimates & Forecast, by Packaging Type, 2018–2023
10.2.8.5 Market Estimates & Forecast, by Distribution Channel, 2018–2023
10.3 Europe
10.3.1 Market Estimates & Forecast, 2018–2023
10.3.2 Market Estimates & Forecast, by Product Type, 2018–2023
10.3.3 Market Estimates & Forecast, by Source, 2018–2023
10.3.4 Market Estimates & Forecast, by Packaging Type, 2018–2023
10.3.5 Market Estimates & Forecast, by Distribution Channel, 2018–2023
10.3.6 Germany
10.3.6.1 Market Estimates & Forecast, 2018–2023
10.3.6.2 Market Estimates & Forecast, by Product Type, 2018–2023
10.3.6.3 Market Estimates & Forecast, by Source, 2018–2023
10.3.6.4 Market Estimates & Forecast, by Packaging Type, 2018–2023
10.3.6.5 Market Estimates & Forecast, by Distribution Channel, 2018–2023
10.3.7 France
10.3.7.1 Market Estimates & Forecast, 2018–2023
10.3.7.2 Market Estimates & Forecast, by Product Type, 2018–2023
10.3.7.3 Market Estimates & Forecast, by Source, 2018–2023
10.3.7.4 Market Estimates & Forecast, by Packaging Type, 2018–2023
10.3.7.5 Market Estimates & Forecast, by Distribution Channel, 2018–2023
10.3.8 Italy
10.3.8.1 Market Estimates & Forecast, 2018–2023
10.3.8.2 Market Estimates & Forecast, by Product Type, 2018–2023
10.3.8.3 Market Estimates & Forecast, by Source, 2018–2023
10.3.8.4 Market Estimates & Forecast, by Packaging Type, 2018–2023
10.3.8.5 Market Estimates & Forecast, by Distribution Channel, 2018–2023
10.3.9 Spain
10.3.9.1 Market Estimates & Forecast, 2018–2023
10.3.9.2 Market Estimates & Forecast, by Product Type, 2018–2023
10.3.9.3 Market Estimates & Forecast, by Source, 2018–2023
10.3.9.4 Market Estimates & Forecast, by Packaging Type, 2018–2023
10.3.9.5 Market Estimates & Forecast, by Distribution Channel, 2018–2023
10.3.10 UK
10.3.9.1 Market Estimates & Forecast, 2018–2023
10.3.9.2 Market Estimates & Forecast, by Product Type, 2018–2023
10.3.9.3 Market Estimates & Forecast, by Source, 2018–2023
10.3.9.4 Market Estimates & Forecast, by Packaging Type, 2018–2023
10.3.9.5 Market Estimates & Forecast, by Distribution Channel, 2018–2023
10.3.11 Rest of Europe
10.3.11.1 Market Estimates & Forecast, 2018–2023
10.3.11.2 Market Estimates & Forecast, by Product Type, 2018–2023
10.3.11.3 Market Estimates & Forecast, by Source, 2018–2023
10.3.11.4 Market Estimates & Forecast, by Packaging Type, 2018–2023
10.3.11.5 Market Estimates & Forecast, by Distribution Channel, 2018–2023
10.4 Asia-Pacific
10.4.1 Market Estimates & Forecast, 2018–2023
10.4.2 Market Estimates & Forecast, by Product Type, 2018–2023
10.4.3 Market Estimates & Forecast, by Source, 2018–2023
10.4.4 Market Estimates & Forecast, by Packaging Type, 2018–2023
10.4.5 Market Estimates & Forecast, by Distribution Channel, 2018–2023
10.4.6 China
10.4.6.1 Market Estimates & Forecast, 2018–2023
10.4.6.2 Market Estimates & Forecast, by Product Type, 2018–2023
10.4.6.3 Market Estimates & Forecast, by Source, 2018–2023
10.4.6.4 Market Estimates & Forecast, by Packaging Type, 2018–2023
10.4.6.4 Market Estimates & Forecast, by Distribution Channel, 2018–2023
10.4.6 India
10.4.6.1 Market Estimates & Forecast, 2018–2023
10.4.6.2 Market Estimates & Forecast, by Product Type, 2018–2023
10.4.6.3 Market Estimates & Forecast, by Source, 2018–2023
10.4.6.4 Market Estimates & Forecast, by Packaging Type, 2018–2023
10.4.6.5 Market Estimates & Forecast, by Distribution Channel, 2018–2023
10.4.7 Japan
10.4.7.1 Market Estimates & Forecast, 2018–2023
10.4.7.2 Market Estimates & Forecast, by Product Type, 2018–2023
10.4.7.3 Market Estimates & Forecast, by Source, 2018–2023
10.4.7.4 Market Estimates & Forecast, by Packaging Type, 2018–2023
10.4.7.5 Market Estimates & Forecast, by Distribution Channel, 2018–2023
10.4.8 Australia & New Zealand
10.4.8.1 Market Estimates & Forecast, 2018–2023
10.4.8.2 Market Estimates & Forecast, by Product Type, 2018–2023
10.4.8.3 Market Estimates & Forecast, by Source, 2018–2023
10.4.8.4 Market Estimates & Forecast, by Packaging Type, 2018–2023
10.4.8.5 Market Estimates & Forecast, by Distribution Channel, 2018–2023
10.4.9 Rest of Asia-Pacific
10.4.9.1 Market Estimates & Forecast, 2018–2023
10.4.9.2 Market Estimates & Forecast, by Product Type, 2018–2023
10.4.9.3 Market Estimates & Forecast, by Source, 2018–2023
10.4.9.4 Market Estimates & Forecast, by Packaging Type, 2018–2023
10.4.9.5 Market Estimates & Forecast, by Distribution Channel, 2018–2023
10.5 Rest of the World (RoW)
10.5.1 Market Estimates & Forecast, 2018–2023
10.5.2 Market Estimates & Forecast, by Product Type, 2018–2023
10.5.3 Market Estimates & Forecast, by Source, 2018–2023
10.5.4 Market Estimates & Forecast, by Packaging Type, 2018–2023
10.5.5 Market Estimates & Forecast, by Distribution Channel, 2018–2023
10.5.6 South America
10.5.5.1 Market Estimates & Forecast, 2018–2023
10.5.5.2 Market Estimates & Forecast, by Product Type, 2018–2023
10.5.5.3 Market Estimates & Forecast, by Source, 2018–2023
10.5.5.4 Market Estimates & Forecast, by Packaging Type, 2018–2023
10.5.5.5 Market Estimates & Forecast, by Distribution Channel, 2018–2023
10.5.6 Middle East
10.5.6.1 Market Estimates & Forecast, 2018–2023
10.5.6.2 Market Estimates & Forecast, by Product Type, 2018–2023
10.5.6.3 Market Estimates & Forecast, by Source, 2018–2023
10.5.6.4 Market Estimates & Forecast, by Packaging Type, 2018–2023
10.5.6.5 Market Estimates & Forecast, by Distribution Channel, 2018–2023
10.5.7 Africa
10.5.7.1 Market Estimates & Forecast, 2018–2023
10.5.7.2 Market Estimates & Forecast, by Product Type, 2018–2023
10.5.7.3 Market Estimates & Forecast, by Source, 2018–2023
10.5.7.4 Market Estimates & Forecast, by Packaging Type, 2018–2023
10.5.7.5 Market Estimates & Forecast, by Distribution Channel, 2018–2023
11. Company Landscape
11.1 Introduction
11.2 Market Strategy
11.3 Key Development Analysis
(Expansions/ Mergers and Acquisitions/ Joint Ventures/ New Product Developments/ Agreements/ Investments
12. Company Profiles
12.1 Campbell Soup Company
11.1.1 Company Overview
12.1.2 Financial Updates
12.1.3 Product/Business Segment Overview
12.1.4 Strategy
12.1.5 Key Developments
12.1.6 SWOT Analysis
12.2 The Kraft Heinz Company
12.2.1 Company Overview
12.2.2 Financial Updates
12.2.3 Product/Business Segment Overview
12.2.4 Strategy
12.2.5 Key Developments
12.2.6 SWOT Analysis
12.3 Associated British Foods plc
12.3.1 Company Overview
12.3.2 Financial Updates
12.3.3 Product/Business Segment Overview
12.3.4 Strategy
12.3.5 Key Developments
12.3.6 SWOT Analysis
12.4 Nestlé S.A.
12.4.1 Company Overview
12.4.2 Financial Updates
12.4.3 Product/Business Segment Overview
12.4.4 Strategy
12.4.5 Key Developments
12.4.6 SWOT Analysis
12.5 Unilever PLC
12.5.1 Company Overview
12.5.2 Financial Updates
12.5.3 Product/Business Segment Overview
12.5.4 Strategy
12.5.5 Key Developments
12.5.6 SWOT Analysis
12.6 General Mills, Inc.
12.6.1 Company Overview
12.6.2 Financial Updates
12.6.3 Product/Business Segment Overview
12.6.4 Strategy
12.6.5 Key Developments
12.6.6 SWOT Analysis
12.7 Conagra Brands, Inc.
12.7.1 Company Overview
12.7.2 Financial Updates
12.7.3 Product/Business Segment Overview
12.7.4 Strategy
12.7.5 Key Developments
12.7.6 SWOT Analysis
12.8 B&G Foods, Inc.
12.8.1 Company Overview
12.8.2 Financial Updates
12.8.3 Product/Business Segment Overview
12.8.4 Strategy
12.8.5 Key Developments
12.8.6 SWOT Analysis
13. Conclusion
LIST OF TABLES
Table 1 Global Organic Soup Market, by Region, 2018–2023 (USD Million)
Table 2 Global Organic Soup Market, by Product Type, 2018–2023 (USD Million)
Table 3 Global Organic Soup Market, by Source,2018–2023 (USD Million)
Table 4 Global Organic Soup Market, by Packaging Type, 2018–2023 (USD Million)
Table 5 Global Organic Soup Market, by Distribution Channel, 2018–2023 (USD Million)
Table 6 North America: Organic Soup Market, by Country, 2018–2023 (USD Million)
Table 7 North America: Organic Soup Market, by Product Type, 2018–2023 (USD Million)
Table 8 North America: Organic Soup Market, by Source,2018–2023 (USD Million)
Table 9 North America: Organic Soup Market, by Packaging Type, 2018–2023 (USD Million)
Table 10 North America: Organic Soup Market, by Distribution Channel, 2018–2023 (USD Million)
Table 11 US: Organic Soup Market, by Product Type, 2018–2023 (USD Million)
Table 12 US: Organic Soup Market, by Source,2018–2023 (USD Million)
Table 13 US: Organic Soup Market, by Packaging Type, 2018–2023 (USD Million)
Table 14 US: Organic Soup Market, by Distribution Channel, 2018–2023 (USD Million)
Table 15 Canada: Organic Soup Market, by Product Type, 2018–2023 (USD Million)
Table 16 Canada: Organic Soup Market, by Source,2018–2023 (USD Million)
Table 17 Canada: Organic Soup Market, by Packaging Type, 2018–2023 (USD Million)
Table 18 Canada: Organic Soup Market, by Distribution Channel, 2018–2023 (USD Million)
Table 19 Mexico: Organic Soup Market, by Product Type, 2018–2023 (USD Million)
Table 20 Mexico: Organic Soup Market, by Source,2018–2023 (USD Million)
Table 21 Mexico: Organic Soup Market, by Packaging Type, 2018–2023 (USD Million)
Table 22 Mexico: Organic Soup Market, by Distribution Channel, 2018–2023 (USD Million)
Table 23 Europe: Organic Soup Market, by Country, 2018–2023 (USD Million)
Table 24 Europe: Organic Soup Market, by Product Type, 2018–2023 (USD Million)
Table 25 Europe: Organic Soup Market, by Source,2018–2023 (USD Million)
Table 26 Europe: Organic Soup Market, by Packaging Type, 2018–2023 (USD Million)
Table 27 Europe: Organic Soup Market, by Distribution Channel, 2018–2023 (USD Million)
Table 28 Germany: Organic Soup Market, by Product Type, 2018–2023 (USD Million)
Table 29 Germany: Organic Soup Market, by Source,2018–2023 (USD Million)
Table 30 Germany: Organic Soup Market, by Packaging Type, 2018–2023 (USD Million)
Table 31 Germany: Organic Soup Market, by Distribution Channel, 2018–2023 (USD Million)
Table 32 France: Organic Soup Market, by Product Type, 2018–2023 (USD Million)
Table 33 France: Organic Soup Market, by Source,2018–2023 (USD Million)
Table 34 France: Organic Soup Market, by Packaging Type, 2018–2023 (USD Million)
Table 35 France: Organic Soup Market, by Distribution Channel, 2018–2023 (USD Million)
Table 36 Italy: Organic Soup Market, by Product Type, 2018–2023 (USD Million)
Table 37 Italy: Organic Soup Market, by Source,2018–2023 (USD Million)
Table 38 Italy: Organic Soup Market, by Packaging Type, 2018–2023 (USD Million)
Table 39 Italy: Organic Soup Market, by Distribution Channel, 2018–2023 (USD Million)
Table 40 Spain: Organic Soup Market, by Product Type, 2018–2023 (USD Million)
Table 41 Spain: Organic Soup Market, by Source,2018–2023 (USD Million)
Table 42 Spain: Organic Soup Market, by Packaging Type, 2018–2023 (USD Million)
Table 43 Spain: Organic Soup Market, by Distribution Channel, 2018–2023 (USD Million)
Table 44 UK: Organic Soup Market, by Product Type, 2018–2023 (USD Million)
Table 45 UK: Organic Soup Market, by Source,2018–2023 (USD Million)
Table 46 UK: Organic Soup Market, by Packaging Type, 2018–2023 (USD Million)
Table 47 UK: Organic Soup Market, by Distribution Channel, 2018–2023 (USD Million)
Table 48 Rest of Europe: Organic Soup Market, by Product Type, 2018–2023 (USD Million)
Table 49 Rest of Europe: Organic Soup Market, by Source,2018–2023 (USD Million)
Table 50 Rest of Europe: Organic Soup Market, by Packaging Type, 2018–2023 (USD Million)
Table 51 Rest of Europe: Organic Soup Market, by Distribution Channel, 2018–2023 (USD Million)
Table 52 Asia-Pacific: Organic Soup Market, by Country, 2018–2023 (USD Million)
Table 53 Asia-Pacific: Organic Soup Market, by Product Type, 2018–2023 (USD Million)
Table 54 Asia-Pacific: Organic Soup Market, by Source,2018–2023 (USD Million)
Table 55 Asia-Pacific: Organic Soup Market, by Packaging Type, 2018–2023 (USD Million)
Table 56 Asia-Pacific: Organic Soup Market, by Distribution Channel, 2018–2023 (USD Million)
Table 57 China: Organic Soup Market, by Product Type, 2018–2023 (USD Million)
Table 58 China: Organic Soup Market, by Source,2018–2023 (USD Million)
Table 59 China: Organic Soup Market, by Packaging Type, 2018–2023 (USD Million)
Table 60 China: Organic Soup Market, by Distribution Channel, 2018–2023 (USD Million)
Table 61 India: Organic Soup Market, by Product Type, 2018–2023 (USD Million)
Table 62 India: Organic Soup Market, by Source,2018–2023 (USD Million)
Table 63 India: Organic Soup Market, by Packaging Type, 2018–2023 (USD Million)
Table 64 India: Organic Soup Market, by Distribution Channel, 2018–2023 (USD Million)
Table 65 Japan: Organic Soup Market, by Product Type, 2018–2023 (USD Million)
Table 66 Japan: Organic Soup Market, by Source,2018–2023 (USD Million)
Table 67 Japan: Organic Soup Market, by Packaging Type, 2018–2023 (USD Million)
Table 68 Japan: Organic Soup Market, by Distribution Channel, 2018–2023 (USD Million)
Table 69 Australia & New Zealand: Organic Soup Market, by Product Type, 2018–2023 (USD Million)
Table 70 Australia & New Zealand: Organic Soup Market, by Source,2018–2023 (USD Million)
Table 71 Australia & New Zealand: Organic Soup Market, by Packaging Type, 2018–2023 (USD Million)
Table 72 Australia & New Zealand: Organic Soup Market, by Distribution Channel, 2018–2023 (USD Million)
Table 73 Rest of Asia-Pacific: Organic Soup Market, by Product Type, 2018–2023 (USD Million)
Table 74 Rest of Asia-Pacific: Organic Soup Market, by Source,2018–2023 (USD Million)
Table 75 Rest of Asia-Pacific: Organic Soup Market, by Packaging Type, 2018–2023 (USD Million)
Table 76 Rest of Asia-Pacific: Organic Soup Market, by Distribution Channel, 2018–2023 (USD Million)
Table 77 Rest of the World (RoW): Organic Soup Market, by Country, 2018–2023 (USD Million)
Table 78 Rest of the World (RoW): Organic Soup Market, by Product Type, 2018–2023 (USD Million)
Table 79 Rest of the World (RoW): Organic Soup Market, by Source,2018–2023 (USD Million)
Table 80 Rest of the World (RoW): Organic Soup Market, by Packaging Type, 2018–2023 (USD Million)
Table 81 Rest of the World (RoW): Organic Soup Market, by Distribution Channel, 2018–2023 (USD Million)
Table 82 South America: Organic Soup Market, by Product Type, 2018–2023 (USD Million)
Table 83 South America: Organic Soup Market, by Source,2018–2023 (USD Million)
Table 84 South America: Organic Soup Market, by Packaging Type, 2018–2023 (USD Million)
Table 85 South America: Organic Soup Market, by Distribution Channel, 2018–2023 (USD Million)
Table 86 Middle East: Organic Soup Market, by Product Type, 2018–2023 (USD Million)
Table 87 Middle East: Organic Soup Market, by Source,2018–2023 (USD Million)
Table 88 Middle East: Organic Soup Market, by Packaging Type, 2018–2023 (USD Million)
Table 89 Middle East: Organic Soup Market, by Distribution Channel, 2018–2023 (USD Million)
Table 90 Africa: Organic Soup Market, by Product Type, 2018–2023 (USD Million)
Table 91 Africa: Organic Soup Market, by Source,2018–2023 (USD Million)
Table 92 Africa: Organic Soup Market, by Packaging Type, 2018–2023 (USD Million)
Table 93 Africa: Organic Soup Market, by Distribution Channel, 2018–2023 (USD Million)
LIST OF FIGURES
FIGURE 1 Global Organic Soup Market Segmentation
FIGURE 2 Forecast Research Methodology
FIGURE 3 Five Forces Analysis of Global Organic Soup Market
FIGURE 4 Value Chain of Global Organic Soup Market
FIGURE 5 Share of Global Organic Soup Market in 2018, by Country (%)
FIGURE 6 Global Organic Soup Market, by Region, 2018–2023
FIGURE 7 Global Organic Soup Market Size, by Product Type, 2018
FIGURE 8 Share of Global Organic Soup Market, by Product Type, 2018–2023 (%)
FIGURE 9 Global Organic Soup Market Size, by Source, 2018
FIGURE 10 Share of Global Organic Soup Market, by Source, 2018–2023 (%)
FIGURE 11 Global Organic Soup Market Size, by Packaging Type, 2018
FIGURE 12 Share of Global Organic Soup Market, by Packaging Type, 2018–2023 (%)
FIGURE 13 Global Organic Soup Market Size, by Distribution Channel, 2018
FIGURE 14 Share of Global Organic Soup Market, by Distribution Channel, 2018–2023 (%)