ID: MRFR/HC/6249-CR | March 2019 | Region: Global | 150 Pages
1 Report Prologue
2 Introduction
2.1 Definition 18
2.2 Scope of the Study 18
2.3 Research Objective 18
2.4 Assumptions & Limitations 18
2.4.1 Assumptions 18
2.4.2 Limitations 18
2.4.3 Market Structure 19
3 Research Methodology
3.1 Primary Research Methodology 21
3.2 Secondary Research Methodology 22
3.3 Market Size Estimation 23
3.4 Forecast Model 23
4 Market Dynamics
4.1 Introduction 25
4.2 Drivers 26
4.2.1 Rising Cardiovascular Disorders 26
4.2.2 Increasing Geriatric Population 26
4.2.3 Rising Surgical Procedures 26
4.3 Restraints 27
4.3.1 High Cost 27
4.4 Opportunity 27
4.4.1 Entering Developing Economies 27
5 Market Factor Analysis
5.1 Porter’s Five Forces Model 29
5.1.1 Bargaining Power of Suppliers 29
5.1.2 Bargaining Power of Buyers 30
5.1.3 Threat of New Entrants 30
5.1.4 Threat of Substitutes 30
5.1.5 Intensity of Rivalry 30
 
5.2 Value Chain Analysis 31
5.2.1 R&D 31
5.2.2 Manufacturing 31
5.2.3 Distribution & Sales 31
5.2.4 Post-sales Monitoring 32
5.3 Demand & Supply: Gap Analysis 32
5.4 Pricing Analysis 32
5.5 Investment Opportunities 32
6 Oral Anticoagulants Market, by Product
6.1 Novel oral anticoagulant 35
6.1.1 Rivaroxaban 36
6.1.2 Apixaban 37
6.1.3 Dabigatran 37
6.1.4 Edoxaban 38
6.1.5 Betrixaban 38
6.2 Warfarin 39
7 Oral Anticoagulants Market, by Disease Indication
7.1 Introduction 41
7.2 Atrial Fibrillation (AF)/ Stroke Prevention 42
7.3 Deep Vein Thrombosis and Pulmonary Embolism 43
8 Oral Anticoagulants Market, by Distribution Channel
8.1 Introduction 45
8.2 Hospital pharmacies 46
8.3 Retail pharmacies 47
8.4 E-commerce 47
9 Global Oral Anticoagulants Market, by Region
9.1 Introduction 49
9.2 America 51
Oral Anticoagulants Market, by Product
Oral Anticoagulants Market, by Disease Indication
Oral Anticoagulants Market, by Distribution Channel
9.2.1 North America 53
Oral Anticoagulants Market, by Product
Oral Anticoagulants Market, by Disease Indication
Oral Anticoagulants Market, by Distribution Channel
9.2.1.1 US 55
Oral Anticoagulants Market, by Product
Oral Anticoagulants Market, by Disease Indication
Oral Anticoagulants Market, by Distribution Channel
9.2.2 Canada 56
Oral Anticoagulants Market, by Product
Oral Anticoagulants Market, by Disease Indication
Oral Anticoagulants Market, by Distribution Channel
9.3 South America 58
Oral Anticoagulants Market, by Product
Oral Anticoagulants Market, by Disease Indication
Oral Anticoagulants Market, by Distribution Channel
9.4 Europe 60
Oral Anticoagulants Market, by Product
Oral Anticoagulants Market, by Disease Indication
Oral Anticoagulants Market, by Distribution Channel
9.4.1 Western Europe 62
Oral Anticoagulants Market, by Product
Oral Anticoagulants Market, by Disease Indication
Oral Anticoagulants Market, by Distribution Channel
9.4.1.1 Germany 64
Oral Anticoagulants Market, by Product
Oral Anticoagulants Market, by Disease Indication
Oral Anticoagulants Market, by Distribution Channel
9.4.1.2 France 65
Oral Anticoagulants Market, by Product
Oral Anticoagulants Market, by Disease Indication
Oral Anticoagulants Market, by Distribution Channel
9.4.1.3 UK 67
Oral Anticoagulants Market, by Product
Oral Anticoagulants Market, by Disease Indication
Oral Anticoagulants Market, by Distribution Channel
9.4.1.4 Italy 68
Oral Anticoagulants Market, by Product
Oral Anticoagulants Market, by Disease Indication
Oral Anticoagulants Market, by Distribution Channel
9.4.1.5 Spain 70
Oral Anticoagulants Market, by Product
Oral Anticoagulants Market, by Disease Indication
Oral Anticoagulants Market, by Distribution Channel
9.4.1.6 Rest of Europe 71
Oral Anticoagulants Market, by Product
Oral Anticoagulants Market, by Disease Indication
Oral Anticoagulants Market, by Distribution Channel
9.4.2 Eastern Europe 73
Oral Anticoagulants Market, by Product
Oral Anticoagulants Market, by Disease Indication
Oral Anticoagulants Market, by Distribution Channel
9.5 Asia Pacific 75
Oral Anticoagulants Market, by Product
Oral Anticoagulants Market, by Disease Indication
Oral Anticoagulants Market, by Distribution Channel
9.5.1 Japan 77
Oral Anticoagulants Market, by Product
Oral Anticoagulants Market, by Disease Indication
Oral Anticoagulants Market, by Distribution Channel
9.5.2 China 78
Oral Anticoagulants Market, by Product
Oral Anticoagulants Market, by Disease Indication
Oral Anticoagulants Market, by Distribution Channel
9.5.3 India 80
Oral Anticoagulants Market, by Product
Oral Anticoagulants Market, by Disease Indication
Oral Anticoagulants Market, by Distribution Channel
9.5.4 Australia 81
Oral Anticoagulants Market, by Product
Oral Anticoagulants Market, by Disease Indication
Oral Anticoagulants Market, by Distribution Channel
9.5.5 Republic of Korea 83
Oral Anticoagulants Market, by Product
Oral Anticoagulants Market, by Disease Indication
Oral Anticoagulants Market, by Distribution Channel
9.5.6 Rest of Asia Pacific 84
Oral Anticoagulants Market, by Product
Oral Anticoagulants Market, by Disease Indication
Oral Anticoagulants Market, by Distribution Channel
9.6 Middle East & Africa 86
Oral Anticoagulants Market, by Product
Oral Anticoagulants Market, by Disease Indication
Oral Anticoagulants Market, by Distribution Channel
9.7 GCC 88
Oral Anticoagulants Market, by Product
Oral Anticoagulants Market, by Disease Indication
Oral Anticoagulants Market, by Distribution Channel
9.7.1 Saudi Arabia 90
Oral Anticoagulants Market, by Product
Oral Anticoagulants Market, by Disease Indication
Oral Anticoagulants Market, by Distribution Channel
9.7.2 United Arab Emirates 91
Oral Anticoagulants Market, by Product
Oral Anticoagulants Market, by Disease Indication
Oral Anticoagulants Market, by Distribution Channel
9.7.3 Kuwait 93
Oral Anticoagulants Market, by Product
Oral Anticoagulants Market, by Disease Indication
Oral Anticoagulants Market, by Distribution Channel
9.7.4 Oman 94
Oral Anticoagulants Market, by Product
Oral Anticoagulants Market, by Disease Indication
Oral Anticoagulants Market, by Distribution Channel
9.7.5 Qatar 96
Oral Anticoagulants Market, by Product
Oral Anticoagulants Market, by Disease Indication
Oral Anticoagulants Market, by Distribution Channel
9.8 Middle East 98
Oral Anticoagulants Market, by Product
Oral Anticoagulants Market, by Disease Indication
Oral Anticoagulants Market, by Distribution Channel
9.8.1 Egypt 100
Oral Anticoagulants Market, by Product
Oral Anticoagulants Market, by Disease Indication
Oral Anticoagulants Market, by Distribution Channel
9.8.2 Jordon 101
Oral Anticoagulants Market, by Product
Oral Anticoagulants Market, by Disease Indication
Oral Anticoagulants Market, by Distribution Channel
9.8.3 Lebanon 103
Oral Anticoagulants Market, by Product
Oral Anticoagulants Market, by Disease Indication
Oral Anticoagulants Market, by Distribution Channel
9.8.4 Iran 104
Oral Anticoagulants Market, by Product
Oral Anticoagulants Market, by Disease Indication
Oral Anticoagulants Market, by Distribution Channel
9.8.5 Iraq 106
Oral Anticoagulants Market, by Product
Oral Anticoagulants Market, by Disease Indication
Oral Anticoagulants Market, by Distribution Channel
9.8.6 Rest of Middle East 107
Oral Anticoagulants Market, by Product
Oral Anticoagulants Market, by Disease Indication
Oral Anticoagulants Market, by Distribution Channel
9.9 Africa 109
Oral Anticoagulants Market, by Product
Oral Anticoagulants Market, by Disease Indication
Oral Anticoagulants Market, by Distribution Channel
9.9.1 South Africa 111
Oral Anticoagulants Market, by Product
Oral Anticoagulants Market, by Disease Indication
Oral Anticoagulants Market, by Distribution Channel
9.9.2 Morocco 112
Oral Anticoagulants Market, by Product
Oral Anticoagulants Market, by Disease Indication
Oral Anticoagulants Market, by Distribution Channel
9.9.3 Algeria 114
Oral Anticoagulants Market, by Product
Oral Anticoagulants Market, by Disease Indication
Oral Anticoagulants Market, by Distribution Channel
9.9.4 Tunisia 115
Oral Anticoagulants Market, by Product
Oral Anticoagulants Market, by Disease Indication
Oral Anticoagulants Market, by Distribution Channel
9.9.5 Rest of Africa 117
Oral Anticoagulants Market, by Product
Oral Anticoagulants Market, by Disease Indication
Oral Anticoagulants Market, by Distribution Channel
10 Competitive Landscape
10.1 Competitive Overview of the Oral Anticoagulants Market 120
11 Company Profiles
11.1 AstraZeneca, PLC 123
11.1.1 Company Overview 123
11.1.2 Financial Overview 123
11.1.3 Products Offering 123
11.1.4 Key Developments 123
11.1.5 SWOT Analysis 124
11.1.6 Key Strategy 124
11.2 Pfizer Inc. 125
11.2.1 Company Overview 125
11.2.2 Financial Overview 125
11.2.3 Products Offering 125
11.2.4 Key Developments 126
11.2.5 SWOT Analysis 126
11.2.6 Key Strategy 126
11.3 Boehringer Ingelheim GmbH 127
11.3.1 Company Overview 127
11.3.2 Financial Overview 127
11.3.3 Products Offering 127
11.3.4 Key Developments 128
11.3.5 SWOT Analysis 128
11.3.6 Key Strategy 128
11.4 Daiichi Sankyo Company Ltd 129
11.4.1 Company Overview 129
11.4.2 Financial Overview 129
11.4.3 Products Offering 130
11.4.4 Key Developments 130
11.4.5 SWOT Analysis 130
11.4.6 Key Strategy 130
11.5 Abbott Laboratories 131
11.5.1 Company Overview 131
11.5.2 Financial Overview 131
11.5.3 Products Offering 132
11.5.4 Key Developments 132
11.5.5 SWOT Analysis 132
11.5.6 Key Strategy 132
11.6 Eli Lilly and Company 133
11.6.1 Company Overview 133
11.6.2 Financial Overview 133
11.6.3 Products Offering 134
11.6.4 Key Developments 134
11.6.5 SWOT Analysis 134
11.6.6 Key Strategy 134
11.7 GlaxoSmithKline plc (GSK) 135
11.7.1 Company Overview 135
11.7.2 Financial Overview 135
11.7.3 Products Offering 136
11.7.4 Key Developments 136
11.7.5 SWOT Analysis 136
11.7.6 Key Strategy 136
11.8 Portola Pharmaceuticals Inc. 137
11.8.1 Company Overview 137
11.8.2 Financial Overview 137
11.8.3 Products Offering 137
11.8.4 Key Developments 137
11.8.5 SWOT Analysis 138
11.8.6 Key Strategy 138
11.9 Medicure 139
11.9.1 Company Overview 139
11.9.2 Financial Overview 139
11.9.3 Products Offering 139
11.9.4 Key Developments 139
11.9.5 SWOT Analysis 139
11.9.6 Key Strategy 139
11.10 Johnson & Johnson Services Inc. 140
11.10.2 Financial Overview 140
11.10.3 Products Offering 140
11.10.4 Key Developments 141
11.10.5 SWOT Analysis 141
11.10.6 Key Strategy 141
11.11 Eisai Co., Ltd. 142
11.11.1 Company Overview 142
11.11.2 Financial Overview 142
11.11.3 Products Offering 142
11.11.4 Key Developments 143
11.11.5 SWOT Analysis 143
11.11.6 Key Strategy 143
11.12 Cipla Limited 144
11.12.1 Company Overview 144
11.12.2 Financial Overview 144
11.12.3 Products Offering 145
11.12.4 Key Developments 145
11.12.5 SWOT Analysis 145
11.12.6 Key Strategy 145
12 Appendix
12.1 Discussion Blue Print 147
12.2 Recent key developments 149
12.3 References 149
13 List of Tables
TABLE 1 GLOBAL ORAL ANTICOAGULANTS MARKET, BY PRODUCT 2020–2027 (USD MILLION) 34
TABLE 2 GLOBAL ORAL ANTICOAGULANTS MARKET FOR NOVEL ORAL ANTICOAGULANTS, BY TYPE, 2020 & 2027 (USD MILLION) 35
TABLE 3 GLOBAL ORAL ANTICOAGULANTS MARKET FOR RIVAROXABAN, BY REGION, 2020–2027 (USD MILLION) 36
TABLE 4 GLOBAL ORAL ANTICOAGULANTS MARKET FOR APIXABAN, BY REGION, 2020–2027 (USD MILLION) 37
TABLE 5 GLOBAL ORAL ANTICOAGULANTS MARKET FOR DABIGATRAN, BY REGION, 2020–2027 (USD MILLION) 37
TABLE 6 GLOBAL ANTICOAGULANTS MARKET FOR EDOXABAN, BY REGION, 2020–2027 (USD MILLION) 38
TABLE 7 GLOBAL ANTICOAGULANTS MARKET FOR BETRIXABAN, BY REGION, 2020–2027 (USD MILLION) 38
TABLE 8 GLOBAL ORAL ANTICOAGULANTS MARKET FOR WARFARIN, BY REGION, 2020–2027 (USD MILLION) 39
TABLE 9 GLOBAL ORAL ANTICOAGULANTS MARKET, BY DISEASE INDICATION 2020–2027 (USD MILLION) 41
TABLE 10 GLOBAL ORAL ANTICOAGULANTS MARKET FOR ATRIAL FIBRILLATION (AF)/ STROKE PREVENTION, BY REGION,
2020–2027 (USD MILLION) 42
TABLE 11 GLOBAL ORAL ANTICOAGULANTS MARKET FOR DEEP VEIN THROMBOSIS AND PULMONARY EMBOLISM, BY REGION,
2020–2027 (USD MILLION) 43
TABLE 12 GLOBAL ORAL ANTICOAGULANTS MARKET, BY DISTRIBUTION CHANNEL, 2020–2027 (USD MILLION) 45
TABLE 13 GLOBAL ORAL ANTICOAGULANTS MARKET FOR HOSPITAL PHARMACIES, BY REGION, 2020–2027 (USD MILLION) 46
TABLE 14 GLOBAL ORAL ANTICOAGULANTS MARKET FOR RETAIL PHARMACIES, BY REGION, 2020–2027 (USD MILLION) 47
TABLE 15 GLOBAL ORAL ANTICOAGULANTS MARKET FOR E-COMMERCE, BY REGION, 2020–2027 (USD MILLION) 47
TABLE 16 GLOBAL ORAL ANTICOAGULANTS MARKET, BY REGION, 2020–2027 (USD MILLION) 50
TABLE 17 AMERICA ORAL ANTICOAGULANTS MARKET, BY REGION, 2020–2027 (USD MILLION) 51
TABLE 18 AMERICA ORAL ANTICOAGULANTS MARKET, BY PRODUCT 2020-2027 (USD MILLION) 51
TABLE 19 AMERICA ORAL ANTICOAGULANTS MARKET FOR NOVEL ORAL ANTICOAGULANT, BY TYPE 2020-2027 (USD MILLION) 52
TABLE 20 AMERICA ORAL ANTICOAGULANTS MARKET, BY DISEASE INDICATION 2020-2027 (USD MILLION) 52
TABLE 21 AMERICA ORAL ANTICOAGULANTS MARKET, BY DISTRIBUTION CHANNEL 2020-2027 (USD MILLION) 52
TABLE 22 NORTH AMERICA ORAL ANTICOAGULANTS MARKET, BY COUNTRY, 2020–2027 (USD MILLION) 53
TABLE 23 NORTH AMERICA ORAL ANTICOAGULANTS MARKET, BY PRODUCT 2020-2027 (USD MILLION) 53
TABLE 24 NORTH AMERICA ORAL ANTICOAGULANTS MARKET FOR NOVEL ORAL ANTICOAGULANT, BY TYPE
2020-2027 (USD MILLION) 54
TABLE 25 NORTH AMERICA ORAL ANTICOAGULANTS MARKET, BY DISEASE INDICATION 2020-2027 (USD MILLION) 54
TABLE 26 NORTH AMERICA ORAL ANTICOAGULANTS MARKET, BY DISTRIBUTION CHANNEL 2020-2027 (USD MILLION) 54
TABLE 27 US ORAL ANTICOAGULANTS MARKET, BY PRODUCT 2020-2027 (USD MILLION) 55
TABLE 28 US ORAL ANTICOAGULANTS MARKET FOR NOVEL ORAL ANTICOAGULANT, BY TYPE 2020-2027 (USD MILLION) 55
TABLE 29 US ORAL ANTICOAGULANTS MARKET, BY DISEASE INDICATION 2020-2027 (USD MILLION) 55
TABLE 30 US ORAL ANTICOAGULANTS MARKET, BY DISTRIBUTION CHANNEL 2020-2027 (USD MILLION) 56
TABLE 31 CANADA ORAL ANTICOAGULANTS MARKET, BY PRODUCT 2020-2027 (USD MILLION) 56
TABLE 32 CANADA ORAL ANTICOAGULANTS MARKET FOR NOVEL ORAL ANTICOAGULANT, BY TYPE 2020-2027 (USD MILLION) 56
TABLE 33 CANADA ORAL ANTICOAGULANTS MARKET, BY DISEASE INDICATION 2020-2027 (USD MILLION) 57
TABLE 34 CANADA ORAL ANTICOAGULANTS MARKET, BY DISTRIBUTION CHANNEL 2020-2027 (USD MILLION) 57
TABLE 35 SOUTH AMERICA ORAL ANTICOAGULANTS MARKET, BY PRODUCT 2020-2027 (USD MILLION) 58
TABLE 36 SOUTH AMERICA ORAL ANTICOAGULANTS MARKET FOR NOVEL ORAL ANTICOAGULANT, BY TYPE
2020-2027 (USD MILLION) 58
TABLE 37 SOUTH AMERICA ORAL ANTICOAGULANTS MARKET, BY DISEASE INDICATION 2020-2027 (USD MILLION) 58
TABLE 38 SOUTH AMERICA ORAL ANTICOAGULANTS MARKET, BY DISTRIBUTION CHANNEL 2020-2027 (USD MILLION) 59
TABLE 39 EUROPE ORAL ANTICOAGULANTS MARKET, BY REGION, 2020–2027 (USD MILLION) 60
TABLE 40 EUROPE ORAL ANTICOAGULANTS MARKET, BY PRODUCT 2020-2027 (USD MILLION) 60
TABLE 41 EUROPE ORAL ANTICOAGULANTS MARKET FOR NOVEL ORAL ANTICOAGULANT, BY TYPE 2020-2027 (USD MILLION) 61
TABLE 42 EUROPE ORAL ANTICOAGULANTS MARKET, BY DISEASE INDICATION 2020-2027 (USD MILLION) 61
TABLE 43 EUROPE ORAL ANTICOAGULANTS MARKET, BY DISTRIBUTION CHANNEL 2020-2027 (USD MILLION) 61
TABLE 44 WESTERN EUROPE ORAL ANTICOAGULANTS MARKET, BY COUNTRY, 2020–2027 (USD MILLION) 62
TABLE 45 WESTERN EUROPE ORAL ANTICOAGULANTS MARKET, BY PRODUCT 2020-2027 (USD MILLION) 62
TABLE 46 WESTERN EUROPE ORAL ANTICOAGULANTS MARKET FOR NOVEL ORAL ANTICOAGULANT, BY TYPE
2020-2027 (USD MILLION) 63
TABLE 47 WESTERN EUROPE ORAL ANTICOAGULANTS MARKET, BY DISEASE INDICATION 2020-2027 (USD MILLION) 63
TABLE 48 WESTERN EUROPE ORAL ANTICOAGULANTS MARKET, BY DISTRIBUTION CHANNEL 2020-2027 (USD MILLION) 63
TABLE 49 GERMANY ORAL ANTICOAGULANTS MARKET, BY PRODUCT 2020-2027 (USD MILLION) 64
TABLE 50 GERMANY ORAL ANTICOAGULANTS MARKET FOR NOVEL ORAL ANTICOAGULANT, BY TYPE 2020-2027 (USD MILLION) 64
TABLE 51 GERMANY ORAL ANTICOAGULANTS MARKET, BY DISEASE INDICATION 2020-2027 (USD MILLION) 64
TABLE 52 GERMANY ORAL ANTICOAGULANTS MARKET, BY DISTRIBUTION CHANNEL 2020-2027 (USD MILLION) 65
TABLE 53 FRANCE ORAL ANTICOAGULANTS MARKET, BY PRODUCT 2020-2027 (USD MILLION) 65
TABLE 54 FRANCE ORAL ANTICOAGULANTS MARKET FOR NOVEL ORAL ANTICOAGULANT, BY TYPE 2020-2027 (USD MILLION) 65
TABLE 55 FRANCE ORAL ANTICOAGULANTS MARKET, BY DISEASE INDICATION 2020-2027 (USD MILLION) 66
TABLE 56 FRANCE ORAL ANTICOAGULANTS MARKET, BY DISTRIBUTION CHANNEL 2020-2027 (USD MILLION) 66
TABLE 57 UK ORAL ANTICOAGULANTS MARKET, BY PRODUCT 2020-2027 (USD MILLION) 67
TABLE 58 UK ORAL ANTICOAGULANTS MARKET FOR NOVEL ORAL ANTICOAGULANT, BY TYPE 2020-2027 (USD MILLION) 67
TABLE 59 UK ORAL ANTICOAGULANTS MARKET, BY DISEASE INDICATION 2020-2027 (USD MILLION) 67
TABLE 60 UK ORAL ANTICOAGULANTS MARKET, BY DISTRIBUTION CHANNEL 2020-2027 (USD MILLION) 68
TABLE 61 ITALY ORAL ANTICOAGULANTS MARKET, BY PRODUCT 2020-2027 (USD MILLION) 68
TABLE 62 ITALY ORAL ANTICOAGULANTS MARKET FOR NOVEL ORAL ANTICOAGULANT, BY TYPE 2020-2027 (USD MILLION) 68
TABLE 63 ITALY ORAL ANTICOAGULANTS MARKET, BY DISEASE INDICATION 2020-2027 (USD MILLION) 69
TABLE 64 ITALY ORAL ANTICOAGULANTS MARKET, BY DISTRIBUTION CHANNEL 2020-2027 (USD MILLION) 69
TABLE 65 SPAIN ORAL ANTICOAGULANTS MARKET, BY PRODUCT 2020-2027 (USD MILLION) 70
TABLE 66 SPAIN ORAL ANTICOAGULANTS MARKET FOR NOVEL ORAL ANTICOAGULANT, BY TYPE 2020-2027 (USD MILLION) 70
TABLE 67 SPAIN ORAL ANTICOAGULANTS MARKET, BY DISEASE INDICATION 2020-2027 (USD MILLION) 70
TABLE 68 SPAIN ORAL ANTICOAGULANTS MARKET, BY DISTRIBUTION CHANNEL 2020-2027 (USD MILLION) 71
TABLE 69 REST OF EUROPE ORAL ANTICOAGULANTS MARKET, BY PRODUCT 2020-2027 (USD MILLION) 71
TABLE 70 REST OF EUROPE ORAL ANTICOAGULANTS MARKET FOR NOVEL ORAL ANTICOAGULANT, BY TYPE
2020-2027 (USD MILLION) 71
TABLE 71 REST OF EUROPE ORAL ANTICOAGULANTS MARKET, BY DISEASE INDICATION 2020-2027 (USD MILLION) 72
TABLE 72 REST OF EUROPE ORAL ANTICOAGULANTS MARKET, BY DISTRIBUTION CHANNEL 2020-2027 (USD MILLION) 72
TABLE 73 EASTERN EUROPE ORAL ANTICOAGULANTS MARKET, BY PRODUCT 2020-2027 (USD MILLION) 73
TABLE 74 EASTERN EUROPE ORAL ANTICOAGULANTS MARKET FOR NOVEL ORAL ANTICOAGULANT, BY TYPE
2020-2027 (USD MILLION) 73
TABLE 75 EASTERN EUROPE ORAL ANTICOAGULANTS MARKET, BY DISEASE INDICATION 2020-2027 (USD MILLION) 73
TABLE 76 EASTERN EUROPE ORAL ANTICOAGULANTS MARKET, BY DISTRIBUTION CHANNEL 2020-2027 (USD MILLION) 74
TABLE 77 ASIA PACIFIC ORAL ANTICOAGULANTS MARKET, BY COUNTRY, 2020–2027 (USD MILLION) 75
TABLE 78 ASIA PACIFIC ORAL ANTICOAGULANTS MARKET, BY PRODUCT 2020-2027 (USD MILLION) 75
TABLE 79 ASIA PACIFIC ORAL ANTICOAGULANTS MARKET FOR NOVEL ORAL ANTICOAGULANT, BY TYPE 2020-2027 (USD MILLION) 76
TABLE 80 ASIA PACIFIC ORAL ANTICOAGULANTS MARKET, BY DISEASE INDICATION 2020-2027 (USD MILLION) 76
TABLE 81 ASIA PACIFIC ORAL ANTICOAGULANTS MARKET, BY DISTRIBUTION CHANNEL 2020-2027 (USD MILLION) 76
TABLE 82 JAPAN ORAL ANTICOAGULANTS MARKET, BY PRODUCT 2020-2027 (USD MILLION) 77
TABLE 83 JAPAN ORAL ANTICOAGULANTS MARKET FOR NOVEL ORAL ANTICOAGULANT, BY TYPE 2020-2027 (USD MILLION) 77
TABLE 84 JAPAN ORAL ANTICOAGULANTS MARKET, BY DISEASE INDICATION 2020-2027 (USD MILLION) 77
TABLE 85 JAPAN ORAL ANTICOAGULANTS MARKET, BY DISTRIBUTION CHANNEL 2020-2027 (USD MILLION) 78
TABLE 86 CHINA ORAL ANTICOAGULANTS MARKET, BY PRODUCT 2020-2027 (USD MILLION) 78
TABLE 87 CHINA ORAL ANTICOAGULANTS MARKET FOR NOVEL ORAL ANTICOAGULANT, BY TYPE 2020-2027 (USD MILLION) 78
TABLE 88 CHINA ORAL ANTICOAGULANTS MARKET, BY DISEASE INDICATION 2020-2027 (USD MILLION) 79
TABLE 89 CHINA ORAL ANTICOAGULANTS MARKET, BY DISTRIBUTION CHANNEL 2020-2027 (USD MILLION) 79
TABLE 90 INDIA ORAL ANTICOAGULANTS MARKET, BY PRODUCT 2020-2027 (USD MILLION) 80
TABLE 91 INDIA ORAL ANTICOAGULANTS MARKET FOR NOVEL ORAL ANTICOAGULANT, BY TYPE 2020-2027 (USD MILLION) 80
TABLE 92 INDIA ORAL ANTICOAGULANTS MARKET, BY DISEASE INDICATION 2020-2027 (USD MILLION) 80
TABLE 93 INDIA ORAL ANTICOAGULANTS MARKET, BY DISTRIBUTION CHANNEL 2020-2027 (USD MILLION) 81
TABLE 94 AUSTRALIA ORAL ANTICOAGULANTS MARKET, BY PRODUCT 2020-2027 (USD MILLION) 81
TABLE 95 AUSTRALIA ORAL ANTICOAGULANTS MARKET FOR NOVEL ORAL ANTICOAGULANT, BY TYPE 2020-2027 (USD MILLION) 81
TABLE 96 AUSTRALIA ORAL ANTICOAGULANTS MARKET, BY DISEASE INDICATION 2020-2027 (USD MILLION) 82
TABLE 97 AUSTRALIA ORAL ANTICOAGULANTS MARKET, BY DISTRIBUTION CHANNEL 2020-2027 (USD MILLION) 82
TABLE 98 REPUBLIC OF KOREA ORAL ANTICOAGULANTS MARKET, BY PRODUCT 2020-2027 (USD MILLION) 83
TABLE 99 REPUBLIC OF KOREA ORAL ANTICOAGULANTS MARKET FOR NOVEL ORAL ANTICOAGULANT, BY TYPE
2020-2027 (USD MILLION) 83
TABLE 100 REPUBLIC OF KOREA ORAL ANTICOAGULANTS MARKET, BY DISEASE INDICATION 2020-2027 (USD MILLION) 83
TABLE 101 REPUBLIC OF KOREA ORAL ANTICOAGULANTS MARKET, BY DISTRIBUTION CHANNEL 2020-2027 (USD MILLION) 84
TABLE 102 REST OF ASIA PACIFIC ORAL ANTICOAGULANTS MARKET, BY PRODUCT 2020-2027 (USD MILLION) 84
TABLE 103 REST OF ASIA PACIFIC ORAL ANTICOAGULANTS MARKET FOR NOVEL ORAL ANTICOAGULANT, BY TYPE
2020-2027 (USD MILLION) 84
TABLE 104 REST OF ASIA PACIFIC ORAL ANTICOAGULANTS MARKET, BY DISEASE INDICATION 2020-2027 (USD MILLION) 85
TABLE 105 REST OF ASIA PACIFIC ORAL ANTICOAGULANTS MARKET, BY DISTRIBUTION CHANNEL 2020-2027 (USD MILLION) 85
TABLE 106 MIDDLE EAST & AFRICA ORAL ANTICOAGULANTS MARKET, BY REGION, 2020–2027 (USD MILLION) 86
TABLE 107 MIDDLE EAST & AFRICA ORAL ANTICOAGULANTS MARKET, BY PRODUCT 2020-2027 (USD MILLION) 86
TABLE 108 MIDDLE EAST & AFRICA ORAL ANTICOAGULANTS MARKET FOR NOVEL ORAL ANTICOAGULANT, BY TYPE
2020-2027 (USD MILLION) 87
TABLE 109 MIDDLE EAST & AFRICA ORAL ANTICOAGULANTS MARKET, BY DISEASE INDICATION 2020-2027 (USD MILLION) 87
TABLE 110 MIDDLE EAST & AFRICA ORAL ANTICOAGULANTS MARKET, BY DISTRIBUTION CHANNEL 2020-2027 (USD MILLION) 87
TABLE 111 GCC ORAL ANTICOAGULANTS MARKET, BY COUNTRY, 2020–2027 (USD MILLION) 88
TABLE 112 GCC ORAL ANTICOAGULANTS MARKET, BY PRODUCT, 2020–2027(USD MILLION) 88
TABLE 113 GCC ORAL ANTICOAGULANTS MARKET FOR NOVEL ORAL ANTICOAGULANT, BY TYPE, 2020–2027(USD MILLION) 89
TABLE 114 GCC ORAL ANTICOAGULANTS MARKET, BY DISEASE INDICATION, 2020–2027(USD MILLION) 89
TABLE 115 GCC ORAL ANTICOAGULANTS MARKET, BY DISTRIBUTION CHANNEL, 2020–2027(USD MILLION) 89
TABLE 116 SAUDI ARABIA ORAL ANTICOAGULANTS MARKET, BY PRODUCT, 2020–2027(USD MILLION) 90
TABLE 117 SAUDI ARABIA ORAL ANTICOAGULANTS MARKET FOR NOVEL ORAL ANTICOAGULANT, BY TYPE, 2020–2027(USD MILLION) 90
TABLE 118 SAUDI ARABIA ORAL ANTICOAGULANTS MARKET, BY DISEASE INDICATION, 2020–2027(USD MILLION) 90
TABLE 119 SAUDI ARABIA ORAL ANTICOAGULANTS MARKET, BY DISTRIBUTION CHANNEL, 2020–2027(USD MILLION) 91
TABLE 120 UNITED ARAB EMIRATES ORAL ANTICOAGULANTS MARKET, BY PRODUCT, 2020–2027(USD MILLION) 91
TABLE 121 UNITED ARAB EMIRATES ORAL ANTICOAGULANTS MARKET FOR NOVEL ORAL ANTICOAGULANT, BY TYPE,
2020–2027(USD MILLION) 91
TABLE 122 UNITED ARAB EMIRATES ORAL ANTICOAGULANTS MARKET, BY DISEASE INDICATION, 2020–2027(USD MILLION) 92
TABLE 123 UNITED ARAB EMIRATES ORAL ANTICOAGULANTS MARKET, BY DISTRIBUTION CHANNEL, 2020–2027(USD MILLION) 92
TABLE 124 KUWAIT ORAL ANTICOAGULANTS MARKET, BY PRODUCT, 2020–2027(USD MILLION) 93
TABLE 125 KUWAIT ORAL ANTICOAGULANTS MARKET FOR NOVEL ORAL ANTICOAGULANT, BY TYPE, 2020–2027(USD MILLION) 93
TABLE 126 KUWAIT ORAL ANTICOAGULANTS MARKET, BY DISEASE INDICATION 2020–2027(USD MILLION) 93
TABLE 127 KUWAIT ORAL ANTICOAGULANTS MARKET, BY DISTRIBUTION CHANNEL, 2020–2027(USD MILLION) 94
TABLE 128 OMAN ORAL ANTICOAGULANTS MARKET, BY PRODUCT, 2020–2027(USD MILLION) 94
TABLE 129 OMAN ORAL ANTICOAGULANTS MARKET FOR NOVEL ORAL ANTICOAGULANT, BY TYPE, 2020–2027(USD MILLION) 94
TABLE 130 OMAN ORAL ANTICOAGULANTS MARKET, BY DISEASE INDICATION, 2020–2027(USD MILLION) 95
TABLE 131 OMAN ORAL ANTICOAGULANTS MARKET, BY DISTRIBUTION CHANNEL, 2020–2027(USD MILLION) 95
TABLE 132 QATAR ORAL ANTICOAGULANTS MARKET, BY PRODUCT, 2020–2027(USD MILLION) 96
TABLE 133 QATAR ORAL ANTICOAGULANTS MARKET FOR NOVEL ORAL ANTICOAGULANT, BY TYPE, 2020–2027(USD MILLION) 96
TABLE 134 QATAR ORAL ANTICOAGULANTS MARKET, BY DISEASE INDICATION, 2020–2027(USD MILLION) 96
TABLE 135 QATAR ORAL ANTICOAGULANTS MARKET, BY DISTRIBUTION CHANNEL 2020–2027(USD MILLION) 97
TABLE 136 MIDDLE EAST ORAL ANTICOAGULANTS MARKET, BY COUNTRY, 2020–2027(USD MILLION) 98
TABLE 137 MIDDLE EAST ORAL ANTICOAGULANTS MARKET, BY PRODUCT, 2020–2027(USD MILLION) 98
TABLE 138 MIDDLE EAST ORAL ANTICOAGULANTS MARKET FOR NOVEL ORAL ANTICOAGULANT, BY TYPE 2020–2027(USD MILLION) 99
TABLE 139 MIDDLE EAST ORAL ANTICOAGULANTS MARKET, BY DISEASE INDICATION, 2020–2027(USD MILLION) 99
TABLE 140 MIDDLE EAST ORAL ANTICOAGULANTS MARKET, BY DISTRIBUTION CHANNEL, 2020–2027(USD MILLION) 99
TABLE 141 EGYPT ORAL ANTICOAGULANTS MARKET, BY PRODUCT, 2020–2027(USD MILLION) 100
TABLE 142 EGYPT ORAL ANTICOAGULANTS MARKET FOR NOVEL ORAL ANTICOAGULANT, BY TYPE, 2020–2027(USD MILLION) 100
TABLE 143 EGYPT ORAL ANTICOAGULANTS MARKET, BY DISEASE INDICATION, 2020–2027(USD MILLION) 100
TABLE 144 EGYPT ORAL ANTICOAGULANTS MARKET, BY DISTRIBUTION CHANNEL 2020–2027(USD MILLION) 101
TABLE 145 JORDON ORAL ANTICOAGULANTS MARKET, BY PRODUCT, 2020–2027(USD MILLION) 101
TABLE 146 JORDON ORAL ANTICOAGULANTS MARKET FOR NOVEL ORAL ANTICOAGULANT, BY TYPE, 2020–2027(USD MILLION) 101
TABLE 147 JORDON ORAL ANTICOAGULANTS MARKET, BY DISEASE INDICATION, 2020–2027(USD MILLION) 102
TABLE 148 JORDON ORAL ANTICOAGULANTS MARKET, BY DISTRIBUTION CHANNEL, 2020–2027(USD MILLION) 102
TABLE 149 LEBANON ORAL ANTICOAGULANTS MARKET, BY PRODUCT, 2020–2027(USD MILLION) 103
TABLE 150 LEBANON ORAL ANTICOAGULANTS MARKET FOR NOVEL ORAL ANTICOAGULANT, BY TYPE, 2020–2027(USD MILLION) 103
TABLE 151 LEBANON ORAL ANTICOAGULANTS MARKET, BY DISEASE INDICATION, 2020–2027(USD MILLION) 103
TABLE 152 LEBANON ORAL ANTICOAGULANTS MARKET, BY DISTRIBUTION CHANNEL, 2020–2027(USD MILLION) 104
TABLE 153 IRAN ORAL ANTICOAGULANTS MARKET, BY PRODUCT, 2020–2027(USD MILLION) 104
TABLE 154 IRAN ORAL ANTICOAGULANTS MARKET FOR NOVEL ORAL ANTICOAGULANT, BY TYPE, 2020–2027(USD MILLION) 104
TABLE 155 IRAN ORAL ANTICOAGULANTS MARKET, BY DISEASE INDICATION, 2020–2027(USD MILLION) 105
TABLE 156 IRAN ORAL ANTICOAGULANTS MARKET, BY DISTRIBUTION CHANNEL, 2020–2027(USD MILLION) 105
TABLE 157 IRAQ ORAL ANTICOAGULANTS MARKET, BY PRODUCT, 2020–2027(USD MILLION) 106
TABLE 158 IRAQ ORAL ANTICOAGULANTS MARKET FOR NOVEL ORAL ANTICOAGULANT, BY TYPE, 2020–2027(USD MILLION) 106
TABLE 159 IRAQ ORAL ANTICOAGULANTS MARKET, BY DISEASE INDICATION, 2020–2027(USD MILLION) 106
TABLE 160 IRAQ ORAL ANTICOAGULANTS MARKET, BY DISTRIBUTION CHANNEL, 2020–2027(USD MILLION) 107
TABLE 161 REST OF MIDDLE EAST ORAL ANTICOAGULANTS MARKET, BY PRODUCT, 2020–2027(USD MILLION) 107
TABLE 162 REST OF MIDDLE EAST ORAL ANTICOAGULANTS MARKET FOR NOVEL ORAL ANTICOAGULANT, BY TYPE,
2020–2027(USD MILLION) 107
TABLE 163 REST OF MIDDLE EAST ORAL ANTICOAGULANTS MARKET, BY DISEASE INDICATION 2020–2027(USD MILLION) 108
TABLE 164 REST OF MIDDLE EAST ORAL ANTICOAGULANTS MARKET, BY DISTRIBUTION CHANNEL, 2020–2027(USD MILLION) 108
TABLE 165 AFRICA ORAL ANTICOAGULANTS MARKET, BY COUNTRY, 2020–2027(USD MILLION) 109
TABLE 166 AFRICA ORAL ANTICOAGULANTS MARKET, BY PRODUCT 2020-2027 (USD MILLION) 109
TABLE 167 AFRICA ORAL ANTICOAGULANTS MARKET FOR NOVEL ORAL ANTICOAGULANT, BY TYPE 2020-2027 (USD MILLION) 110
TABLE 168 AFRICA ORAL ANTICOAGULANTS MARKET, BY DISEASE INDICATION 2020-2027 (USD MILLION) 110
TABLE 169 AFRICA ORAL ANTICOAGULANTS MARKET, BY DISTRIBUTION CHANNEL 2020-2027 (USD MILLION) 110
TABLE 170 SOUTH AFRICA ORAL ANTICOAGULANTS MARKET, BY PRODUCT 2020-2027 (USD MILLION) 111
TABLE 171 SOUTH AFRICA ORAL ANTICOAGULANTS MARKET FOR NOVEL ORAL ANTICOAGULANT, BY TYPE 2020-2027 (USD MILLION) 111
TABLE 172 SOUTH AFRICA ORAL ANTICOAGULANTS MARKET, BY DISEASE INDICATION 2020-2027 (USD MILLION) 111
TABLE 173 SOUTH AFRICA ORAL ANTICOAGULANTS MARKET, BY DISTRIBUTION CHANNEL 2020-2027 (USD MILLION) 112
TABLE 174 MOROCCO ORAL ANTICOAGULANTS MARKET, BY PRODUCT 2020-2027 (USD MILLION) 112
TABLE 175 MOROCCO ORAL ANTICOAGULANTS MARKET FOR NOVEL ORAL ANTICOAGULANT, BY TYPE 2020-2027 (USD MILLION) 112
TABLE 176 MOROCCO ORAL ANTICOAGULANTS MARKET, BY DISEASE INDICATION 2020-2027 (USD MILLION) 113
TABLE 177 MOROCCO ORAL ANTICOAGULANTS MARKET, BY DISTRIBUTION CHANNEL 2020-2027 (USD MILLION) 113
TABLE 178 ALGERIA ORAL ANTICOAGULANTS MARKET, BY PRODUCT 2020-2027 (USD MILLION) 114
TABLE 179 ALGERIA ORAL ANTICOAGULANTS MARKET FOR NOVEL ORAL ANTICOAGULANT, BY TYPE 2020-2027 (USD MILLION) 114
TABLE 180 ALGERIA ORAL ANTICOAGULANTS MARKET, BY DISEASE INDICATION 2020-2027 (USD MILLION) 114
TABLE 181 ALGERIA ORAL ANTICOAGULANTS MARKET, BY DISTRIBUTION CHANNEL 2020-2027 (USD MILLION) 115
TABLE 182 TUNISIA ORAL ANTICOAGULANTS MARKET, BY PRODUCT 2020-2027 (USD MILLION) 115
TABLE 183 TUNISIA ORAL ANTICOAGULANTS MARKET FOR NOVEL ORAL ANTICOAGULANT, BY TYPE 2020-2027 (USD MILLION) 115
TABLE 184 TUNISIA ORAL ANTICOAGULANTS MARKET, BY DISEASE INDICATION 2020-2027 (USD MILLION) 116
TABLE 185 TUNISIA ORAL ANTICOAGULANTS MARKET, BY DISTRIBUTION CHANNEL 2020-2027 (USD MILLION) 116
TABLE 186 REST OF AFRICA ORAL ANTICOAGULANTS MARKET, BY PRODUCT 2020-2027 (USD MILLION) 117
TABLE 187 REST OF AFRICA ORAL ANTICOAGULANTS MARKET FOR NOVEL ORAL ANTICOAGULANT, BY TYPE 2020-2027 (USD MILLION) 117
TABLE 188 REST OF AFRICA ORAL ANTICOAGULANTS MARKET, BY DISEASE INDICATION 2020-2027 (USD MILLION) 117
TABLE 189 REST OF AFRICA ORAL ANTICOAGULANTS MARKET, BY DISTRIBUTION CHANNEL 2020-2027 (USD MILLION) 118
TABLE 190 GLOBAL ORAL ANTICOAGULANTS COMPANY SHARE ANALYSIS, 2020 (%) 120
 
14 List of Figures
FIGURE 1 TOP-DOWN & BOTTOM-UP APPROACHES 23
FIGURE 2 MARKET DYNAMICS: GLOBAL ORAL ANTICOAGULANTS MARKET 25
FIGURE 3 PORTER’S FIVE FORCES ANALYSIS: GLOBAL ORAL ANTICOAGULANTS MARKET 29
FIGURE 4 VALUE CHAIN ANALYSIS OF THE GLOBAL ORAL ANTICOAGULANTS MARKET 31
FIGURE 5 GLOBAL ORAL ANTICOAGULANTS MARKET, BY PRODUCT 2020 & 2027 (USD MILLION) 34
FIGURE 6 GLOBAL ORAL ANTICOAGULANTS MARKET, FOR NOVEL ORAL ANTICOAGULANTS BY PRODUCT 2020 & 2027 (USD MILLION) 35
FIGURE 7 GLOBAL ORAL ANTICOAGULANTS MARKET, BY DISEASE INDICATION 2020 & 2027 (USD MILLION) 41
FIGURE 8 GLOBAL ORAL ANTICOAGULANTS MARKET, BY DISTRIBUTION CHANNEL 2020 & 2027 (USD MILLION) 45
FIGURE 9 GLOBAL ORAL ANTICOAGULANTS MARKET, BY REGION, 2020 & 2027 (USD MILLION) 50
FIGURE 10 AMERICAS ORAL ANTICOAGULANTS MARKET, BY REGION 2020 & 2027 (USD MILLION) 51
FIGURE 11 NORTH AMERICA ORAL ANTICOAGULANTS MARKET, BY COUNTRY 2020 & 2027 (USD MILLION) 53
FIGURE 12 EUROPE ORAL ANTICOAGULANTS MARKET, BY REGION 2020 & 2027 (USD MILLION) 60
FIGURE 13 WESTERN EUROPE ORAL ANTICOAGULANTS MARKET, BY COUNTRY 2020 & 2027 (USD MILLION) 62
FIGURE 14 ASIA PACIFIC ORAL ANTICOAGULANTS MARKET, BY COUNTRY, 2020–2027 (USD MILLION) 75
FIGURE 15 MIDDLE EAST & AFRICA ORAL ANTICOAGULANTS MARKET SHARE, BY COUNTRY 2020 (%) 86
FIGURE 16 GCC ORAL ANTICOAGULANTS MARKET SHARE, BY COUNTRY 2020 (%) 88
FIGURE 17 MIDDLE EAST ORAL ANTICOAGULANTS MARKET SHARE, BY COUNTRY 2020 (%) 98
FIGURE 18 AFRICA ORAL ANTICOAGULANTS MARKET SHARE, BY COUNTRY 2020 (%) 109
$45.78 Billion
10.1%
North America
2022-2030
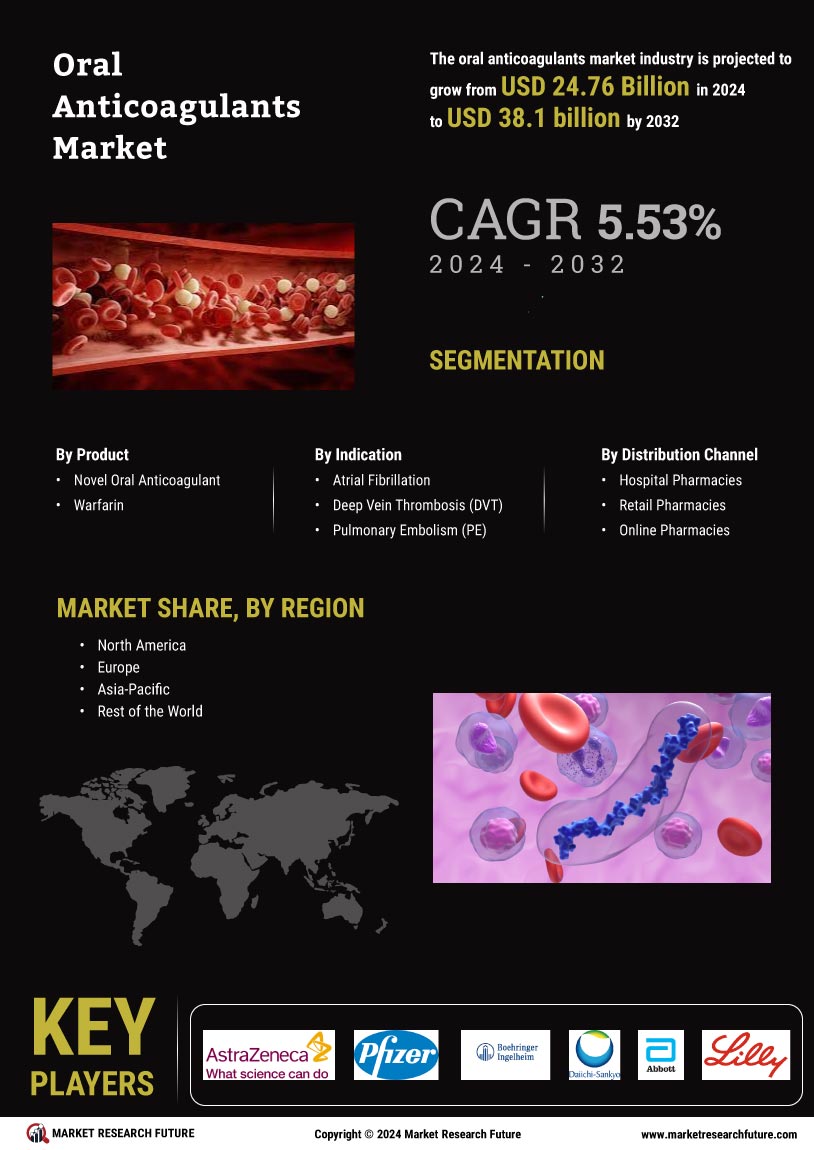
The oral Anticoagulants Market size is expected to reach USD 22,561.24 Million by 2023 with a growth rate of CAGR of 12.50%. Oral anticoagulant is a drug that is used to prevent blood clotting by adding a few amounts of oral anticoagulant into the blood. Anticoagulant represses the synthesis and several clotting functions that are present in the blood. The anticoagulant drug is used to prevent the blood from clotting inside the arteries or veins or any other amplification of blood clot which is circulating in the bloodstream.
Oral anticoagulants which are also known as blood thinners are widely used by doctors to decrease or reduce the coagulant of the blood during the blood clotting period. There are a number of medical conditions where the blood clotting risk is relatively high, such conditions include deep vein thrombosis, atrial fabrication, myocardial infarction, stroke, pulmonary embolism, and others. There was a massive growth in the global anticoagulant industry during the forecast period.
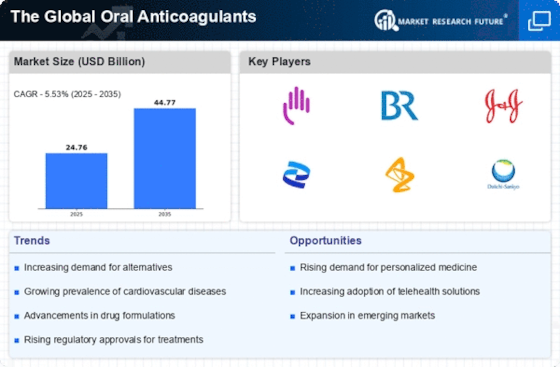
The growth of the global market of oral anticoagulant is determined by several factors including the increase in the generality of the venous thromboembolism (VTE) and other cardiovascular disorders, The demand of the novel oral anticoagulants (NOACs), and the arises apprehension of novel oral anticoagulants the developing countries are the major factor for the growth of the market. The support for the growth of the market also comes from the increase in the number of elderly people and above, demand for novel therapeutics, and elevated unmet needs. The shortage of antidotes for NOACs and the higher or expensive prices of NOACs hampers the market growth during the forecast period. The value of the global anticoagulants market in 2017 at $24.265 million and is anticipated to reach $43,427 million by the end of 2025 with a growing CARG of 7.5% from 2018 to 2025
This report contains all the information on the global oral anticoagulants and the strength of the oral anticoagulant in the market. The report also contains the culmination of dynamics, segmentation, key players, regional analysis, and other important factors. A detailed analysis of the oral anticoagulant globally and forecast to 2023 is also included in the report.
Covid 19 Analysis
The demand for the oral anticoagulant has increased due to the covid 19 pandemic. Though the market is facing some challenges due to the outbreak of the pandemic. Variation in the organic traffics and the response of the industries to the covid 19 cases has distinguished the market by generating alternatives. The report provides an analysis of the anticoagulants and injectable which are available in the market.
The most common type of anticoagulant in the market is warfarin, however, the emergence or the availability of new alternatives or new types of anticoagulants in the market is increasing commonly. The oral anticoagulants market size gets hampered due to the increases in the demand for the other alternatives.
Market Dynamic
The rise in the geriatric population, the increment in cardiovascular diseases, and the increase in the demand for surgical procedures are supporting the growth of the oral anticoagulant market shares during the forecast period.
On the basis of the reports from the Center For Diseases Control and Prevention, there are nearly 46.5 million procedures of surgeries are performed in the United States, every year. And according to the researches or reports from European Heart Network, 85 million population of in the European countries are living with cardiovascular disorders and according to the population prospects, the cases of aged people of 60 years or more are anticipated to double by the end of 2050.
The global anticoagulant market is estimated to reach USD 22,561.24 million by the end of 2023 with a 12.50% CAGR during the review period of 2018 to 2023, the largest shares in the market holding a value of USD 49 in 2017 according to the atrial fibrillation (AF)/ stroke prevention segment.
The data comprises the competitive scenarios of the global oral anticoagulant and it includes the economical and technical environment and the high growth regions and their political. These factors are linked with the growth of the market.
The estimates of the market have been considered after studying the various impact that includes social, economical, and political factors. The dynamics of the market are affecting the global anticoagulant market growth. The dynamic of the market includes porter’s five forces analysis that namely, bargaining power. The threat of new entrants, suppliers’ bargaining power, completion in the oral anticoagulant market globally, and the treats of the substitute.
The development of a novel oral anticoagulant market (NOACs) has increased the global anticoagulant market. The market is facing some challenges among which the side effects related to the drugs are the major cause. Stringent regulations from regulatory bodies and the high cost of oral anticoagulants are some other factors affecting the market growth.
According to the study, the anticoagulant growth momentum includes the increased incidence of cardiovascular diseases, the increase in the elderly population, and the newly listed drugs which are the improved versions of the existing drugs. On the basis of the evaluated pharmacy report, the highest annual growth rate of the top 15 treatment areas is due to the increased uses of Bayer’s Xarelto(rivaroxaban) and ringer’s Pradaxa (Clopidogrel) and clesulenol (enoxaparin). The two most favorable drugs in the anticoagulants are direct coagulation factor lla inhibitos which is representing the drug: Dabigatran etexilate and inhibitors of direct coagulation factor Xa which represents drugs: rivaroxaban, apixaban, etaneraban. FDA has approved three new oral anticoagulant drugs which are in use for the past few years. Pradaxa (dabigatran), Xarelto (rivaroxaban), and Eliquis (apixaban) are considered as the major advance in thromboprophylaxis and in the field of anticoagulant therapy.
Value Chain Analysis
The global oral anticoagulant market is segmented into three types which include the indication of the diseases, channels of distribution, and regions. On the basis of the product, the market has been segmented into novel oral anticoagulants and warfarin. Acdeepcording to the indication of the diseases the market is segmented intodeep vein thrombosis/ pulmonary embolism, atrial fibrillation (AF)/ stroke prevention, and others. Based on the channels of distribution the global market is segmented into retail pharmacies, hospital pharmacies, and e-commerce.
Segmentation Overview
The oral anticoagulant market is segmented into three types. On the basis of the indication of the diseases, the thinning medication market is segmented into pulmonary embolism (PE), heart attacks, artificial fibrillation (AF), and others. On the basis of the end-user segments the market, the segmented into retail pharmacy, online pharmacy, hospital pharmacy, and others.
A précising anticoagulant market shares come under the pulmonary embolism (PE) segment, as it is the most economically successful anticoagulant. The pulmonary embolism occurs in the pulmonary arteries of the lungs and it hunks the flow of the blood, this condition is very serious of life-threatening which ultimately triggers other serious health diseases.
The other contributing factors which are associated with pulmonary embolisms such as cancer obesity and heart attack are expected to drive the growth of the market.
The retail pharmacy segments are expected to hold the largest number of shares after the hospital pharmacy. The increased cases of re-filling the prescriptions and the efficient facilities proved by the institutes are the major factors driving the growth of the market.
Regional Analysis
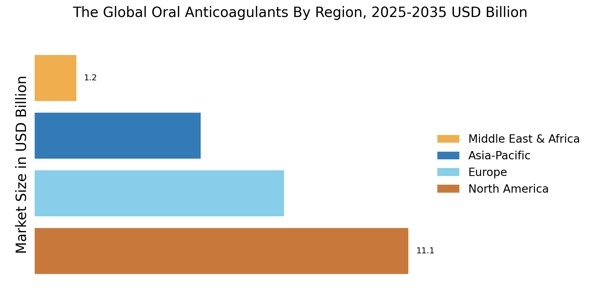
On the basis of the regions, the global oral anticoagulant market is divided into the Americas, Europe, Asia-pacific, and the Middle East and Africa. The global anticoagulant market is expected to influence by the Americas. The increasing rates of cardiovascular disorders and the growth of surgical procedures. The European countries have shown a tremendous amount of growth due to the rising geriatric population in the market. It is estimated that Asia-pacific is the fastest-growing region of the market and the factor contributing to the growth of the market here are the rising populations and increased rates of cardiovascular diseases. The Middle East and Africa hold the least amount of shares as compared to the other regions.
Competitive landscape
The key strategies followed by the key player’s handling in the oral anticoagulant market shares were acquisition, launch, and expansion. Daiichi Sankyo Company Ltd launched oral anticoagulant Lixiana OD Tablets of dosages 15 mg, 30 mg, and 60 mg in 2017. Portola Pharmaceuticals Inc. received FDA approved Betrixaban for the prophylaxis of Venous Thromboembolism (VTE) in adult patients in the 2017and year 2016 Medicure received approval from the US FDA for its new "bolus vial" product.
The major key players of the global oral anticoagulant market are as follows.
Recent developments
Report Overview
The following report comprises of –
Challenges
This report is to point out the high points of the oral anticoagulant markets in terms of the revenue hike by end of the global forecast year 2023.
Market Segmentation
Global Oral Anticoagulants Market, by Product
Global Oral Anticoagulants Market, by Disease Indication
Global Oral Anticoagulants Market, by Distribution Channel
Global Oral Anticoagulants Market, by Region
Report Attribute/Metric | Details |
---|---|
Market Size | 22,561.24 Million |
CAGR | 2017-2023: 12.50% |
Base Year | 2019 |
Forecast Period | 2027 |
Historical Data | 2018 |
Forecast Units | Value (USD Million) |
Report Coverage | Revenue Forecast, Competitive Landscape, Growth Factors, and Trends |
Segments Covered | By Product, Disease Indication, Distribution |
Geographies Covered | North America, Europe, Asia-Pacific, and Rest of the World (RoW) |
Key Vendors | AstraZeneca, Plc (UK), Pfizer (US), Boehringer Ingelheim GmbH (Germany), Daiichi Sankyo Company Ltd (Japan), Abbott Laboratories (US), Eli Lilly and Company (US), laxoSmithKline plc (UK) Portola Pharmaceuticals Inc. (US), Medicure (Canada), Johnson & Johnson Services Inc. (US) |
Key Market Opportunities | Entering Developing Economies |
Key Market Drivers |
|
Frequently Asked Questions (FAQ) :
The global oral anticoagulants market is expected to reach a valuation of USD 22.5 billion by 2023.
The global oral coagulants market is expected to exhibit a strong 12.5% CAGR over the forecast period from 2020 to 2027.
The increasing prevalence of cardiovascular disorders is the major driver for the oral anticoagulants market.
The Americas is expected to dominate the global oral anticoagulants market.
Leading players in the oral anticoagulants market include Eli Lilly, AstraZeneca, GSK, Daiichi Sankyo, and Medicure, among others.