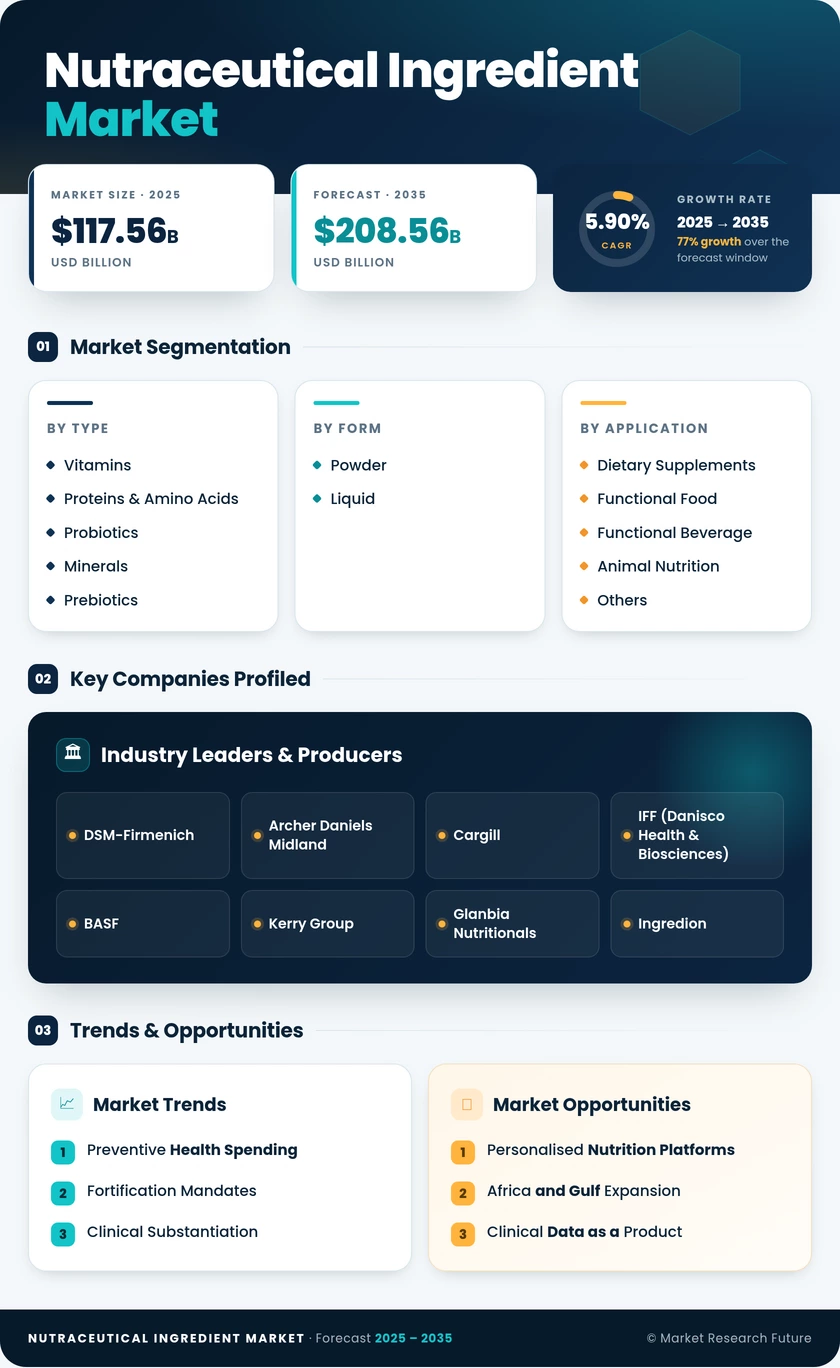
Nutraceutical Ingredient Market (2026 - 2035)

ID: MRFR/HC/21156-HCR 100 Pages Satyendra Maurya Last Updated: September 17, 2026
Nutraceutical Ingredient Market Research Report By Ingredient Type (Vitamins, Minerals, Herbal Extracts, Prebiotics and Probiotics, Specialty Nutrients (Amino Acids, Carotenoids)), By Application (Dietary Supplements, Functional Foods and Beverages, Cosmetics and Personal Care Products, Pharmaceuticals, Pet Food), By Source (Natural, Synthetic, Semi-Synthetic), By End-User Target (Heart Health, Immune System Support, Anti-Aging, Cognitive Function, Digestive Health), By Distribution Channel (Retail Stores, E-commerce, Direct-to-Consumer, Wholesale Distributors, Food and Beverage Manufacturers) and By Regional (North America, Europe, South America, Asia Pacific, Middle East and Africa) - Growth & Industry Forecast 2025 To 2035
Nutraceutical Ingredient Market
Market Size
Forecast Period2026-2035
CAGR (2026-2035)5.90%
2025 Market SizeUSD 117.56 Billion
2035 Market SizeUSD 208.56 Billion
Key Players
DSM-Firmenich
Archer Daniels Midland
Cargill
IFF
BASF
Kerry Group
Opportunities
  • Personalised Nutrition Platforms
  • Africa and Gulf Expansion
  • Clinical Data as a Product
  1. 1 Market Summary |
    1. 1.1 Study Assumptions & Market Definition |
    2. 1.2 Scope of the Study |
    3. 1.3 Research Methodology
  2. 2 Key Report Takeaways |
    1. 2.1 By Product Type |
    2. 2.2 By Application |
    3. 2.3 By Geography
  3. 3 Market Size & Forecast (2021–2035) |
    1. 3.1 Historical Market Size (2021–2024) |
    2. 3.2 Base Year Assessment (2025) |
    3. 3.3 Forecast Market Size (2026–2035) |
    4. 3.4 Year-over-Year Growth Analysis
  4. 4 Driver Impact Analysis |
    1. 4.1 Preventive Health Spending |
    2. 4.2 Fortification Mandates |
    3. 4.3 Clinical Substantiation |
    4. 4.4 Precision Fermentation Economics
  5. 5 Restraints Impact Analysis |
    1. 5.1 Regulatory Fragmentation |
    2. 5.2 Raw Material Volatility |
    3. 5.3 Adulteration and Trust
  6. 6 Opportunities |
    1. 6.1 Personalised Nutrition Platforms |
    2. 6.2 Africa and Gulf Expansion |
    3. 6.3 Clinical Data as a Product |
    4. 6.4 Upcycled and Side-Stream Sourcing |
    5. 6.5 Companion Animal Premiumisation
  7. 7 Regional Market Share & Country-Level Analysis |
    1. 7.1 North America | |
      1. 7.1.1 US | |
      2. 7.1.2 Canada | |
      3. 7.1.3 Mexico |
    2. 7.2 Europe | |
      1. 7.2.1 Germany | |
      2. 7.2.2 UK | |
      3. 7.2.3 France | |
      4. 7.2.4 Italy | |
      5. 7.2.5 Spain | |
      6. 7.2.6 Nordic Countries | |
      7. 7.2.7 Russia | |
      8. 7.2.8 Rest of Europe |
    3. 7.3 Asia-Pacific | |
      1. 7.3.1 China | |
      2. 7.3.2 India | |
      3. 7.3.3 Japan | |
      4. 7.3.4 South Korea | |
      5. 7.3.5 ASEAN | |
      6. 7.3.6 Rest of Asia-Pacific |
    4. 7.4 South America | |
      1. 7.4.1 Brazil | |
      2. 7.4.2 Argentina | |
      3. 7.4.3 Rest of South America |
    5. 7.5 Middle East & Africa | |
      1. 7.5.1 Saudi Arabia | |
      2. 7.5.2 UAE | |
      3. 7.5.3 South Africa | |
      4. 7.5.4 Egypt | |
      5. 7.5.5 Rest of Middle East & Africa
  8. 8 Future Outlook (2026–2035) |
    1. 8.1 Computational Formulation |
    2. 8.2 Platform and Subscription Economics |
    3. 8.3 Sustainability Disclosure as a Purchase Criterion |
    4. 8.4 Convergence with Pharmaceutical Standards
  9. 9 Market Segmentation Analysis |
    1. 9.1 By Product Type | |
      1. 9.1.1 Prebiotics | |
      2. 9.1.2 Probiotics | |
      3. 9.1.3 Vitamins | |
      4. 9.1.4 Minerals | |
      5. 9.1.5 Proteins & Amino Acids | |
      6. 9.1.6 Omega-3 Fatty Acids | |
      7. 9.1.7 Plant Extracts | |
      8. 9.1.8 Others |
    2. 9.2 By Form | |
      1. 9.2.1 Powder | |
      2. 9.2.2 Liquid |
    3. 9.3 By Application | |
      1. 9.3.1 Functional Food | |
      2. 9.3.2 Functional Beverage | |
      3. 9.3.3 Dietary Supplements | |
      4. 9.3.4 Animal Nutrition | |
      5. 9.3.5 Others
  10. 10 Competitive Landscape |
    1. 10.1 Market Concentration Analysis (2026) |
    2. 10.2 Competitive Benchmarking Matrix |
    3. 10.3 Company Profiles | |
      1. 10.3.1 DSM-Firmenich | |
      2. 10.3.2 Archer Daniels Midland | |
      3. 10.3.3 Cargill | |
      4. 10.3.4 IFF (Danisco Health & Biosciences) | |
      5. 10.3.5 BASF | |
      6. 10.3.6 Kerry Group | |
      7. 10.3.7 Glanbia Nutritionals | |
      8. 10.3.8 Ingredion | |
      9. 10.3.9 Tate & Lyle | |
      10. 10.3.10 Lonza | |
      11. 10.3.11 Roquette
  11. 11 Recent News & Developments
  12. 12 Report Scope & Methodology |
    1. 12.1 Study Period & Base Year |
    2. 12.2 Data Sources & Citations |
    3. 12.3 Abbreviations
  13. 13 Detailed Sources & Citations
  14. 14 Frequently Asked Questions (FAQs)
  15. 15 LIST OF TABLES |
  16. TABLE 1 Global Nutraceutical Ingredient Market Size & Forecast, by Revenue (USD Billion), 2021–2035 |
  17. TABLE 2 Global Nutraceutical Ingredient Market – Year-over-Year Growth Analysis, 2021–2035 |
  18. TABLE 3 Driver Impact Analysis Matrix, 2026–2035 |
  19. TABLE 4 Restraint Impact Analysis Matrix, 2026–2035 |
  20. TABLE 5 Global Market Size, by Region, 2021–2035 (USD Billion) |
  21. TABLE 6 North America Market Size, by Country, 2021–2035 (USD Billion) |
  22. TABLE 7 Europe Market Size, by Country, 2021–2035 (USD Billion) |
  23. TABLE 8 Asia-Pacific Market Size, by Country, 2021–2035 (USD Billion) |
  24. TABLE 9 South America Market Size, by Country, 2021–2035 (USD Billion) |
  25. TABLE 10 Middle East & Africa Market Size, by Country, 2021–2035 (USD Billion) |
  26. TABLE 11 Global Market Size, by Product Type, 2021–2035 (USD Billion) |
  27. TABLE 12 Global Market Size, by Form, 2021–2035 (USD Billion) |
  28. TABLE 13 Global Market Size, by Application, 2021–2035 (USD Billion) |
  29. TABLE 14 North America Market Size, by Product Type, 2021–2035 (USD Billion) |
  30. TABLE 15 North America Market Size, by Application, 2021–2035 (USD Billion) |
  31. TABLE 16 Europe Market Size, by Product Type, 2021–2035 (USD Billion) |
  32. TABLE 17 Europe Market Size, by Application, 2021–2035 (USD Billion) |
  33. TABLE 18 Asia-Pacific Market Size, by Product Type, 2021–2035 (USD Billion) |
  34. TABLE 19 Asia-Pacific Market Size, by Application, 2021–2035 (USD Billion) |
  35. TABLE 20 South America Market Size, by Product Type, 2021–2035 (USD Billion) |
  36. TABLE 21 Middle East & Africa Market Size, by Product Type, 2021–2035 (USD Billion) |
  37. TABLE 22 Competitive Benchmarking Matrix, 2026 |
  38. TABLE 23 Company Profiles – Key Players |
  39. TABLE 24 Recent Developments & Strategic Announcements, 2023–2025 |
  40. TABLE 25 Report Scope & Methodology Summary |
  41. TABLE 26 Detailed Sources & Citations Index
  42. 16 LIST OF FIGURES |
  43. FIGURE 1 Market Dynamics Overview – Drivers, Restraints, Opportunities |
  44. FIGURE 2 Industry Value Chain Analysis |
  45. FIGURE 3 Porter's Five Forces Analysis |
  46. FIGURE 4 Global Market Size Trend & Forecast, 2021–2035 (USD Billion) |
  47. FIGURE 5 Year-over-Year Growth Trajectory, 2022–2035 |
  48. FIGURE 6 Market Share by Product Type, 2025 vs 2035 |
  49. FIGURE 7 Market Share by Form, 2025 vs 2035 |
  50. FIGURE 8 Market Share by Application, 2025 vs 2035 |
  51. FIGURE 9 Regional Revenue Share Distribution, 2025 |
  52. FIGURE 10 Regional CAGR Comparison, 2026–2035 |
  53. FIGURE 11 North America Country Share Breakdown, 2025 |
  54. FIGURE 12 Asia-Pacific Country Share Breakdown, 2025 |
  55. FIGURE 13 Competitive Landscape Positioning Map, 2026 |
  56. FIGURE 14 Top Player Revenue Share Ranges, 2026 |
  57. FIGURE 15 Regulatory Milestone Timeline, 2023–2035

Segmentation Quick Reference

DimensionSub-SegmentsDominant SegmentFastest Growing Segment
By Product TypePrebiotics, Probiotics, Vitamins, Minerals, Proteins & Amino Acids, Omega-3 Fatty Acids, Plant Extracts, OthersVitaminsProbiotics
By FormPowder, LiquidPowderLiquid
By ApplicationFunctional Food, Functional Beverage, Dietary Supplements, Animal Nutrition, OthersDietary SupplementsFunctional Beverage
By GeographyNorth America, Europe, Asia-Pacific, South America, Middle East & AfricaAsia-PacificMiddle East & Africa


Market Segmentation Overview

By Product Type

Sub-SegmentKey Trend
PrebioticsSynbiotic pairing with documented strains lifts value per kilogram
ProbioticsShift from generic cultures to trial-backed, spore-forming strains
VitaminsFortification mandates create stable, procurement-led baseload volume.
MineralsChelated and bioavailable forms displace basic inorganic salts.
Proteins & Amino AcidsPlant and precision-fermentation sources gain share against dairy.
Omega-3 Fatty AcidsAlgal sourcing scales as marine supply faces quota pressure.
Plant ExtractsStandardisation and identity testing become pricing differentiators.
OthersEnzymes, carotenoids and specialty carbohydrates fill niche claims.


Product-type competition is bifurcating. Commodity vitamins and minerals compete on cost and supply reliability, while probiotics, standardised extracts and specialty lipids compete on documented outcomes — and only the latter group is expanding gross margin.

By Form

Sub-SegmentKey Trend
PowderDominant on shipping economics, ambient stability and tableting compatibility
LiquidGrowing fastest on beverage fortification and pediatric dosing convenience


Form choice increasingly follows the retail format rather than the active itself. As ready-to-drink formats expand, suppliers are investing in emulsification and taste-masking technology to convert powder-native actives into clear, stable liquid systems.

By Application

Sub-SegmentKey Trend
Functional FoodMainstream reformulation pushes actives into bakery, dairy and snacks
Functional BeverageGut-health and cognitive positioning drives the fastest application growth.
Dietary SupplementsLargest share on higher active loadings and rapid claim iteration
Animal NutritionAntibiotic replacement and companion premiumisation sustain demand.
OthersMedical foods and infant nutrition demand pharmaceutical-grade documentation


Application mix determines technical specification more than any other variable. Supplement formats tolerate high loadings and imperfect solubility; beverages and medical foods do not, which is why the same active can trade at materially different prices depending on where it lands.




Download PDF ×

We do not share your information with anyone. However, we may send you emails based on your report interest from time to time. You may contact us at any time to opt-out.