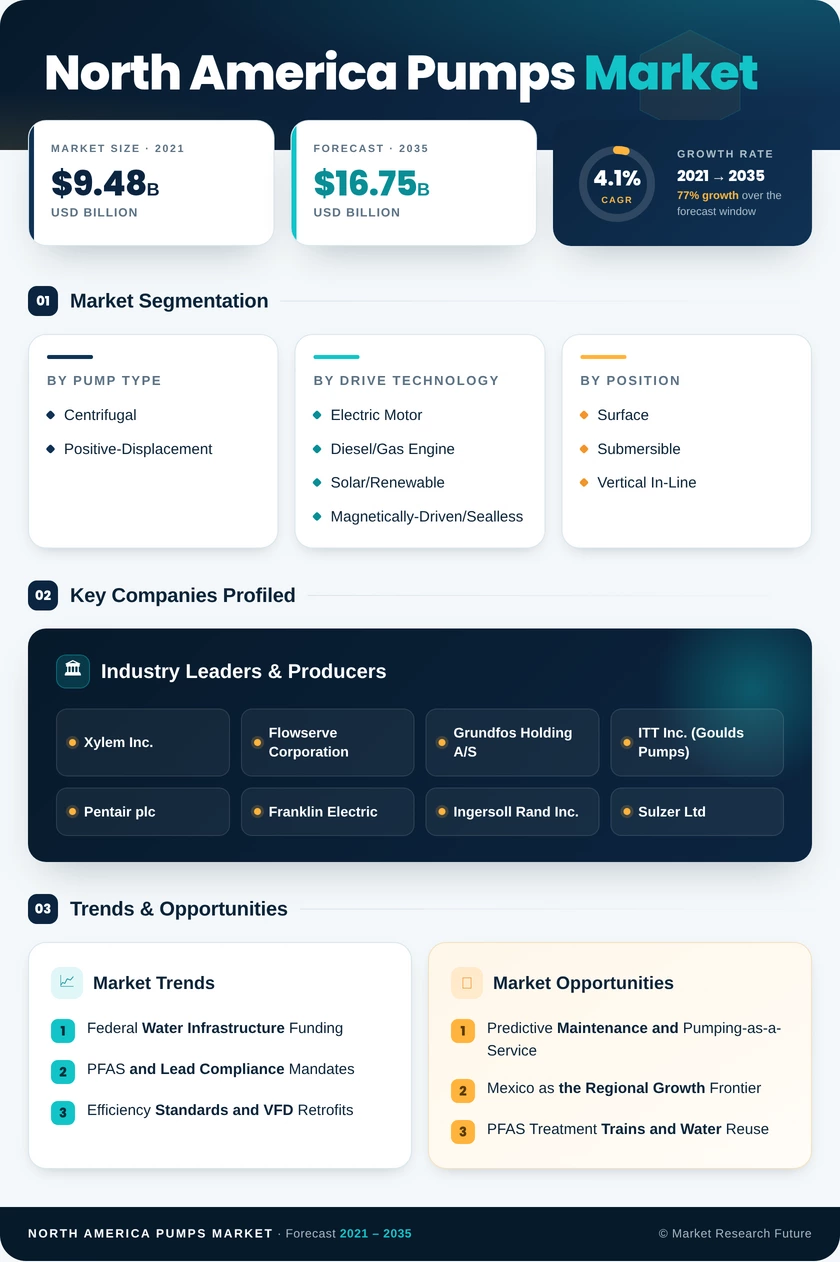
North America Pumps Market (2026 - 2035)

ID: MRFR/EnP/53942-HCR 200 Pages Garvit Vyas Last Updated: October 12, 2026
North America Pumps Market Research Report By Pump Type (Centrifugal, Positive-Displacement), By Drive Technology (Electric Motor, Diesel/Gas Engine, Solar/Renewable, Magnetically-Driven/Sealless), By Position (Surface, Submersible, Vertical In-Line), By Application (Water and Wastewater, Chemical and Petrochemical, HVAC and Building Services, Oil and Gas (Upstream, Midstream, Downstream), Food and Beverage, Mining and Metals, Power Generation (Thermal, Nuclear, Renewables), Pharmaceuticals and Biotech, Others) - Forecast to 2035
North America Pumps Market
Market Size
Forecast Period2026-2035
CAGR (2026-2035)4.1%
2025 Market SizeUSD 11.21 Billion
2035 Market SizeUSD 16.75 Billion
Key Players
Xylem Inc.
Flowserve Corporation
Grundfos Holding A/S
ITT Inc.
Pentair plc
Franklin Electric
Opportunities
  • Predictive Maintenance and Pumping-as-a-Service
  • Mexico as the Regional Growth Frontier
  • PFAS Treatment Trains and Water Reuse
  1. 1 Market Summary | |
  2. 2 Key Report Takeaways | |
    1. 2.1 By Pump Type | |
    2. 2.2 By Drive Technology | |
    3. 2.3 By Position | |
    4. 2.4 By Application | |
    5. 2.5 By Region | |
  3. 3 Market Size and Forecast (2021–2035) | |
  4. 4 Driver Impact Analysis | |
    1. 4.1 Federal Water Infrastructure Funding | |
    2. 4.2 PFAS and Lead Compliance Mandates | |
    3. 4.3 Efficiency Standards and VFD Retrofits | |
    4. 4.4 LNG Export and Midstream Expansion | |
    5. 4.5 Data Center and Commercial Cooling Loads | |
    6. 4.6 Nearshoring and Mexican Industrial Build-Out | |
  5. 5 Restraints Impact Analysis | |
    1. 5.1 Steel and Alloy Cost Volatility and Tariffs | |
    2. 5.2 Utility Workforce Shortages | |
    3. 5.3 Long Replacement Cycles and Repair-First Spending | |
    4. 5.4 Municipal Affordability and Budget Gaps | |
    5. 5.5 Low-Cost Import Competition | |
  6. 6 Opportunities | |
    1. 6.1 Predictive Maintenance and Pumping-as-a-Service | |
    2. 6.2 Mexico as the Regional Growth Frontier | |
    3. 6.3 PFAS Treatment Trains and Water Reuse | |
    4. 6.4 Solar Pumping for Agriculture and Remote Sites | |
    5. 6.5 Data Center Liquid Cooling | |
  7. 7 Regional Market Share and Country-Level Analysis | |
    1. 7.1 United States | |
    2. 7.2 Canada | |
    3. 7.3 Mexico | |
  8. 8 Future Outlook (2026–2035) | |
    1. 8.1 AI-Enabled Monitoring and Digital Twins | |
    2. 8.2 Electrification and Motor Efficiency | |
    3. 8.3 Water Reuse and Desalination | |
    4. 8.4 Emissions Rules and Sustainability Reporting | |
  9. 9 Segmentation Analysis | |
    1. 9.1 By Pump Type | | |
      1. 9.1.1 Centrifugal | | |
      2. 9.1.2 Positive-Displacement | |
    2. 9.2 By Drive Technology | | |
      1. 9.2.1 Electric Motor | | |
      2. 9.2.2 Diesel/Gas Engine | | |
      3. 9.2.3 Solar/Renewable | | |
      4. 9.2.4 Magnetically-Driven/Sealless | |
    3. 9.3 By Position | | |
      1. 9.3.1 Surface | | |
      2. 9.3.2 Submersible | | |
      3. 9.3.3 Vertical In-Line | |
    4. 9.4 By Application | | |
      1. 9.4.1 Water and Wastewater | | |
      2. 9.4.2 Chemical and Petrochemical | | |
      3. 9.4.3 HVAC and Building Services | | |
      4. 9.4.4 Oil and Gas (Upstream, Midstream, Downstream) | | |
      5. 9.4.5 Food and Beverage | | |
      6. 9.4.6 Mining and Metals | | |
      7. 9.4.7 Power Generation (Thermal, Nuclear, Renewables) | | |
      8. 9.4.8 Pharmaceuticals and Biotech | | |
      9. 9.4.9 Others | |
  10. 10 Competitive Landscape | |
  11. 11 Recent News & Developments | |
  12. 12 Report Scope and Methodology | |
  13. 13 Detailed Sources and Citations | |
  14. 14 Frequently Asked Questions (FAQs) | | LIST OF TABLES | |
  15. TABLE 1 Market Snapshot — Key Metrics, 2025–2035 | |
  16. TABLE 2 Market Size & Forecast, by Revenue (USD Billion), 2021–2035 | |
  17. TABLE 3 Driver Impact Analysis | |
  18. TABLE 4 Restraints Impact Analysis | |
  19. TABLE 5 Regional Summary, by Country, 2025 | |
  20. TABLE 6 United States Market, by Sub-Region, 2025 | |
  21. TABLE 7 Canada Market, by Sub-Region, 2025 | |
  22. TABLE 8 Mexico Market, by Sub-Region, 2025 | |
  23. TABLE 9 Market Size, by Pump Type, 2025 | |
  24. TABLE 10 Market Size, by Drive Technology, 2025 | |
  25. TABLE 11 Market Size, by Position, 2025 | |
  26. TABLE 12 Market Size, by Application, 2025 | |
  27. TABLE 13 Competitive Benchmarking Matrix, 2025 | |
  28. TABLE 14 Report Scope and Methodology | |
  29. TABLE 15 Detailed Sources and Citations | |
  30. TABLE 16 Segmentation Quick Reference | | LIST OF FIGURES | |
  31. FIGURE 1 Market Dynamics — Drivers, Restraints and Opportunities | |
  32. FIGURE 2 Industry Value Chain Analysis | |
  33. FIGURE 3 Porter's Five Forces Analysis | |
  34. FIGURE 4 Market Size Trend (USD Billion), 2021–2035 | |
  35. FIGURE 5 Market Share, by Pump Type, 2025 | |
  36. FIGURE 6 Market Share, by Drive Technology, 2025 | |
  37. FIGURE 7 Market Share, by Position, 2025 | |
  38. FIGURE 8 Market Share, by Application, 2025 | |
  39. FIGURE 9 Market Share, by Country, 2025 | |
  40. FIGURE 10 Competitive Landscape — Estimated Revenue Share Ranges, 2025

Segmentation Quick Reference

DimensionSub-SegmentsDominant SegmentFastest Growing Segment
By Pump TypeCentrifugal; Positive-DisplacementCentrifugal (57.0%)Centrifugal (57.0%)
By Drive TechnologyElectric Motor; Diesel/Gas Engine; Solar/Renewable; Magnetically-Driven/SeallessElectric Motor (66.5%)Solar/Renewable (6.1% CAGR)
By PositionSurface; Submersible; Vertical In-LineSurface (55.4%)Submersible (6.7% CAGR)
By ApplicationWater and Wastewater; Chemical and Petrochemical; HVAC and Building Services; Oil and Gas (Upstream, Midstream, Downstream); Food and Beverage; Mining and Metals; Power Generation (Thermal, Nuclear, Renewables); Pharmaceuticals and Biotech; OthersWater and Wastewater (5.4% CAGR)Water and Wastewater (5.4% CAGR)
By RegionUnited States; Canada; MexicoUnited States (80.5% share)Mexico (5.3% CAGR)


Market Segmentation Overview

By Pump Type

Sub-SegmentKey Trend
CentrifugalVFD-paired ANSI and split-case units dominate municipal tenders
Positive-DisplacementProgressive-cavity and peristaltic models hold metering and viscous duties


Centrifugal pumps lead the dimension and also grow faster, because utilities and building owners pair them with variable-frequency drives to meet federal efficiency rules. Positive-Displacement units keep their place in chemical dosing, polymer injection and biopharma, where accurate flow and low shear outweigh peak efficiency. That balance makes Positive-Displacement a steady, margin-rich niche rather than a share gainer.

By Drive Technology

Sub-SegmentKey Trend
Electric MotorPremium-efficiency and permanent-magnet motors with integrated drives
Diesel/Gas EngineRetreating to remote oilfields and fire protection
Solar/RenewableGrant-funded growth in off-grid irrigation and livestock watering
Magnetically-Driven/SeallessAdoption in zero-leak chemical and semiconductor service


Electric Motor drives hold the largest share because grid power and VFD retrofits deliver the lowest operating cost on most sites. Solar/Renewable drives grow fastest as USDA REAP grants cover up to half of project costs for ranches in the Southwest. Diesel/Gas Engine units lose ground to fuel logistics and emissions limits, while Magnetically-Driven/Sealless pumps gain from methane and VOC regulations.

By Position

Sub-SegmentKey Trend
SurfaceEasy-access units for treatment plants and process lines
SubmersibleDeep dewatering in copper and lithium mines; lift stations
Vertical In-LineCompact HVAC loops in high-rise and data center buildings


Surface pumps lead because treatment plants and refineries value maintenance access and modular replacement. Submersible models grow fastest as mines in Nevada and Arizona go deeper and need units that run below the waterline without cavitation. Vertical In-Line pumps remain the standard where floor space is tight, especially in high-rise mechanical rooms.

By Application

Sub-SegmentKey Trend
Water and WastewaterPFAS treatment retrofits and lead service line work
Chemical and PetrochemicalAPI 610 replacements with dual-seal emissions plans
HVAC and Building ServicesECM circulators and liquid cooling for data centers
Oil and Gas (Upstream, Midstream, Downstream)LNG terminals and Permian produced-water handling
Food and Beverage3-A hygienic designs for dairy and beverage plants
Mining and MetalsHigh-pressure tailings and slurry pumping
Power Generation (Thermal, Nuclear, Renewables)Nuclear life extension and boiler feed upgrades
Pharmaceuticals and BiotechSingle-use and sealless pumps for continuous processing
OthersAgriculture, pulp and paper, marine duties


Water and Wastewater is the largest and fastest-growing application, driven by PFAS limits, lead rules and federal State Revolving Fund money. Chemical and Petrochemical ranks next as operators replace aging API pumps to meet fugitive-emission limits. Pharmaceuticals and Biotech is small but grows quickly, as continuous manufacturing favors single-use and sealless designs over conventional sanitary pumps.


Download PDF ×

We do not share your information with anyone. However, we may send you emails based on your report interest from time to time. You may contact us at any time to opt-out.