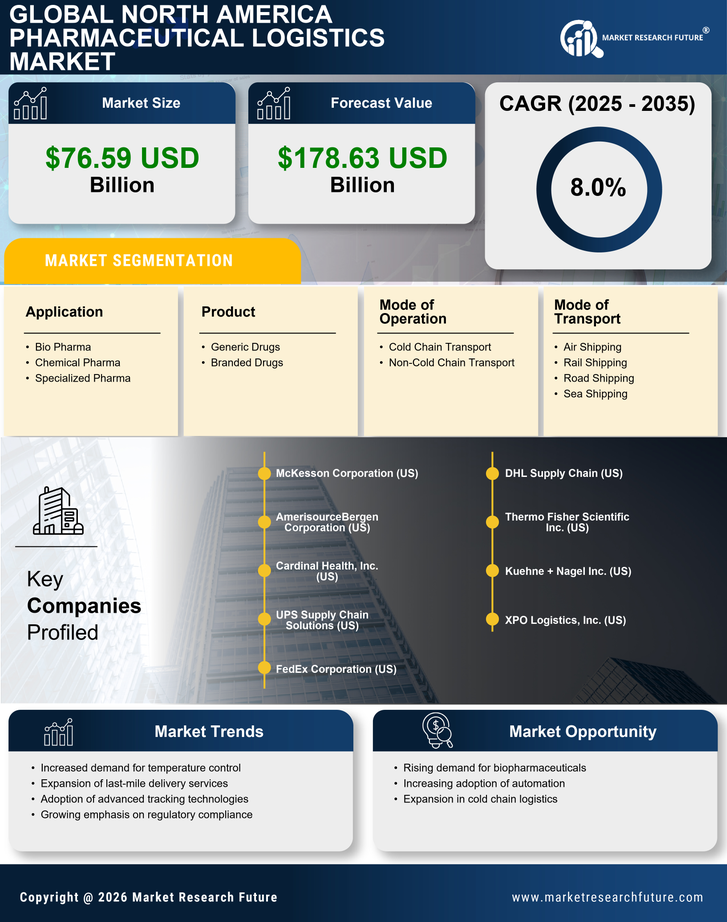
Request Free Sample ×

Kindly complete the form below to receive a free sample of this Report

* Please use a valid business email

Leading companies partner with us for data-driven Insights

clients tt-cursor
Hero Background

North America Pharmaceutical Logistics Market

ID: MRFR/PCM/19933-HCR
128 Pages
Pradeep Nandi
Last Updated: April 06, 2026

North America Pharmaceutical Logistics Market Research Report Information By Product (Generic Drugs, Branded Drugs), By Mode of Operation (Cold Chain Transport, Non-Cold Chain Transport), By Application (Bio Pharma, Chemical Pharma, Specialized Pharma), By Mode of Transport (Air Shipping, Rail Shipping, Road Shipping, Sea Shipping)–and North America Market Forecast Till 2035

Share:
Download PDF ×

We do not share your information with anyone. However, we may send you emails based on your report interest from time to time. You may contact us at any time to opt-out.

North America Pharmaceutical Logistics Market Infographic
Purchase Options
  1. 1 SECTION I: EXECUTIVE SUMMARY AND KEY HIGHLIGHTS
  2.   1.1 EXECUTIVE SUMMARY
  3.     1.1.1 Market Overview
  4.     1.1.2 Key Findings
  5.     1.1.3 Market Segmentation
  6.     1.1.4 Competitive Landscape
  7.     1.1.5 Challenges and Opportunities
  8.     1.1.6 Future Outlook
  9. 2 SECTION II: SCOPING, METHODOLOGY AND MARKET STRUCTURE
  10.   2.1 MARKET INTRODUCTION
  11.     2.1.1 Definition
  12.     2.1.2 Scope of the study
  13.       2.1.2.1 Research Objective
  14.       2.1.2.2 Assumption
  15.       2.1.2.3 Limitations
  16.   2.2 RESEARCH METHODOLOGY
  17.     2.2.1 Overview
  18.     2.2.2 Data Mining
  19.     2.2.3 Secondary Research
  20.     2.2.4 Primary Research
  21.       2.2.4.1 Primary Interviews and Information Gathering Process
  22.       2.2.4.2 Breakdown of Primary Respondents
  23.     2.2.5 Forecasting Model
  24.     2.2.6 Market Size Estimation
  25.       2.2.6.1 Bottom-Up Approach
  26.       2.2.6.2 Top-Down Approach
  27.     2.2.7 Data Triangulation
  28.     2.2.8 Validation
  29. 3 SECTION III: QUALITATIVE ANALYSIS
  30.   3.1 MARKET DYNAMICS
  31.     3.1.1 Overview
  32.     3.1.2 Drivers
  33.     3.1.3 Restraints
  34.     3.1.4 Opportunities
  35.   3.2 MARKET FACTOR ANALYSIS
  36.     3.2.1 Value chain Analysis
  37.     3.2.2 Porter's Five Forces Analysis
  38.       3.2.2.1 Bargaining Power of Suppliers
  39.       3.2.2.2 Bargaining Power of Buyers
  40.       3.2.2.3 Threat of New Entrants
  41.       3.2.2.4 Threat of Substitutes
  42.       3.2.2.5 Intensity of Rivalry
  43.     3.2.3 COVID-19 Impact Analysis
  44.       3.2.3.1 Market Impact Analysis
  45.       3.2.3.2 Regional Impact
  46.       3.2.3.3 Opportunity and Threat Analysis
  47. 4 SECTION IV: QUANTITATIVE ANALYSIS
  48.   4.1 Packaging & Transport, BY Application (USD Billion)
  49.     4.1.1 Cold Chain Logistics
  50.     4.1.2 Non-Cold Chain Logistics
  51.     4.1.3 Pharmaceutical Warehousing
  52.     4.1.4 Transportation Management
  53.   4.2 Packaging & Transport, BY End Use (USD Billion)
  54.     4.2.1 Pharmaceutical Manufacturers
  55.     4.2.2 Contract Research Organizations
  56.     4.2.3 Third Party Logistics Providers
  57.     4.2.4 Healthcare Institutions
  58.   4.3 Packaging & Transport, BY Mode of Transportation (USD Billion)
  59.     4.3.1 Air Freight
  60.     4.3.2 Sea Freight
  61.     4.3.3 Road Freight
  62.     4.3.4 Rail Freight
  63.   4.4 Packaging & Transport, BY Temperature Control (USD Billion)
  64.     4.4.1 Ambient Temperature
  65.     4.4.2 Refrigerated Temperature
  66.     4.4.3 Frozen Temperature
  67.   4.5 Packaging & Transport, BY Service Type (USD Billion)
  68.     4.5.1 Transportation Services
  69.     4.5.2 Warehousing Services
  70.     4.5.3 Distribution Services
  71.     4.5.4 Inventory Management
  72. 5 SECTION V: COMPETITIVE ANALYSIS
  73.   5.1 Competitive Landscape
  74.     5.1.1 Overview
  75.     5.1.2 Competitive Analysis
  76.     5.1.3 Market share Analysis
  77.     5.1.4 Major Growth Strategy in the Packaging & Transport
  78.     5.1.5 Competitive Benchmarking
  79.     5.1.6 Leading Players in Terms of Number of Developments in the Packaging & Transport
  80.     5.1.7 Key developments and growth strategies
  81.       5.1.7.1 New Product Launch/Service Deployment
  82.       5.1.7.2 Merger & Acquisitions
  83.       5.1.7.3 Joint Ventures
  84.     5.1.8 Major Players Financial Matrix
  85.       5.1.8.1 Sales and Operating Income
  86.       5.1.8.2 Major Players R&D Expenditure. 2023
  87.   5.2 Company Profiles
  88.     5.2.1 McKesson Corporation (US)
  89.       5.2.1.1 Financial Overview
  90.       5.2.1.2 Products Offered
  91.       5.2.1.3 Key Developments
  92.       5.2.1.4 SWOT Analysis
  93.       5.2.1.5 Key Strategies
  94.     5.2.2 AmerisourceBergen Corporation (US)
  95.       5.2.2.1 Financial Overview
  96.       5.2.2.2 Products Offered
  97.       5.2.2.3 Key Developments
  98.       5.2.2.4 SWOT Analysis
  99.       5.2.2.5 Key Strategies
  100.     5.2.3 Cardinal Health, Inc. (US)
  101.       5.2.3.1 Financial Overview
  102.       5.2.3.2 Products Offered
  103.       5.2.3.3 Key Developments
  104.       5.2.3.4 SWOT Analysis
  105.       5.2.3.5 Key Strategies
  106.     5.2.4 UPS Healthcare (US)
  107.       5.2.4.1 Financial Overview
  108.       5.2.4.2 Products Offered
  109.       5.2.4.3 Key Developments
  110.       5.2.4.4 SWOT Analysis
  111.       5.2.4.5 Key Strategies
  112.     5.2.5 FedEx Corporation (US)
  113.       5.2.5.1 Financial Overview
  114.       5.2.5.2 Products Offered
  115.       5.2.5.3 Key Developments
  116.       5.2.5.4 SWOT Analysis
  117.       5.2.5.5 Key Strategies
  118.     5.2.6 DHL Supply Chain (US)
  119.       5.2.6.1 Financial Overview
  120.       5.2.6.2 Products Offered
  121.       5.2.6.3 Key Developments
  122.       5.2.6.4 SWOT Analysis
  123.       5.2.6.5 Key Strategies
  124.     5.2.7 Thermo Fisher Scientific Inc. (US)
  125.       5.2.7.1 Financial Overview
  126.       5.2.7.2 Products Offered
  127.       5.2.7.3 Key Developments
  128.       5.2.7.4 SWOT Analysis
  129.       5.2.7.5 Key Strategies
  130.     5.2.8 Panalpina (US)
  131.       5.2.8.1 Financial Overview
  132.       5.2.8.2 Products Offered
  133.       5.2.8.3 Key Developments
  134.       5.2.8.4 SWOT Analysis
  135.       5.2.8.5 Key Strategies
  136.   5.3 Appendix
  137.     5.3.1 References
  138.     5.3.2 Related Reports
  139. 6 LIST OF FIGURES
  140.   6.1 MARKET SYNOPSIS
  141.   6.2 NORTH AMERICA MARKET ANALYSIS BY APPLICATION
  142.   6.3 NORTH AMERICA MARKET ANALYSIS BY END USE
  143.   6.4 NORTH AMERICA MARKET ANALYSIS BY MODE OF TRANSPORTATION
  144.   6.5 NORTH AMERICA MARKET ANALYSIS BY TEMPERATURE CONTROL
  145.   6.6 NORTH AMERICA MARKET ANALYSIS BY SERVICE TYPE
  146.   6.7 KEY BUYING CRITERIA OF PACKAGING & TRANSPORT
  147.   6.8 RESEARCH PROCESS OF MRFR
  148.   6.9 DRO ANALYSIS OF PACKAGING & TRANSPORT
  149.   6.10 DRIVERS IMPACT ANALYSIS: PACKAGING & TRANSPORT
  150.   6.11 RESTRAINTS IMPACT ANALYSIS: PACKAGING & TRANSPORT
  151.   6.12 SUPPLY / VALUE CHAIN: PACKAGING & TRANSPORT
  152.   6.13 PACKAGING & TRANSPORT, BY APPLICATION, 2024 (% SHARE)
  153.   6.14 PACKAGING & TRANSPORT, BY APPLICATION, 2024 TO 2035 (USD Billion)
  154.   6.15 PACKAGING & TRANSPORT, BY END USE, 2024 (% SHARE)
  155.   6.16 PACKAGING & TRANSPORT, BY END USE, 2024 TO 2035 (USD Billion)
  156.   6.17 PACKAGING & TRANSPORT, BY MODE OF TRANSPORTATION, 2024 (% SHARE)
  157.   6.18 PACKAGING & TRANSPORT, BY MODE OF TRANSPORTATION, 2024 TO 2035 (USD Billion)
  158.   6.19 PACKAGING & TRANSPORT, BY TEMPERATURE CONTROL, 2024 (% SHARE)
  159.   6.20 PACKAGING & TRANSPORT, BY TEMPERATURE CONTROL, 2024 TO 2035 (USD Billion)
  160.   6.21 PACKAGING & TRANSPORT, BY SERVICE TYPE, 2024 (% SHARE)
  161.   6.22 PACKAGING & TRANSPORT, BY SERVICE TYPE, 2024 TO 2035 (USD Billion)
  162.   6.23 BENCHMARKING OF MAJOR COMPETITORS
  163. 7 LIST OF TABLES
  164.   7.1 LIST OF ASSUMPTIONS
  165.     7.1.1
  166.   7.2 North America MARKET SIZE ESTIMATES; FORECAST
  167.     7.2.1 BY APPLICATION, 2026-2035 (USD Billion)
  168.     7.2.2 BY END USE, 2026-2035 (USD Billion)
  169.     7.2.3 BY MODE OF TRANSPORTATION, 2026-2035 (USD Billion)
  170.     7.2.4 BY TEMPERATURE CONTROL, 2026-2035 (USD Billion)
  171.     7.2.5 BY SERVICE TYPE, 2026-2035 (USD Billion)
  172.   7.3 PRODUCT LAUNCH/PRODUCT DEVELOPMENT/APPROVAL
  173.     7.3.1
  174.   7.4 ACQUISITION/PARTNERSHIP
  175.     7.4.1

North America Packaging & Transport Market Segmentation

Packaging & Transport By Application (USD Billion, 2026-2035)

  • Cold Chain Logistics
  • Non-Cold Chain Logistics
  • Pharmaceutical Warehousing
  • Transportation Management

Packaging & Transport By End Use (USD Billion, 2026-2035)

  • Pharmaceutical Manufacturers
  • Contract Research Organizations
  • Third Party Logistics Providers
  • Healthcare Institutions

Packaging & Transport By Mode of Transportation (USD Billion, 2026-2035)

  • Air Freight
  • Sea Freight
  • Road Freight
  • Rail Freight

Packaging & Transport By Temperature Control (USD Billion, 2026-2035)

  • Ambient Temperature
  • Refrigerated Temperature
  • Frozen Temperature

Packaging & Transport By Service Type (USD Billion, 2026-2035)

  • Transportation Services
  • Warehousing Services
  • Distribution Services
  • Inventory Management

Compare Licence

×
Features License Type
Single User Multiuser License Enterprise User
Price $4,950 $5,950 $7,250
Maximum User Access Limit 1 User Upto 10 Users Unrestricted Access Throughout the Organization
Free Customization
Direct Access to Analyst
Deliverable Format
Platform Access
Discount on Next Purchase 10% 15% 15%
Printable Versions