Request Free Sample ×

Kindly complete the form below to receive a free sample of this Report

* Please use a valid business email

Leading companies partner with us for data-driven Insights

clients tt-cursor
Hero Background

North America Industrial Labels Market

ID: MRFR/PCM/20605-CR
100 Pages
Snehal Singh
Last Updated: April 03, 2026

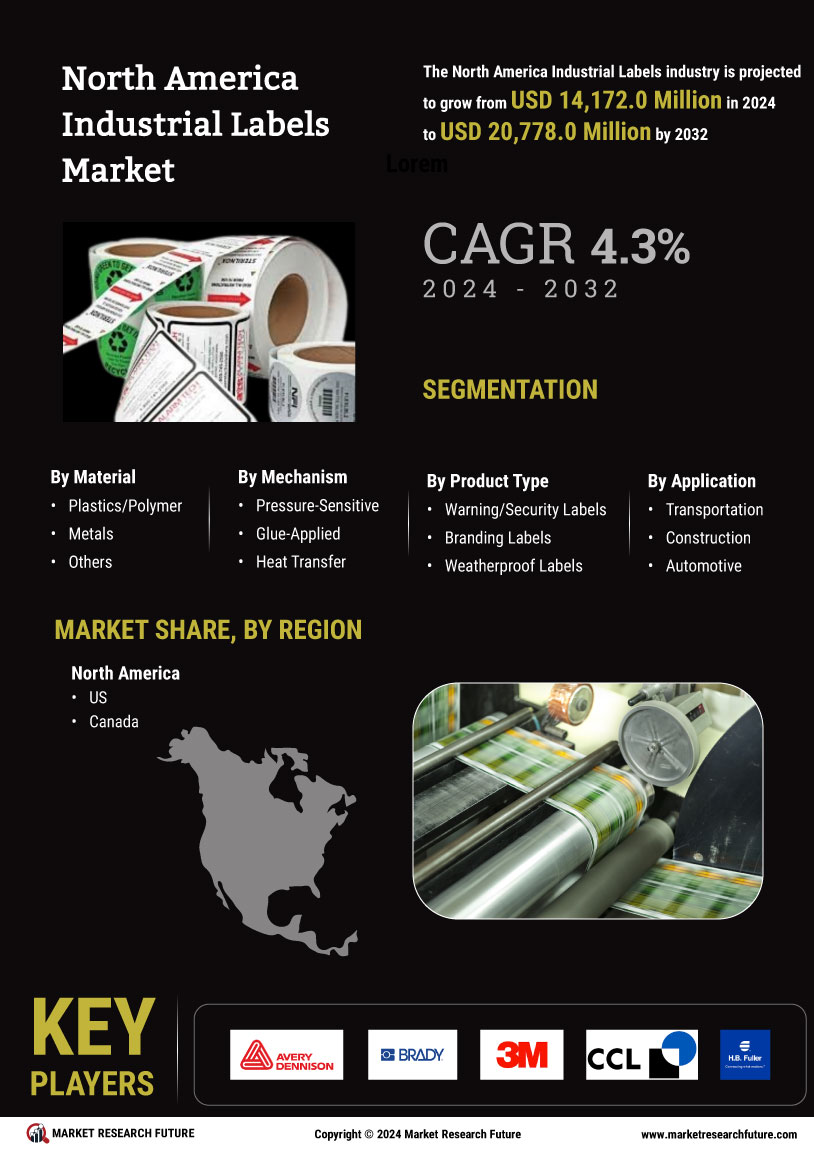
North America Industrial Labels Market Research Report Information by Material (Plastics/Polymer, Metals and Others), by Mechanism (Pressure-Sensitive, Glue-Applied, Heat Transfer, And Others), by Product Type (Warning/Security Labels, Branding Labels, Weatherproof Labels, Equipment Asset Tag, and Other Product Types), by Application (Transportation, Construction, Automotive, Consumer Durables, Agriculture, and Others), by Printing Technology (Flexography, Offset, Digital Printing, Screen Printing, and Others), and by Region (US and Canada) –Market Forecast Till 2035

Share:
Download PDF ×

We do not share your information with anyone. However, we may send you emails based on your report interest from time to time. You may contact us at any time to opt-out.

North America Industrial Labels Market Infographic
Purchase Options
  1. SECTION I: EXECUTIVE SUMMARY AND KEY HIGHLIGHTS |
    1. 1.1 EXECUTIVE SUMMARY | |
      1. 1.1.1 Market Overview | |
      2. 1.1.2 Key Findings | |
      3. 1.1.3 Market Segmentation | |
      4. 1.1.4 Competitive Landscape | |
      5. 1.1.5 Challenges and Opportunities | |
      6. 1.1.6 Future Outlook 2
  2. SECTION II: SCOPING, METHODOLOGY AND MARKET STRUCTURE |
    1. 2.1 MARKET INTRODUCTION | |
      1. 2.1.1 Definition | |
      2. 2.1.2 Scope of the study | | |
        1. 2.1.2.1 Research Objective | | |
        2. 2.1.2.2 Assumption | | |
        3. 2.1.2.3 Limitations |
    2. 2.2 RESEARCH METHODOLOGY | |
      1. 2.2.1 Overview | |
      2. 2.2.2 Data Mining | |
      3. 2.2.3 Secondary Research | |
      4. 2.2.4 Primary Research | | |
        1. 2.2.4.1 Primary Interviews and Information Gathering Process | | |
        2. 2.2.4.2 Breakdown of Primary Respondents | |
      5. 2.2.5 Forecasting Model | |
      6. 2.2.6 Market Size Estimation | | |
        1. 2.2.6.1 Bottom-Up Approach | | |
        2. 2.2.6.2 Top-Down Approach | |
      7. 2.2.7 Data Triangulation | |
      8. 2.2.8 Validation 3
  3. SECTION III: QUALITATIVE ANALYSIS |
    1. 3.1 MARKET DYNAMICS | |
      1. 3.1.1 Overview | |
      2. 3.1.2 Drivers | |
      3. 3.1.3 Restraints | |
      4. 3.1.4 Opportunities |
    2. 3.2 MARKET FACTOR ANALYSIS | |
      1. 3.2.1 Value chain Analysis | |
      2. 3.2.2 Porter's Five Forces Analysis | | |
        1. 3.2.2.1 Bargaining Power of Suppliers | | |
        2. 3.2.2.2 Bargaining Power of Buyers | | |
        3. 3.2.2.3 Threat of New Entrants | | |
        4. 3.2.2.4 Threat of Substitutes | | |
        5. 3.2.2.5 Intensity of Rivalry | |
      3. 3.2.3 COVID-19 Impact Analysis | | |
        1. 3.2.3.1 Market Impact Analysis | | |
        2. 3.2.3.2 Regional Impact | | |
        3. 3.2.3.3 Opportunity and Threat Analysis 4
  4. SECTION IV: QUANTITATIVE ANALYSIS |
    1. 4.1 Packaging & Transport, BY Material (USD Million) | |
      1. 4.1.1 Metal | |
      2. 4.1.2 Polymer | |
      3. 4.1.3 Others |
    2. 4.2 Packaging & Transport, BY Mechanism (USD Million) | |
      1. 4.2.1 Pressure-sensitive | |
      2. 4.2.2 Glue-applied | |
      3. 4.2.3 Heat Transfer | |
      4. 4.2.4 Others |
    3. 4.3 Packaging & Transport, BY Application (USD Million) | |
      1. 4.3.1 Transportation | |
      2. 4.3.2 Construction | |
      3. 4.3.3 Automotive | |
      4. 4.3.4 Consumer Durables | |
      5. 4.3.5 Others 5
  5. SECTION V: COMPETITIVE ANALYSIS |
    1. 5.1 Competitive Landscape | |
      1. 5.1.1 Overview | |
      2. 5.1.2 Competitive Analysis | |
      3. 5.1.3 Market share Analysis | |
      4. 5.1.4 Major Growth Strategy in the Packaging & Transport | |
      5. 5.1.5 Competitive Benchmarking | |
      6. 5.1.6 Leading Players in Terms of Number of Developments in the Packaging & Transport | |
      7. 5.1.7 Key developments and growth strategies | | |
        1. 5.1.7.1 New Product Launch/Service Deployment | | |
        2. 5.1.7.2 Merger & Acquisitions | | |
        3. 5.1.7.3 Joint Ventures | |
      8. 5.1.8 Major Players Financial Matrix | | |
        1. 5.1.8.1 Sales and Operating Income | | |
        2. 5.1.8.2 Major Players R&D Expenditure. 2023 |
    2. 5.2 Company Profiles | |
      1. 5.2.1 Avery Dennison (US) | | |
        1. 5.2.1.1 Financial Overview | | |
        2. 5.2.1.2 Products Offered | | |
        3. 5.2.1.3 Key Developments | | |
        4. 5.2.1.4 SWOT Analysis | | |
        5. 5.2.1.5 Key Strategies | |
      2. 5.2.2 Brady Corporation (US) | | |
        1. 5.2.2.1 Financial Overview | | |
        2. 5.2.2.2 Products Offered | | |
        3. 5.2.2.3 Key Developments | | |
        4. 5.2.2.4 SWOT Analysis | | |
        5. 5.2.2.5 Key Strategies | |
      3. 5.2.3 CCL Industries (CA) | | |
        1. 5.2.3.1 Financial Overview | | |
        2. 5.2.3.2 Products Offered | | |
        3. 5.2.3.3 Key Developments | | |
        4. 5.2.3.4 SWOT Analysis | | |
        5. 5.2.3.5 Key Strategies | |
      4. 5.2.4 SATO Holdings Corporation (JP) | | |
        1. 5.2.4.1 Financial Overview | | |
        2. 5.2.4.2 Products Offered | | |
        3. 5.2.4.3 Key Developments | | |
        4. 5.2.4.4 SWOT Analysis | | |
        5. 5.2.4.5 Key Strategies | |
      5. 5.2.5 UPM Raflatac (FI) | | |
        1. 5.2.5.1 Financial Overview | | |
        2. 5.2.5.2 Products Offered | | |
        3. 5.2.5.3 Key Developments | | |
        4. 5.2.5.4 SWOT Analysis | | |
        5. 5.2.5.5 Key Strategies | |
      6. 5.2.6 Mactac (US) | | |
        1. 5.2.6.1 Financial Overview | | |
        2. 5.2.6.2 Products Offered | | |
        3. 5.2.6.3 Key Developments | | |
        4. 5.2.6.4 SWOT Analysis | | |
        5. 5.2.6.5 Key Strategies | |
      7. 5.2.7 Labelmakers (AU) | | |
        1. 5.2.7.1 Financial Overview | | |
        2. 5.2.7.2 Products Offered | | |
        3. 5.2.7.3 Key Developments | | |
        4. 5.2.7.4 SWOT Analysis | | |
        5. 5.2.7.5 Key Strategies | |
      8. 5.2.8 Schreiner Group (DE) | | |
        1. 5.2.8.1 Financial Overview | | |
        2. 5.2.8.2 Products Offered | | |
        3. 5.2.8.3 Key Developments | | |
        4. 5.2.8.4 SWOT Analysis | | |
        5. 5.2.8.5 Key Strategies | |
      9. 5.2.9 Multi-Color Corporation (US) | | |
        1. 5.2.9.1 Financial Overview | | |
        2. 5.2.9.2 Products Offered | | |
        3. 5.2.9.3 Key Developments | | |
        4. 5.2.9.4 SWOT Analysis | | |
        5. 5.2.9.5 Key Strategies |
    3. 5.3 Appendix | |
      1. 5.3.1 References | |
      2. 5.3.2 Related Reports 6 LIST OF FIGURES |
    4. 6.1 MARKET SYNOPSIS |
    5. 6.2 NORTH AMERICA MARKET ANALYSIS BY MATERIAL |
    6. 6.3 NORTH AMERICA MARKET ANALYSIS BY MECHANISM |
    7. 6.4 NORTH AMERICA MARKET ANALYSIS BY APPLICATION |
    8. 6.5 KEY BUYING CRITERIA OF PACKAGING & TRANSPORT |
    9. 6.6 RESEARCH PROCESS OF MRFR |
    10. 6.7 DRO ANALYSIS OF PACKAGING & TRANSPORT |
    11. 6.8 DRIVERS IMPACT ANALYSIS: PACKAGING & TRANSPORT |
    12. 6.9 RESTRAINTS IMPACT ANALYSIS: PACKAGING & TRANSPORT |
    13. 6.10 SUPPLY / VALUE CHAIN: PACKAGING & TRANSPORT |
    14. 6.11 PACKAGING & TRANSPORT, BY MATERIAL, 2024 (% SHARE) |
    15. 6.12 PACKAGING & TRANSPORT, BY MATERIAL, 2024 TO 2035 (USD Million) |
    16. 6.13 PACKAGING & TRANSPORT, BY MECHANISM, 2024 (% SHARE) |
    17. 6.14 PACKAGING & TRANSPORT, BY MECHANISM, 2024 TO 2035 (USD Million) |
    18. 6.15 PACKAGING & TRANSPORT, BY APPLICATION, 2024 (% SHARE) |
    19. 6.16 PACKAGING & TRANSPORT, BY APPLICATION, 2024 TO 2035 (USD Million) |
    20. 6.17 BENCHMARKING OF MAJOR COMPETITORS 7 LIST OF TABLES |
    21. 7.1 LIST OF ASSUMPTIONS | |
      1. 7.1.1 |
    22. 7.2 North America MARKET SIZE ESTIMATES; FORECAST | |
      1. 7.2.1 BY MATERIAL, 2025-2035 (USD Million) | |
      2. 7.2.2 BY MECHANISM, 2025-2035 (USD Million) | |
      3. 7.2.3 BY APPLICATION, 2025-2035 (USD Million) |
    23. 7.3 PRODUCT LAUNCH/PRODUCT DEVELOPMENT/APPROVAL | |
      1. 7.3.1 |
    24. 7.4 ACQUISITION/PARTNERSHIP | |

North America Packaging & Transport Market Segmentation

Packaging & Transport By Material (USD Million, 2025-2035)

  • Metal
  • Polymer
  • Others

Packaging & Transport By Mechanism (USD Million, 2025-2035)

  • Pressure-sensitive
  • Glue-applied
  • Heat Transfer
  • Others

Packaging & Transport By Application (USD Million, 2025-2035)

  • Transportation
  • Construction
  • Automotive
  • Consumer Durables
  • Others

Compare Licence

×
Features License Type
Single User Multiuser License Enterprise User
Price $4,950 $5,950 $7,250
Maximum User Access Limit 1 User Upto 10 Users Unrestricted Access Throughout the Organization
Free Customization
Direct Access to Analyst
Deliverable Format
Platform Access
Discount on Next Purchase 10% 15% 15%
Printable Versions