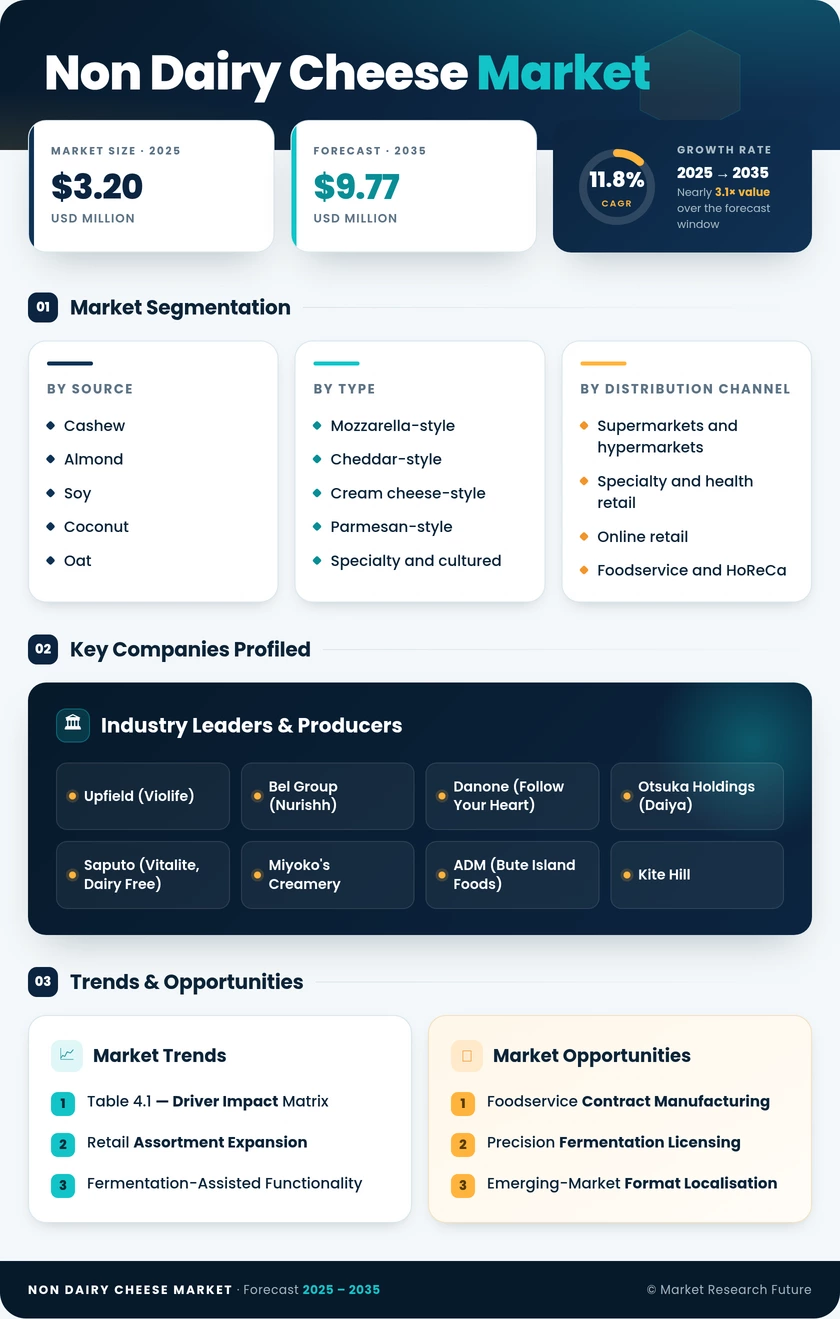
Non-dairy cheese Market (2026 - 2035)

Non-Dairy Cheese Market Size, Share, Industry Trend & Analysis Research Report By Type (Soft Cheese, Hard Cheese, Cream Cheese, Processed Cheese), By Source (Nuts, Soy, Coconut, Oats, Rice), By Flavor (Plain, Smoked, Herbed, Spicy), By Application (Cooking, Baking, Snacking, Spreading) and By Regional (North America, Europe, South America, Asia Pacific, Middle East and Africa)-Forecast to 2035

Forecast Period
2026-2035
CAGR
11.8%
2025 Market Size
USD 3.20 Billion
2035 Market Size
USD 9.77 Billion
Food, Beverages & Nutrition ● Updated August 2026 Report ID: MRFR/FnB/2241-HCR | Pages: 200 | Author: Snehal Singh
  1. 1 Market Overview |
    1. 1.1 Study Assumptions & Market Definition |
    2. 1.2 Scope of the Study |
    3. 1.3 Research Methodology
  2. 2 Market Summary & Key Report Takeaways |
    1. 2.1 By Source |
    2. 2.2 By Product Type |
    3. 2.3 By Geography
  3. 3 Market Size & Forecast (2021–2035) |
    1. 3.1 Historical Market Size (2021–2025) |
    2. 3.2 Current & Forecast Market Size (2026–2035) |
    3. 3.3 Market Size by Revenue (USD Billion) |
    4. 3.4 Year-over-Year Growth Analysis
  4. 4 Market Dynamics — Drivers |
    1. 4.1 Retail Assortment Expansion |
    2. 4.2 Fermentation-Assisted Functionality |
    3. 4.3 Foodservice Adoption |
    4. 4.4 Health and Dietary Shifts
  5. 5 Market Dynamics — Restraints |
    1. 5.1 The Price Premium |
    2. 5.2 Clean-Label Scrutiny |
    3. 5.3 Labelling Constraints |
    4. 5.4 Industry Value Chain Analysis |
    5. 5.5 Porter's Five Forces Analysis
  6. 6 Market Opportunity Analysis |
    1. 6.1 Foodservice Contract Manufacturing |
    2. 6.2 Precision Fermentation Licensing |
    3. 6.3 Emerging-Market Format Localisation |
    4. 6.4 Data-Led Category Management |
    5. 6.5 Industrial Ingredient Supply
  7. 7 Regional Analysis |
    1. 7.1 North America | |
      1. 7.1.1 United States | |
      2. 7.1.2 Canada | |
      3. 7.1.3 Mexico |
    2. 7.2 Europe | |
      1. 7.2.1 Germany | |
      2. 7.2.2 United Kingdom | |
      3. 7.2.3 France | |
      4. 7.2.4 Netherlands | |
      5. 7.2.5 Rest of Europe |
    3. 7.3 Asia-Pacific | |
      1. 7.3.1 China | |
      2. 7.3.2 India | |
      3. 7.3.3 Japan | |
      4. 7.3.4 Australia | |
      5. 7.3.5 Rest of Asia-Pacific |
    4. 7.4 South America | |
      1. 7.4.1 Brazil | |
      2. 7.4.2 Argentina | |
      3. 7.4.3 Rest of South America |
    5. 7.5 Middle East & Africa | |
      1. 7.5.1 United Arab Emirates | |
      2. 7.5.2 Saudi Arabia | |
      3. 7.5.3 South Africa | |
      4. 7.5.4 Rest of Middle East & Africa
  8. 8 Future Outlook (2026–2035) |
    1. 8.1 Functional Parity by 2030 |
    2. 8.2 Supply Chain Vertical Integration |
    3. 8.3 Sustainability Disclosure as Procurement Criteria |
    4. 8.4 Consolidation and Category Rationalisation
  9. 9 Market Segmentation Analysis |
    1. 9.1 By Source | |
      1. 9.1.1 Cashew | |
      2. 9.1.2 Almond | |
      3. 9.1.3 Soy | |
      4. 9.1.4 Coconut | |
      5. 9.1.5 Oat | |
      6. 9.1.6 Other (Pea, Potato, Fermented) |
    2. 9.2 By Product Type | |
      1. 9.2.1 Mozzarella-Style | |
      2. 9.2.2 Cheddar-Style | |
      3. 9.2.3 Cream Cheese-Style | |
      4. 9.2.4 Parmesan-Style | |
      5. 9.2.5 Specialty and Cultured |
    3. 9.3 By Distribution Channel | |
      1. 9.3.1 Supermarkets and Hypermarkets | |
      2. 9.3.2 Specialty and Health Retail | |
      3. 9.3.3 Online Retail | |
      4. 9.3.4 Foodservice and HoReCa |
    4. 9.4 By End User | |
      1. 9.4.1 Retail Household | |
      2. 9.4.2 Foodservice Operators | |
      3. 9.4.3 Food Processing and Industrial
  10. 10 Competitive Landscape |
    1. 10.1 Market Share Analysis (2026) |
    2. 10.2 Competitive Benchmarking Matrix |
    3. 10.3 Company Profiles | |
      1. 10.3.1 Upfield (Violife) | |
      2. 10.3.2 Bel Group (Nurishh) | |
      3. 10.3.3 Danone (Follow Your Heart) | |
      4. 10.3.4 Otsuka Holdings (Daiya) | |
      5. 10.3.5 Saputo | |
      6. 10.3.6 Miyoko's Creamery | |
      7. 10.3.7 Archer Daniels Midland (Bute Island Foods) | |
      8. 10.3.8 Kite Hill | |
      9. 10.3.9 Tofutti Brands | |
      10. 10.3.10 Good Planet Foods
  11. 11 Recent Developments & News
  12. 12 Report Scope & Methodology |
    1. 12.1 Study Period & Base Year |
    2. 12.2 Data Sources & Citations |
    3. 12.3 Abbreviations
  13. 13 Detailed Sources and Citations
  14. 14 Frequently Asked Questions
  15. 15 LIST OF TABLES |
  16. TABLE 1 Global Non-Dairy Cheese Market Size & Forecast, by Revenue (USD Billion), 2021–2035 |
  17. TABLE 2 Global Non-Dairy Cheese Market – Year-over-Year Growth Analysis, 2021–2035 |
  18. TABLE 3 Driver Impact Matrix, 2026–2035 |
  19. TABLE 4 Restraint Impact Matrix, 2026–2035 |
  20. TABLE 5 Regional Summary – Share, Value and Growth, 2025 |
  21. TABLE 6 North America Market Size, by Country, 2021–2035 (USD Billion) |
  22. TABLE 7 Europe Market Size, by Country, 2021–2035 (USD Billion) |
  23. TABLE 8 Asia-Pacific Market Size, by Country, 2021–2035 (USD Billion) |
  24. TABLE 9 South America Market Size, by Country, 2021–2035 (USD Billion) |
  25. TABLE 10 Middle East & Africa Market Size, by Country, 2021–2035 (USD Billion) |
  26. TABLE 11 Global Market Size, by Source, 2021–2035 (USD Billion) |
  27. TABLE 12 Global Market Size, by Product Type, 2021–2035 (USD Billion) |
  28. TABLE 13 Global Market Size, by Distribution Channel, 2021–2035 (USD Billion) |
  29. TABLE 14 Global Market Size, by End User, 2021–2035 (USD Billion) |
  30. TABLE 15 North America Market Size, by Source and Product Type, 2021–2035 (USD Billion) |
  31. TABLE 16 Europe Market Size, by Source and Product Type, 2021–2035 (USD Billion) |
  32. TABLE 17 Asia-Pacific Market Size, by Source and Product Type, 2021–2035 (USD Billion) |
  33. TABLE 18 South America Market Size, by Distribution Channel, 2021–2035 (USD Billion) |
  34. TABLE 19 Middle East & Africa Market Size, by End User, 2021–2035 (USD Billion) |
  35. TABLE 20 Competitive Benchmarking Matrix, 2026 |
  36. TABLE 21 Company Profiles – Key Players |
  37. TABLE 22 Recent Developments & Strategic Announcements, 2023–2025 |
  38. TABLE 23 Report Scope & Methodology Summary |
  39. TABLE 24 Detailed Sources and Citations
  40. 16 LIST OF FIGURES |
  41. FIGURE 1 Market Dynamics — Drivers, Restraints and Opportunities Snapshot |
  42. FIGURE 2 Industry Value Chain Analysis |
  43. FIGURE 3 Porter's Five Forces Analysis |
  44. FIGURE 4 Global Market Size Trend and Forecast, 2021–2035 (USD Billion) |
  45. FIGURE 5 Year-over-Year Growth Trajectory, 2022–2035 |
  46. FIGURE 6 Market Share by Source, 2025 vs 2035 |
  47. FIGURE 7 Market Share by Product Type, 2025 vs 2035 |
  48. FIGURE 8 Market Share by Distribution Channel, 2025 |
  49. FIGURE 9 Market Share by End User, 2025 |
  50. FIGURE 10 Regional Revenue Share Distribution, 2025 |
  51. FIGURE 11 Regional CAGR Comparison, 2026–2035 |
  52. FIGURE 12 Country-Level Growth Heatmap |
  53. FIGURE 13 Competitive Landscape — Revenue Share Positioning, 2026 |
  54. FIGURE 14 Strategic Positioning Matrix — Scale versus Premium |
  55. FIGURE 15 Price Premium Trajectory versus Conventional Cheese, 2021–2035
Share::
Request Free Sample

Segmentation Quick Reference

DimensionSub-SegmentsDominant SegmentFastest Growing Segment
By SourceCashew; Almond; Soy; Coconut; Oat; Other (Pea, Potato, Fermented)CashewOat
By Product TypeMozzarella-Style; Cheddar-Style; Cream Cheese-Style; Parmesan-Style; Specialty and CulturedMozzarella-StyleSpecialty and Cultured
By Distribution ChannelSupermarkets and Hypermarkets; Specialty and Health Retail; Online Retail; Foodservice and HoReCaSupermarkets and HypermarketsOnline Retail
By End UserRetail Household; Foodservice Operators; Food Processing and IndustrialRetail HouseholdFoodservice Operators
By RegionNorth America; Europe; Asia-Pacific; South America; Middle East & AfricaNorth AmericaAsia-Pacific


Market Segmentation Overview

By Source

Sub-SegmentKey Trend
CashewCultured fermentation delivers closest flavour match; premium pricing sustained.
AlmondStable North American supply supports spreads and ricotta-style formats.
SoyConcentrated in East Asia where protein familiarity is highest
CoconutCost-efficient fat base under pressure from saturated-fat labelling scrutiny
OatNut-free positioning and short ingredient decks drive fastest growth.
Other (Pea, Potato, Fermented)Protein fortification and precision-fermented casein blending


Source choice increasingly reflects allergen strategy rather than flavour alone. Manufacturers are hedging by running dual-base platforms — one nut, one grain — to serve schools, airlines and institutional buyers that restrict tree nuts outright.

By Product Type

Sub-SegmentKey Trend
Mozzarella-StylePizza and frozen-meal demand anchors volume leadership
Cheddar-StyleSlice formats grow with sandwich and burger occasions.
Cream Cheese-StyleHighest consumer satisfaction scores; low functional risk
Parmesan-StyleShaker and shaved formats gain in pasta meal kits.
Specialty and CulturedPremium cheeseboard positioning at artisanal price points


Format economics diverge sharply. Melt-dependent products carry higher reformulation risk but larger addressable volume, while spreads and cultured wheels deliver margin without technical exposure.

By Distribution Channel

Sub-SegmentKey Trend
Supermarkets and HypermarketsMigration from specialty aisles into mainline dairy cabinets
Specialty and Health RetailDeclining share as mainstream grocery absorbs volume
Online RetailSubscription and multipack formats lift basket value.
Foodservice and HoReCaChain menu inclusion converts trial into repeat consumption.


Placement remains the single strongest predictor of velocity. Retailers that relocated the category into refrigerated dairy sets recorded materially higher turns than those maintaining separate natural-foods fixtures.

By End User

Sub-SegmentKey Trend
Retail HouseholdEveryday meal replacement rather than occasional substitution
Foodservice OperatorsMenu diversification mandates and allergen-inclusive policies
Food Processing and IndustrialBulk heat-stable supply for bakery, frozen meals and ready dishes


Industrial buyers are the quiet growth story. They contract in multi-year cycles, demand no marketing support, and reward suppliers on functional consistency. This profile favours manufacturers with disciplined process control over those with strong consumer brands.




Share::
Request Free Sample
Download PDF ×

We do not share your information with anyone. However, we may send you emails based on your report interest from time to time. You may contact us at any time to opt-out.