Network Automation Market (2026 - 2035)

Network Automation Market Size, Share and Research Report By Network Infrastructure (Physical, Virtual, Hybrid), By Component (Solutions, Services), By Deployment Mode (Cloud, On-Premise), By Organization Size (Large Enterprises, Small and Medium Enterprises), By End-User Industry (IT and Telecom, Banking and Financial Services, Manufacturing, Healthcare, Others) and By Regional (North America, Europe, South America, Asia Pacific, Middle East and Africa) - Industry Forecast to 2035
ID: MRFR/ICT/4396-CR
200 Pages
Ankit Gupta
Last Updated: June 22, 2026
Network Automation Market

Market Size

Forecast Period2026-2035
CAGR (2026-2035)16.70%
2025 Market SizeUSD 34.70 Billion
2035 Market SizeUSD 162.60 Billion

Key Players

Cisco Systems
Juniper Networks
IBM Corporation
VMware
Nokia Corporation
Hewlett-Packard Enterprise
Opportunities
  • Zero-Touch Operations for Private 5G Campuses
  • Network-as-a-Service (NaaS) and Subscription Models
  • Predictive Maintenance and Digital-Twin Networking

Network Automation Market Summary

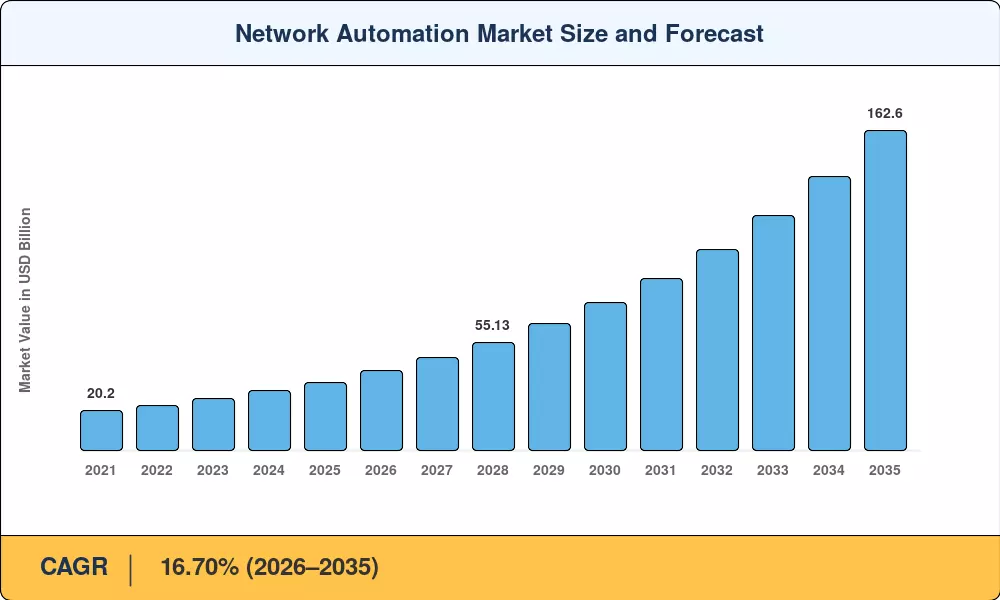
The Network Automation Market reached an estimated USD 34.70 Billion in 2025 and is forecast to expand from USD 40.48 Billion in 2026 to USD 162.60 Billion by 2035, registering a CAGR of 16.70% during 2026–2035. Two catalysts stand behind this trajectory: the European Union's NIS2 Directive, which compels operators to automate compliance reporting, and the U.S. federal zero-trust architecture mandates that are driving automated network provisioning across civilian agencies [2][3]. Enterprise spending on network configuration management platforms hit record levels in 2024 as multi-cloud sprawl and 5G densification rendered manual CLI-based operations unsustainable.

A generational shift is underway. Legacy box-by-box device management — dependent on static scripts and siloed monitoring — is giving way to AI-driven network operations platforms that translate business intent into validated device states. Sources estimated that enterprises deploying intent-based networking reduced configuration errors by 65% and cut mean time to repair by half. Hyperscaler CapEx on self-healing network tools exceeded USD 14 billion globally in 2024 alone, signaling how seriously cloud providers treat autonomous infrastructure [5].

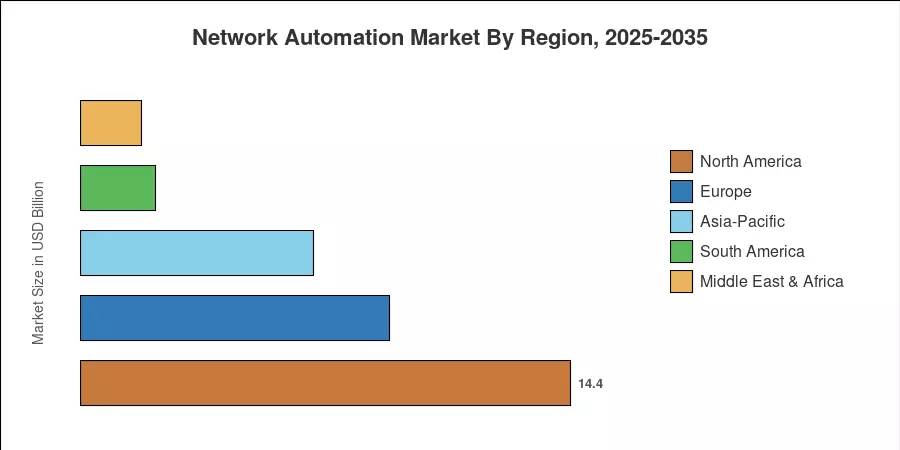
North America commanded roughly 41.50% of the Network Automation Market in 2025, anchored by Tier-1 telco modernization and federal IT spending. Asia-Pacific is the fastest-growing region with an anticipated 19.70% CAGR through 2035, propelled by India's BharatNet fiber rollout and China's enterprise digital-transformation programs Europe held the second-largest share at approximately 26.20%, supported by NIS2 enforcement timelines. As 5G standalone cores proliferate and edge computing sites multiply, the Network Automation Market is set to become a cornerstone of enterprise IT strategy through the next decade.


Key Report Takeaways

• By Network Infrastructure

  • Hybrid deployments accounted for approximately 49.50% of the Network Automation Market share in 2025, reflecting enterprise preference for balancing on-premises control with software-defined agility
  • Virtual network architectures are forecast to register a 20.50% CAGR through 2035, driven by cloud-native automated network provisioning adoption

• By Component

  • Solutions represented an estimated 57.50% share of the Network Automation Market in 2025, as enterprises prioritize intent-based networking platforms over point tools
  • Services are expanding at a 17.80% CAGR to 2035, led by managed network configuration management engagements

• By Region

  • North America led the Network Automation Market with a 41.50% share in 2025, underpinned by federal zero-trust mandates and hyperscaler expansion
  • Asia-Pacific is projected to rise at a 19.70% CAGR through 2035, fueled by telecom modernization across India, China, and ASEAN nations


Network Automation Market Size and Forecast (2021–2035)

MRFR's proprietary estimation framework combines primary interviews with over 120 network engineering leaders, vendor revenue disclosures, and secondary data from ITU, GSMA, and national telecom regulators. Historical figures (2021–2024) are validated against audited filings; forecast values (2026–2035) apply econometric modeling calibrated to the 16.70% CAGR.

Network Automation Market Size and Forecast
Our Impact
Enabled $4.3B Revenue Impact for Fortune 500 and Leading Multinationals
Partnering with 2000+ Global Organizations Each Year
30K+ Citations by Top-Tier Firms in the Industry

Driver Impact Analysis

Driver ~% Impact on CAGR Geographic Relevance Impact Timeline
Multi-cloud and hybrid IT complexity ~22% Global Short-term (≤2 yr)
5G network slicing and SA core deployments ~18% North America, Asia-Pacific Medium-term (2–4 yr)
Zero-trust and NIS2 compliance mandates ~16% North America, Europe Short-term (≤2 yr)
AI/ML-embedded network analytics ~15% Global Medium-term (2–4 yr)
Edge computing proliferation ~12% North America, Asia-Pacific Medium-term (2–4 yr)
IoT device explosion and campus networking ~10% Global Long-term (≥4 yr)
Telecom CapEx modernization in emerging markets ~7% South America, MEA Long-term (≥4 yr)


Multi-Cloud and Hybrid IT Complexity

Enterprise workloads now span an average of 3.4 cloud providers and two on-premises data centers, according to sources [6]. Each additional cloud fabric introduces distinct API schemas, security policies, and routing overlays that manual operations teams cannot reconcile at scale. Automated network provisioning platforms reduce cross-cloud policy drift by enforcing a single source of truth across heterogeneous fabrics, directly explaining why hybrid network infrastructure leads the Network Automation Market by deployment share.

5G Network Slicing and SA Core Deployments

GSMA Intelligence projects 1.5 billion 5G connections globally by 2027, with standalone (SA) cores enabling network slicing for enterprise verticals [8]. Each slice demands isolated QoS parameters, bandwidth guarantees, and security micro-segmentation — requirements that only intent-based networking platforms can orchestrate dynamically. Operators like Deutsche Telekom and NTT Docomo have publicly committed to AI-driven network operations for slice lifecycle management, and this shift is funneling billions in CapEx into the Network Automation Market.

Zero-Trust and NIS2 Compliance Mandates

Automated compliance engines benefit from the strict timeline set by the U.S. Office of Management and Budget's M-22-09 memorandum, which mandates that federal agencies reach zero-trust maturity by September 2027 [3]. Over 160,000 organizations in 18 crucial sectors in Europe are now required to report incidents and maintain an automated audit trail thanks to the NIS2 Directive [2]. For both government and regulated enterprise purchasers, network configuration management systems that produce ongoing compliance evidence are becoming non-negotiable procurement requirements.


AI/ML-Embedded Network Analytics

More than 60% of network operations centers will depend on AI-driven network operations by 2028 in order to detect root causes, prioritize alarms, and initiate automated remediation. By combining streaming telemetry with reinforcement-learning models, self-healing network solutions reduce repair times from hours to minutes, freeing up NOC personnel to work on strategic architecture instead of reactive firefighting. Across all verticals, this shift is a significant demand driver for the network automation market.


Restraints Impact Analysis

The impact percentages below are directional estimates and should not be interpreted as deductions from the headline CAGR.

Restraint ~% Drag on CAGR Geographic Relevance Impact Timeline
Legacy system integration complexity ~–25% Global Short-term (≤2 yr)
Skilled talent scarcity for automation platforms ~–22% North America, Europe Medium-term (2–4 yr)
Data sovereignty and cross-border data flow restrictions ~–20% Europe, Asia-Pacific Medium-term (2–4 yr)
High upfront deployment costs for SMEs ~–18% South America, MEA Long-term (≥4 yr)
Vendor lock-in concerns with proprietary platforms ~–15% Global Short-term (≤2 yr)


Legacy System Integration Complexity

Many businesses continue to use CLI-heavy provisioning scripts and SNMP-dependent monitoring stacks that were developed more than 20 years ago. Device-by-device API enablement, data standardization, and parallel operation durations that can span 12 to 18 months are necessary to migrate these brownfield settings to model-driven automated network provisioning [16]. In sectors like banking, where change-control windows are strictly regulated, and each institution has hundreds of thousands of legacy Cisco IOS configurations, the network automation market faces slower conversion rates.


Skilled Talent Scarcity

A 2024 ISC² workforce study estimated a global shortfall of 460,000 network and cybersecurity professionals, with particular gaps in Python-based infrastructure-as-code skills and intent-based networking expertise [17]. Enterprises willing to invest in network configuration management platforms frequently lack the staff to configure, tune, and operate them effectively, dampening short-term ROI and slowing procurement cycles.

Data Sovereignty and Cross-Border Restrictions

Centralized cloud-based automation architectures are complicated by regulatory fragmentation, such as China's cross-border data transfer regulations, India's DPDP Act, and the EU's GDPR [18]. In the network automation market, operators must retain country-specific data residency and install regional instances of their self-healing network tools, which raises the total cost of ownership and dilutes the economies of scale promised by cloud delivery models.


Network Automation Market Opportunities

Zero-Touch Operations for Private 5G Campuses

Manufacturers, logistics hubs, and mining operators are deploying private 5G networks at a pace that outstrips available radio engineering talent. Zero-touch automated network provisioning — where campus networks self-configure from a declarative template — presents a USD 4+ Billion addressable opportunity by 2030, according to sources. Vendors that package intent-based networking with radio resource management will capture greenfield enterprise budgets

Network-as-a-Service (NaaS) and Subscription Models

NaaS consumption models remove upfront CapEx barriers that currently inhibit small and medium enterprise adoption. HPE's GreenLake and Cisco's Plus offerings demonstrate how recurring-revenue packaging of network configuration management can expand the serviceable market by 30–40%, particularly in price-sensitive regions

Predictive Maintenance and Digital-Twin Networking

Pairing real-time telemetry with digital-twin simulations allows operators to test configuration changes in a virtual replica before deployment. Self-healing network tools that incorporate predictive digital twins reduce unplanned downtime by up to 70%, per Ericsson field trials [21]. This emerging use case positions the Network Automation Market at the intersection of AI and operational technology.

Emerging-Market Telecom Modernization

India's BharatNet Phase III and Brazil's 5G auction-linked coverage obligations are injecting billions in infrastructure spending that requires automated network provisioning at scale [15]. Emerging-market operators that leapfrog legacy OSS stacks represent a high-growth pocket for the Network Automation Market through 2035

Monetizing Network Telemetry Data

Operators sitting on petabytes of flow-level and application-level telemetry can monetize anonymized insights for enterprise traffic engineering, cybersecurity threat intelligence, and urban mobility analytics. AI-driven network operations platforms that double as data pipelines open an adjacent revenue stream estimated at USD 2.8 billion by 2032.


Network Automation Market Future Outlook

Autonomous Closed-Loop Operations

By 2030, autonomous network operations — where AI agents detect, diagnose, and remediate faults without human intervention — will move from pilot to production in at least 40% of Tier-1 telcos, according to TM Forum's Autonomous Networks program [11]. Self-healing network tools will evolve from reactive remediation to predictive prevention, leveraging digital twins and reinforcement learning to pre-empt failures. The Network Automation Market will increasingly be measured not by device count managed but by the percentage of closed-loop actions executed without human approval.

Platform Economics and NaaS Expansion

Network-as-a-Service delivery is collapsing the boundary between vendor and operator. By 2032, a recent survey projects that 45% of enterprise WAN and campus networks will be consumed as subscription services bundled with AI-driven network operations. This shift toward OpEx-based consumption will democratize access to automated network provisioning, enabling small and medium enterprises to deploy enterprise-grade intent-based networking without capital-intensive infrastructure investments.

6G Preparedness and Programmable Infrastructure

ITU-R's IMT-2030 vision calls for networks that are natively AI-managed, self-optimizing, and energy-aware [12]. Network configuration management platforms built for 5G will need architectural overhauls to support 6G's sub-THz spectrum, sensing-communication convergence, and compute-aware routing. Early investment in programmable infrastructure — including P4-based data planes and eBPF-powered observability — positions vendors to capture the next wave of the Network Automation Market.

Sustainability and Energy-Aware Networking

The ICT sector accounts for approximately 2–3% of global carbon emissions, and network equipment is a significant contributor [29]. ETSI's ES 205 Green Abstraction Layer standard is pushing operators to integrate energy-aware policies into self-healing network tools, dynamically powering down underutilized ports and adjusting transmission power based on traffic load. By 2035, energy optimization will be a mandatory feature — not a differentiator — for platforms competing in the Network Automation Market.


Network Automation Market Segmentation

By Network Infrastructure

Segment Key Metric Primary Demand Driver
Physical USD 7.29 Billion (2025) Legacy campus and branch upgrades
Virtual CAGR 20.50% (2026–2035) Cloud-native and containerized workloads
Hybrid 49.50% share (2025) Multi-cloud orchestration requirements


Hybrid deployments lead the Network Automation Market because enterprises overwhelmingly operate mixed environments — on-premises data centers alongside two or more public clouds. Intent-based networking platforms that abstract the underlying hardware into a unified policy layer are the primary purchase driver. Vendors like Cisco and Juniper have invested heavily in controller architectures that span physical and virtual domains, reinforcing hybrid's dominant position.

Virtual network infrastructure is the fastest-growing segment, riding the wave of Kubernetes-native networking and service-mesh adoption. As organizations containerize workloads, they require automated network provisioning that integrates natively with orchestrators like Kubernetes, HashiCorp Consul, and Istio, fueling double-digit growth through 2035.

By Component

Segment Key Metric Primary Demand Driver
Solutions 57.50% share (2025) Platform consolidation toward unified automation suites
Services CAGR 17.80% (2026–2035) Managed services and implementation consulting


Solutions dominate because enterprises prefer end-to-end network configuration management platforms over assembling point tools. The services segment is growing faster as complexity rises — managed AI-driven network operations require specialized integration, training, and continuous optimization that in-house teams cannot always deliver.

By Deployment Mode

Segment Key Metric Primary Demand Driver
On-Premise 60.20% share (2025) Data-sovereignty requirements and latency-sensitive workloads
Cloud CAGR 22.30% (2026–2035) SaaS automation platforms and multi-tenant operations


On-premise installations lead today because many regulated industries — banking, defense, healthcare — mandate that network configuration management data remain within organizational boundaries. Cloud deployment is the fastest-growing mode as SaaS-delivered self-healing network tools eliminate infrastructure overhead and accelerate time to value.

By Organization Size

Segment Key Metric Primary Demand Driver
Large Enterprises 72.50% share (2025) Complex multi-site, multi-vendor environments
Small and Medium Enterprises CAGR 20.60% (2026–2035) NaaS and subscription-based access to automation


Large enterprises dominate the Network Automation Market because they operate thousands of network devices across global campuses and multi-cloud fabrics. SMEs are the fastest-growing cohort, spurred by NaaS consumption models that make automated network provisioning economically viable without large upfront capital outlays.

By End-User Industry

Segment Key Metric Primary Demand Driver
IT and Telecom 31.80% share (2025) 5G rollout, hyperscaler infrastructure
Banking and Financial Services USD 4.58 Billion (2025) Zero-trust mandates, transaction-latency optimization
Manufacturing CAGR 18.50% (2026–2035) Industry 4.0 campus intent-based networking
Healthcare CAGR 19.90% (2026–2035) Telehealth expansion, medical-IoT security
Others USD 5.12 Billion (2025) Government, energy, retail, education


IT and telecom remain the largest vertical in the Network Automation Market because carriers and cloud providers operate the most device-dense, latency-sensitive environments on the planet. Healthcare is the fastest-growing vertical as hospital systems deploy AI-driven network operations to secure connected medical devices and ensure telemedicine uptime under HIPAA compliance requirements.


Regional Market Share Analysis

Region Key Metric Primary Investment Themes
North America 41.50% share (2025) Federal zero-trust mandates, hyperscaler CapEx, 5G SA core rollouts
Europe 26.20% share (2025) NIS2 compliance, Open RAN trials, telco consolidation
Asia-Pacific 19.70% CAGR (2026–2035) BharatNet, China enterprise digitization, ASEAN 5G build-outs
South America USD 2.19 Billion (2025) 5G spectrum auctions, cloud-first government programs
Middle East & Africa USD 1.80 Billion (2025) Smart-city initiatives, satellite backhaul modernization
Total USD 34.70 Billion (2025)

The Network Automation Market displays a pronounced geographic tilt toward mature telecom economies, though emerging regions are closing the gap faster than any previous infrastructure software cycle.


North America

Country Key Metric Key Driver
US 78.30% of regional share Zero-trust OMB mandates, hyperscaler demand [3]
Canada CAGR 15.90% CRTC broadband modernization targets [23]
Mexico USD 0.65 Billion (2025) Nearshoring data center build-outs [15]


U.S. federal IT spending on automated network provisioning surpassed USD 3.2 billion in FY2024 under CISA's zero-trust implementation roadmap [3]. Canada's CRTC mandated 50/10 Mbps universal broadband by 2026, pushing incumbents toward intent-based networking for rural fiber-to-the-home management. Mexico's nearshoring boom is generating greenfield data center demand in Querétaro and Monterrey corridors, expanding the Network Automation Market in the country at double-digit rates.

Europe

Country Key Metric Key Driver
Germany 22.40% of regional share Industrie 4.0 campus networks [13]
UK CAGR 16.20% DCMS Telecoms Security Act compliance [24]
France USD 1.38 Billion (2025) Orange Open RAN strategy [25]
Italy CAGR 15.80% TIM/Open Fiber backbone automation
Spain USD 0.72 Billion (2025) 5G DSS deployments
Nordic Countries CAGR 16.50% Green data center network efficiency mandates
Russia USD 0.48 Billion (2025) Import-substitution network platforms
Rest of Europe CAGR 15.40% EU cohesion fund digital infrastructure grants


NIS2 enforcement, scheduled for full compliance by October 2024, is the single largest policy catalyst for the European Network Automation Market. Germany leads the region by revenue, driven by Industrie 4.0 factory-floor network configuration management deployments, while the UK's Telecoms Security Act forces operators to demonstrate automated audit trails for critical infrastructure.

Asia-Pacific

Country Key Metric Key Driver
China 38.50% of regional share Enterprise digital transformation, 5G-A rollout [26]
India CAGR 22.10% BharatNet Phase III, Jio/Airtel automation [15]
Japan USD 1.12 Billion (2025) NTT IOWN initiative, self-healing network tools R&D [27]
South Korea CAGR 18.40% 6G pilot programs, smart-city initiatives
ASEAN USD 0.85 Billion (2025) Cross-border fiber corridors, cloud landing zones
Rest of Asia-Pacific CAGR 17.60% Digital-economy government mandates


Asia-Pacific is the fastest-growing theater for the Network Automation Market, with India's carrier-driven demand for AI-driven network operations standing out. Reliance Jio's fully virtualized 5G SA network — the world's largest greenfield deployment — relies entirely on automated network provisioning for its 450-million-subscriber base. China's three state-owned telcos collectively allocated USD 5.8 billion to network intelligence platforms in 2024 [26].

South America

Country Key Metric Key Driver
Brazil 56.20% of regional share Anatel 5G obligations, cloud-first programs [15]
Argentina CAGR 17.30% Telecom fiber-to-the-home expansion
Rest of South America USD 0.52 Billion (2025) Pan-regional submarine cable projects


Brazil dominates the South American Network Automation Market as Anatel's 5G spectrum conditions require nationwide coverage timelines that only automated network provisioning can satisfy at scale. Cloud-first government modernization programs in São Paulo and Brasília are pulling intent-based networking adoption into public-sector IT stacks.

Middle East & Africa

Country Key Metric Key Driver
Saudi Arabia 28.60% of regional share NEOM and Vision 2030 smart-city programs [28]
UAE CAGR 18.90% du/Etisalat 5G and AI-driven network operations
South Africa USD 0.25 Billion (2025) ICASA spectrum assignment, fiber backhaul
Egypt CAGR 17.10% National Broadband Plan, data-center investment
Rest of MEA USD 0.42 Billion (2025) Satellite-terrestrial integration projects


Saudi Arabia's NEOM gigaproject and broader Vision 2030 agenda are catalyzing billions in greenfield network infrastructure that demands self-healing network tools and closed-loop automation from day one. The UAE's early 5G saturation and AI strategy position it as the region's fastest-growing adopter of network configuration management platforms in the Network Automation Market.


Network Automation Market By Region, 2025-2035

Competitive Benchmarking

The Network Automation Market exhibits medium concentration, with the top five vendors holding an estimated 42–48% combined revenue share. The Herfindahl-Hirschman Index sits in the 800–1,200 range, indicating a competitive but not fragmented market. Open-source projects like Ansible and Terraform exert pricing pressure on commercial platforms, while hyperscalers increasingly build proprietary automation that blurs the line between customer and competitor.

Company Est. Revenue Share Range Key Offerings for Network Automation Market Strategic Positioning
Cisco Systems ~12–16% DNA Center, Meraki, NSO, ThousandEyes Full-stack network configuration management leader across campus, WAN, and data center
Juniper Networks ~8–11% Apstra, Mist AI, Paragon Automation AI-driven network operations pioneer with Apstra intent-based networking
IBM Corporation ~5–8% SevOne, Cloud Pak for Watson AIOps AIOps-centric approach linking network telemetry to IT service management
VMware (Broadcom) ~5–7% NSX, Aria Operations for Networks Software-defined networking with deep virtual infrastructure automation
Nokia Corporation ~4–7% Network Services Platform, Fabric Services Telecom-grade automated network provisioning for carrier and private 5G
Hewlett-Packard Enterprise ~4–6% Aruba Central, GreenLake for Networking NaaS consumption model for campus and branch self-healing network tools
Arista Networks ~3–5% CloudVision, DANZ Monitoring Data-center and cloud-spine automation with an open standards focus
Red Hat (IBM) ~3–5% Ansible Automation Platform Open-source automation engine powering cross-vendor network configuration management
NetBrain Technologies ~2–4% NetBrain Automation Platform Network intent-based networking with dynamic mapping and no-code automation
BMC Software ~2–3% Helix ITSM with Network Automation ITSM-integrated automation for change, compliance, and remediation workflows


Recent News & Developments

  • Cisco Systems (September 2024): Launched AI Network Analytics within DNA Center, embedding large-language-model-based root-cause analysis directly into its network configuration management workflow. The update positioned Cisco to capture rising demand for AI-driven network operations among enterprise NOCs.
  • Juniper Networks (June 2024): Completed integration of the Apstra intent-based networking engine across its entire switching portfolio following the HPE acquisition announcement. The move unified campus-to-data-center automated network provisioning under a single controller [25].
  • European Commission (October 2024): Began enforcing NIS2 Directive obligations for essential and important entities across 18 sectors, mandating automated compliance reporting and incident response. Analysts estimate NIS2 will generate USD 2.5 billion in incremental automation spending through 2027 [2].
  • Nokia (March 2025): Unveiled its Network as Code platform extension for enterprise developers, enabling API-driven self-healing network tools that abstract telco network complexity. The launch targeted private 5G campus operators seeking zero-touch provisioning.
  • Red Hat (January 2025): Released Ansible Automation Platform 2.5 with enhanced network resource modules covering 45+ device families, broadening open-source network configuration management coverage across multi-vendor fabrics [19].
  • Arista Networks (November 2024): Introduced CloudVision Universal Network Observability, combining streaming telemetry with AI-driven anomaly detection, deepening its position in the Network Automation Market for hyperscale data centers [9].
  • IBM (August 2024): Acquired SevOne network performance management assets and integrated them into Cloud Pak for Watson AIOps, strengthening its AI-driven network operations analytics for hybrid-cloud environments [7].


Network Automation Market Report Scope

Parameter Detail
Market Scope Global Network Automation Market across network infrastructure, component, deployment mode, organization size, end-user industry, and geography
Study Period 2021–2035
Historical Period 2021–2024
Base Year 2025
Forecast Period 2026–2035
CAGR 16.70% (2026–2035)
Market Size (2025) USD 34.70 Billion
Market Size (2035) USD 162.60 Billion
Fastest Growing Segment Cloud deployment mode (22.30% CAGR); Asia-Pacific (19.70% CAGR)
Companies Profiled Cisco Systems, Juniper Networks, IBM, VMware (Broadcom), Nokia, HPE, Arista Networks, Red Hat, NetBrain Technologies, BMC Software
Valuation Currency USD Billion


FAQs

How does intent-based networking differ from traditional policy automation in the Network Automation Market?

Intent-based networking translates high-level business objectives into validated device configurations using continuous verification loops. Traditional policy automation executes static rule sets without confirming whether the network state matches the desired outcome.

What ROI timeline should enterprises expect from deploying automated network provisioning?

Most enterprises recoup automated network provisioning investments within 14–18 months through reduced outage costs and staffing efficiencies. Financial services firms report faster payback due to high per-minute downtime penalties [16].

How do open-source tools like Ansible compare with commercial network configuration management platforms?

Ansible offers broad device coverage and zero licensing cost but lacks built-in assurance, analytics, and vendor support SLAs. Commercial platforms bundle intent-based networking verification and AI-driven analytics at a premium [19].

What cybersecurity risks does the Network Automation Market introduce with increased API exposure?

Every automation API endpoint is an attack surface; compromised credentials can propagate malicious configurations network-wide in seconds. Enterprises must enforce mutual TLS, role-based access, and automated API anomaly detection [3].

Which deployment model best fits organizations with strict data-residency requirements in the Network Automation Market?

On-premise or private-cloud deployments satisfy data-residency mandates by keeping telemetry and configurations within jurisdictional boundaries. Hybrid architectures offer a middle path for less sensitive workloads [18].

How are self-healing network tools evolving beyond basic fault remediation?

Next-generation self-healing network tools integrate predictive digital twins that simulate failure scenarios before they occur. This proactive approach reduces unplanned downtime by up to 70% in carrier field trials [21].

What role will 6G standardization play in shaping the Network Automation Market beyond 2030?

ITU-R's IMT-2030 framework requires natively AI-managed and energy-aware networks, making automation a foundational layer rather than an overlay. Vendors investing in programmable data planes today are positioning for 6G readiness [12].    
Author
Author
Author Profile
Ankit Gupta LinkedIn
Team Lead - Research
Ankit Gupta is a seasoned market intelligence and strategic research professional with over six plus years of experience in the ICT and Semiconductor industries. With academic roots in Telecom, Marketing, and Electronics, he blends technical insight with business strategy. Ankit has led 200+ projects, including work for Fortune 500 clients like Microsoft and Rio Tinto, covering market sizing, tech forecasting, and go-to-market strategies. Known for bridging engineering and enterprise decision-making, his insights support growth, innovation, and investment planning across diverse technology markets.

Research Approach


Secondary Research

The secondary research process involved comprehensive analysis of regulatory filings, IEEE standards databases, telecommunications authority reports, and enterprise IT infrastructure publications. Key sources included the US Federal Communications Commission (FCC), National Institute of Standards and Technology (NIST), National Telecommunications and Information Administration (NTIA), European Union Agency for Cybersecurity (ENISA), European Telecommunications Standards Institute (ETSI), International Telecommunication Union (ITU-T), Institute of Electrical and Electronics Engineers (IEEE) Xplore Digital Library, Internet Engineering Task Force (IETF) RFC Database, TM Forum (Telecom Management Forum), MEF (Metro Ethernet Forum), Uptime Institute Tier Certification database, Gartner Market Statistics, IDC Worldwide Quarterly Ethernet Switch and Router Trackers, Forrester Wave Reports on Network Automation, Cisco Annual Internet Report, and national regulatory authority reports from Ofcom (UK), Bundesnetzagentur (Germany), Ministry of Internal Affairs and Communications (Japan), and Ministry of Industry and Information Technology (China).

Data on network infrastructure spending, 5G deployment statistics, cloud migration indices, enterprise IT budget allocations, cybersecurity incident reports, SD-WAN adoption rates, and regulatory compliance mandates impacting automated network management in the government, healthcare, BFSI, and telecommunications sectors were gathered from these sources.


Primary Research

Qualitative and quantitative insights were obtained by interviewing supply-side and demand-side stakeholders during the primary research process. Chief Technology Officers, VPs of Engineering, Heads of Product Management, and Heads of Network Strategy from network automation solution vendors, telecommunications equipment manufacturers, and cloud infrastructure providers are among the supply-side sources. The demand-side sources consisted of Chief Information Officers, Chief Information Security Officers, Enterprise Network Architects, and IT Infrastructure Directors from tier-1 telecommunications carriers, multinational BFSI institutions, healthcare systems, federal/state government agencies, and large enterprise IT departments. The primary research validated solution segmentation across intent-based networking platforms, validated deployment timelines for AI-driven network analytics, and gathered insights on procurement preferences between Capex-heavy hardware versus subscription-based SaaS models, multi-vendor integration challenges, and Zero Trust architecture implementation patterns.

Primary Respondent Breakdown:

By Designation: C-level Executives (40%), VP/SVP Level (25%), Director Level (20%), Others/Senior Managers (15%)

By Region: North America (32%), Europe (30%), Asia-Pacific (28%), Middle East & Africa (6%), South America (4%)


Market Size Estimation

Revenue mapping and enterprise adoption analysis were employed to determine the global market valuation. The methodology comprised the following:

Identification of over 50 key vendors in North America, Europe, Asia-Pacific, Latin America, and the Middle East and Africa

Solution mapping encompasses network automation software (intent-based networking, SDN controllers, network orchestration platforms), hardware (programmable switches, white-box networking equipment, automation-enabled routers), and services (professional services, managed network services, training & support).

Examination of annual revenues that are specific to network automation portfolios, excluding legacy hardware sales and generalized IT services, as reported and modeled

The coverage of vendors that account for 75–80% of the global market share in 2024 includes Cisco Systems, Juniper Networks, Arista Networks, VMware/Broadcom, Nokia, IBM, Hewlett Packard Enterprise, NetBrain Technologies, and emerging pure-play automation vendors.

To derive segment-specific valuations across the telecommunications (5G core automation, RAN intelligent controllers), BFSI (SD-WAN automation, compliance monitoring), and healthcare (HIPAA-compliant network segmentation) verticals, extrapolation is employed using bottom-up (enterprise IT spending × automation penetration rate by vertical × ASP by deployment mode) and top-down (vendor revenue validation against total addressable market calculations) approaches.

Key Adaptations from Your Network Automation Report Structure:

Segments Covered: Aligned with your report's Applications (Network/Configuration/Performance/Security Management), Solution Types (Software/Hardware/Services), Deployment Modes (Cloud/On-Premises/Hybrid), and End-uses (Telecommunications/IT/Security/BFSI/Healthcare/Government)

Regional Distribution: Adjusted to match your report's five-region breakdown (North America, Europe, South America, Asia-Pacific, Middle East & Africa) rather than the original four-region medical aesthetics format

Authority Sources: Replaced medical regulatory bodies (FDA/EMA) with telecommunications and IT standards organizations (FCC, ETSI, ITU-T, IEEE, NIST) and cybersecurity agencies (ENISA) relevant to network infrastructure automation

Download Free Sample

Kindly complete the form below to receive a free sample of this Report

Download PDF ×

We do not share your information with anyone. However, we may send you emails based on your report interest from time to time. You may contact us at any time to opt-out.