ID: MRFR/HC/8108-HCR
200 Pages
Rahul Gotadki
Last Updated: April 06, 2026
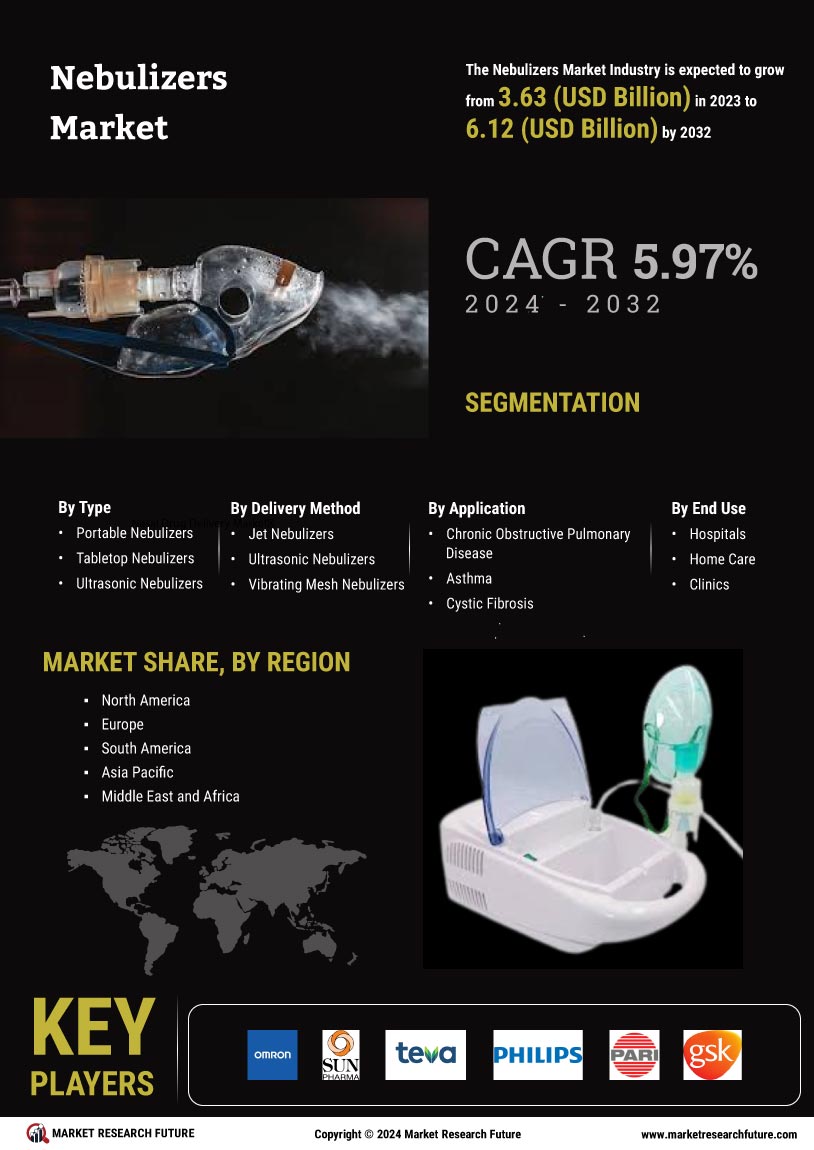
Nebulizers Market Research Report By Product Type (Compressed Air Nebulizers, Ultrasonic Nebulizers, Mesh Nebulizers, Pneumatic Nebulizers), By Indication (Asthma, Chronic Obstructive Pulmonary Disease, Cystic Fibrosis, Other Respiratory Conditions), By End-user (Homecare, Hospital, Pharmaceutical Companies, Research Laboratories), By Distribution Channel (Retail Pharmacies, Online Pharmacies, Hospitals, Medical Supply Stores), and By Regional (North America, Europe, South America, Asia Pacific, Middle East and Africa) - Growth & Industry Forecast 2025 To 2035