ID: MRFR/F-B & N/3050-HCR | February 2021 | Region: Global | 110 pages
Market Scenario
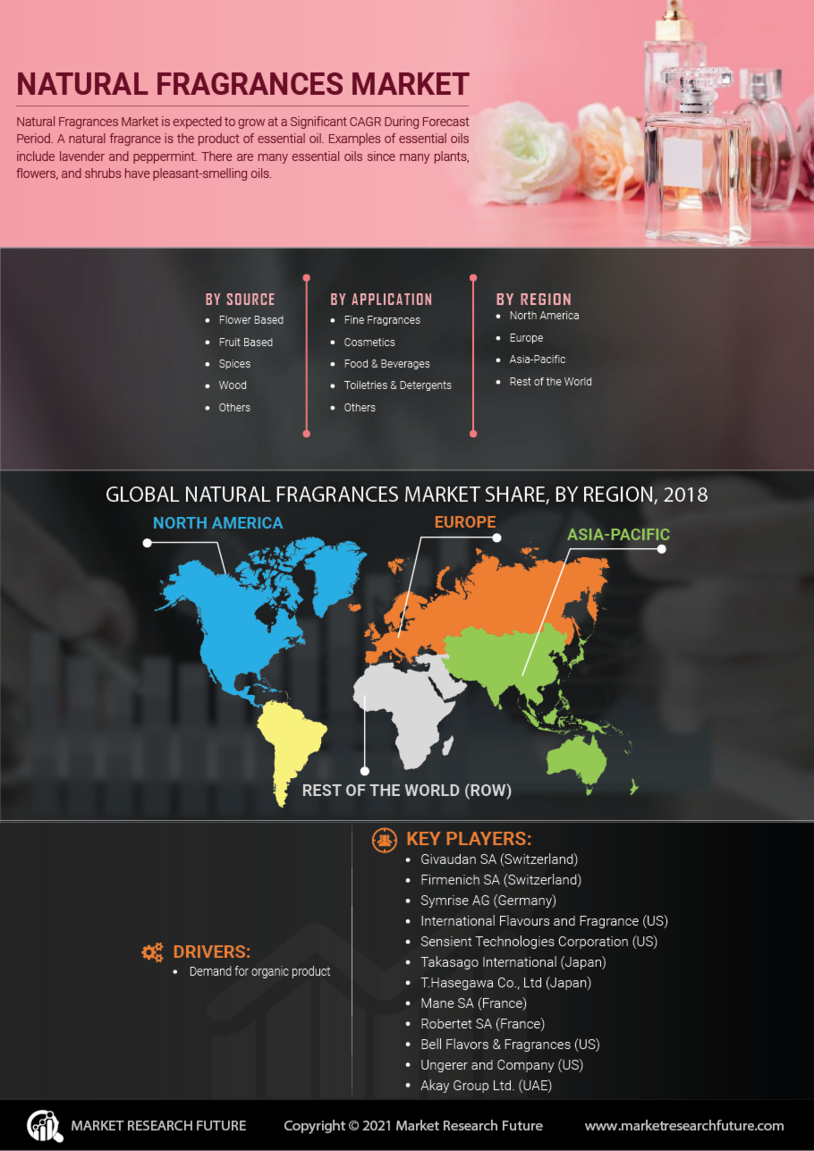
Natural fragrances refer to products such as essential oils or extracts obtained from natural ingredients, which are added to various products to provide a unique smell. The global natural fragrances market is witnessing a high growth due to increasing usage of natural fragrances over synthetic fragrances in variety of products across cosmetics, food & beverages, and fine fragrances industries. One of the significant reasons for the increasing growth of natural fragrances is the increasing consumer awareness regarding harmful effects of chemicals and other synthetic products on the human body. Furthermore, consumers are also becoming aware regarding the numerous health benefits of natural fragrances used in the form of essential oils in various treatments and aromatherapy is expected to drive the growth of the market.
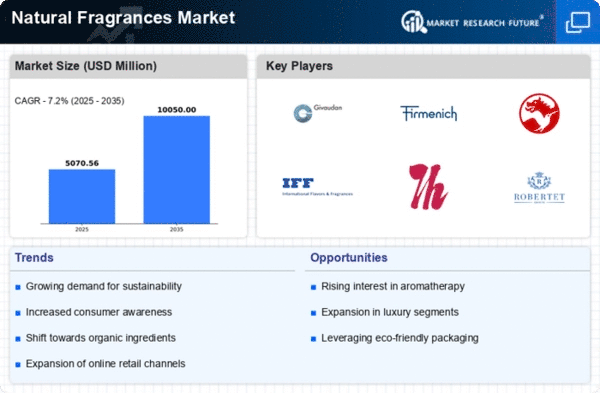
Additionally, this encourages manufacturers to produces natural fragrances and eventually increasing the demand for natural fragrances. Thus, these factors are expected to drive the growth of the natural fragrances market. The global natural fragrances market is expected to register a growth rate of 5.2% during the forecast period of 2019 to 2024 to reach USD 20.8 billion by 2024.
Segmentation
The global natural fragrances market has been segmented based on source, application, and region.
By source, the global natural fragrances market has been classified as flower-based, fruit-based, spices, wood, and others. The fruit-based segment is expected to garner the largest revenue share and also is expected to be the fastest-growing segment in the global natural fragrances market.
By application, the global natural fragrances market has also been segregated into fine fragrances, cosmetics, food & beverages, toiletries & detergents, and others. The fine fragrances segment is expected to gain the highest revenue share of the global natural fragrances market. However, the demand for natural fragrances is increasing in the cosmetic industry, due to the growing preference for consumers towards natural ingredients in the cosmetics products. This, in turn, is expected to boost the growth of the market.
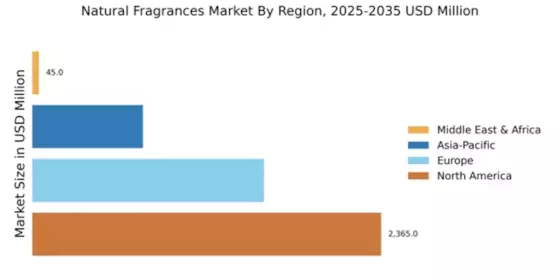
The global natural fragrances market has been studied with regard to four key regions—North America, Europe, Asia-Pacific, and the rest of the world.
The North American natural fragrances market has further been segmented into the US, Canada, and Mexico. The European natural fragrances market has been classified as the UK, Germany, France, Italy, Spain, and the rest of Europe. The natural fragrances market in Asia-Pacific has been segmented into China, India, Japan, Australia & New Zealand, and the rest of Asia-Pacific. The natural fragrances market in the rest of the world has been segmented into South America, the Middle East, and Africa.
Key Players
Givaudan SA (Switzerland), Firmenich SA (Switzerland), Symrise AG (Germany), International Flavours and Fragrance (US), Sensient Technologies Corporation (US), Takasago International (Japan), T.Hasegawa Co., Ltd (Japan), Mane SA (France), Robertet SA (France), Bell Flavors & Fragrances (US), Ungerer and Company (US), Akay Group Ltd. (UAE), Natural Fragrance Company Ltd. (UK), BMV Fragrances Private Limited (India) are some of the key players in the global natural fragrances market.
Regional Market Summary
Asia-Pacific is projected to gain the lion’s share in the global natural fragrances market and grow with an impressive CAGR during the forecast period. India, China, Japan, and Vietnam are among the major markets contributing to the growth of the regional market. Moreover, the growing preference for natural ingredients in variety of cosmetics, personal care, and toiletries products among consumers is also boosting market growth of natural fragrances in the region.
Global Natural Fragrances Market, by Source
Frequently Asked Questions (FAQ) :
Natural fragrances market valuation is predicted to touch USD 20.8 billion by 2024.
Natural fragrances market is projected to display a CAGR of 5.2% from 2019 to 2024.
Natural fragrances market is driven by the emphasis on aroma in foods and beverages and cosmetic products.
APAC can lead the global natural fragrances market till 2024 due to its procurement by customers in Chin
Robertet SA, BMV Fragrances Private Limited, Natural Fragrance Company Ltd., Sensient Technologies Corporation, Givaudan SA, Akay Group Ltd., Symrise AG, International Flavours and Fragrance, Bell Flavors & Fragrances, Ungerer and Company, Takasago International, T.Hasegawa Co., Ltd, Mane SA, and Firmenich SA are key players of the global natural fragrances market.
TABLE OF CONTENTS
1. 1 EXECUTIVE SUMMARY
1.1. Market Attractiveness Analysis
1.1.1. Global Natural Fragrances Market, by Source
1.1.2. Global Natural Fragrances Market, by Application
1.1.3. Global Natural Fragrances Market, by Region
2. MARKET INTRODUCTION
2.1. Definition
2.2. Scope of the Study
2.3. Market Structure
2.4. Key Buying Criteria
2.5. Macro Factor Indicator Analysis
3. RESEARCH METHODOLOGY
3.1. Research Process
3.2. Primary Research
3.3. Secondary Research
3.4. Market Size Estimation
3.5. Forecast Model
3.6. List of Assumptions
4. MARKET DYNAMICS
4.1. Introduction
4.2. Drivers
4.2.1. Driver 1
4.2.2. Driver 2
4.3. Restraints
4.3.1. Restraint 1
4.3.2. Restraint 2
4.4. Opportunities
4.4.1. Opportunity 1
4.4.2. Opportunity 2
4.5. Challenges
4.5.1. Challenge 1
4.5.2. Challenge 2
5. MARKET FACTOR ANALYSIS
5.1. Value Chain Analysis
5.2. Supply Chain Analysis
5.3. Porter’s Five Forces Model
5.3.1. Bargaining Power of Suppliers
5.3.2. Bargaining Power of Buyers
5.3.3. Threat of New Entrants
5.3.4. Threat of Substitutes
5.3.5. Intensity of Rivalry
6. GLOBAL NATURAL FRAGRANCES MARKET, BY SOURCE
6.1. Introduction
6.2. Flower Based
6.2.1. Flower Based: Market Estimates & Forecast by Region/Country, 2019-2024
6.3. Fruit Based
6.3.1. Fruit Based: Market Estimates & Forecast by Region/Country, 2019-2024
6.4. Spices
6.4.1. Spices: Market Estimates & Forecast by Region/Country, 2019-2024
6.5. Wood
6.5.1. Wood: Market Estimates & Forecast by Region/Country, 2019-2024
6.6. Others
6.6.1. Others: Market Estimates & Forecast by Region/Country, 2019-2024
7. GLOBAL NATURAL FRAGRANCES MARKET, BY APPLICATION
7.1. Introduction
7.2. Fine Fragrances
7.2.1. Fine Fragrances: Market Estimates & Forecast by Region/Country, 2019-2024
7.3. Cosmetics
7.3.1. Cosmetics: Market Estimates & Forecast by Region/Country, 2019-2024
7.4. Food & Beverages
7.4.1. Food & Beverages: Market Estimates & Forecast by Region/Country, 2019-2024
7.5. Toiletries & Detergents
7.5.1. Toiletries & Detergent: Market Estimates & Forecast by Region/Country, 2019-2024
7.6. Others
7.6.1. Others: Market Estimates & Forecast by Region/Country, 2019-2024
8. GLOBAL NATURAL FRAGRANCES MARKET, BY REGION
8.1. Introduction
8.2. North America
8.2.1. Market Estimates & Forecast by Source, 2019-2024
8.2.2. Market Estimates & Forecast by Application, 2019-2024
8.2.3. Market Estimates & Forecast by Country, 2019-2024
8.2.4. US
8.2.4.1. Market Estimates & Forecast by Source, 2019-2024
8.2.4.2. Market Estimates & Forecast by Application, 2019-2024
8.2.5. Canada
8.2.5.1. Market Estimates & Forecast by Source, 2019-2024
8.2.5.2. Market Estimates & Forecast by Application, 2019-2024
8.2.6. Mexico
8.2.6.1. Market Estimates & Forecast by Source, 2019-2024
8.2.6.2. Market Estimates & Forecast by Application, 2019-2024
8.3. Europe
8.3.1. Market Estimates & Forecast by Source, 2019-2024
8.3.2. Market Estimates & Forecast by Application, 2019-2024
8.3.3. Market Estimates & Forecast by Country, 2019-2024
8.3.4. Germany
8.3.4.1. Market Estimates & Forecast by Source, 2019-2024
8.3.4.2. Market Estimates & Forecast by Application, 2019-2024
8.3.5. UK
8.3.5.1. Market Estimates & Forecast by Source, 2019-2024
8.3.5.2. Market Estimates & Forecast by Application, 2019-2024
8.3.6. France
8.3.6.1. Market Estimates & Forecast by Source, 2019-2024
8.3.6.2. Market Estimates & Forecast by Application, 2019-2024
8.3.7. Spain
8.3.7.1. Market Estimates & Forecast by Source, 2019-2024
8.3.7.2. Market Estimates & Forecast by Application, 2019-2024
8.3.8. Italy
8.3.8.1. Market Estimates & Forecast by Source, 2019-2024
8.3.8.2. Market Estimates & Forecast by Application, 2019-2024
8.3.9. Rest of Europe
8.3.9.1. Market Estimates & Forecast by Source, 2019-2024
8.3.9.2. Market Estimates & Forecast by Application, 2019-2024
8.4. Asia-Pacific
8.4.1. Market Estimates & Forecast by Source, 2019-2024
8.4.2. Market Estimates & Forecast by Application, 2019-2024
8.4.3. Market Estimates & Forecast by Country, 2019-2024
8.4.4. China
8.4.4.1. Market Estimates & Forecast by Source, 2019-2024
8.4.4.2. Market Estimates & Forecast by Application, 2019-2024
8.4.5. Japan
8.4.5.1. Market Estimates & Forecast by Source, 2019-2024
8.4.5.2. Market Estimates & Forecast by Application, 2019-2024
8.4.6. India
8.4.6.1. Market Estimates & Forecast by Source, 2019-2024
8.4.6.2. Market Estimates & Forecast by Application, 2019-2024
8.4.7. Australia & New Zealand
8.4.7.1. Market Estimates & Forecast by Source, 2019-2024
8.4.7.2. Market Estimates & Forecast by Application, 2019-2024
8.4.8. Rest of Asia-Pacific
8.4.8.1. Market Estimates & Forecast by Source, 2019-2024
8.4.8.2. Market Estimates & Forecast by Application, 2019-2024
8.5. Rest of the World
8.5.1. Market Estimates & Forecast by Source, 2019-2024
8.5.2. Market Estimates & Forecast by Application, 2019-2024
8.5.3. Market Estimates & Forecast by Region, 2019-2024
8.5.4. South America
8.5.4.1. Market Estimates & Forecast by Source, 2019-2024
8.5.4.2. Market Estimates & Forecast by Application, 2019-2024
8.5.5. Middle East
8.5.5.1. Market Estimates & Forecast by Source, 2019-2024
8.5.5.2. Market Estimates & Forecast by Application, 2019-2024
8.5.6. Africa
8.5.6.1. Market Estimates & Forecast by Source, 2019-2024
8.5.6.2. Market Estimates & Forecast by Application, 2019-2024
9. COMPETITIVE LANDSCAPE
9.1. Introduction
9.2. Competitive Benchmarking
9.3. Development Share Analysis
9.4. Key Developments & Growth Strategies
10. COMPANY PROFILES
10.1. Givaudan SA
10.1.1. Company Overview
10.1.2. Financial Overview
10.1.3. Products Offered
10.1.4. Key Developments
10.1.5. SWOT Analysis
10.1.6. Key Strategies
10.2. Firmenich SA
10.2.1. Company Overview
10.2.2. Financial Overview
10.2.3. Products Offered
10.2.4. Key Developments
10.2.5. SWOT Analysis
10.2.6. Key Strategies
10.3. Symrise AG
10.3.1. Company Overview
10.3.2. Financial Overview
10.3.3. Products Offered
10.3.4. Key Developments
10.3.5. SWOT Analysis
10.3.6. Key Strategies
10.4. International Flavours and Fragrance
10.4.1. Company Overview
10.4.2. Financial Overview
10.4.3. Products Offered
10.4.4. Key Developments
10.4.5. SWOT Analysis
10.4.6. Key Strategies
10.5. Sensient Technologies Corporation
10.5.1. Company Overview
10.5.2. Financial Overview
10.5.3. Products Offered
10.5.4. Key Developments
10.5.5. SWOT Analysis
10.5.6. Key Strategies
10.6. Takasago International
10.6.1. Company Overview
10.6.2. Financial Overview
10.6.3. Products Offered
10.6.4. Key Developments
10.6.5. SWOT Analysis
10.6.6. Key Strategies
10.6.7. Key Strategies
10.7. T.Hasegawa Co., Ltd
10.7.1. Company Overview
10.7.2. Financial Overview
10.7.3. Products Offered
10.7.4. Key Developments
10.7.5. SWOT Analysis
10.7.6. Key Strategies
10.8. Mane SA
10.8.1. Company Overview
10.8.2. Financial Overview
10.8.3. Products Offered
10.8.4. Key Developments
10.8.5. SWOT Analysis
10.8.6. Key Strategies
10.9. Robertet SA
10.9.1. Company Overview
10.9.2. Financial Overview
10.9.3. Products Offered
10.9.4. Key Developments
10.9.5. SWOT Analysis
10.9.6. Key Strategies
10.10. Bell Flavors & Fragrances
10.10.1. Company Overview
10.10.2. Financial Overview
10.10.3. Products Offered
10.10.4. Key Developments
10.10.5. SWOT Analysis
10.10.6. Key Strategies
10.11. Ungerer and Company
10.11.1. Company Overview
10.11.2. Financial Overview
10.11.3. Products Offered
10.11.4. Key Developments
10.11.5. SWOT Analysis
10.11.6. Key Strategies
10.12. Akay Group Ltd.
10.12.1. Company Overview
10.12.2. Financial Overview
10.12.3. Products Offered
10.12.4. Key Developments
10.12.5. SWOT Analysis
10.12.6. Key Strategies
10.13. Natural Fragrance Company Ltd.
10.13.1. Company Overview
10.13.2. Financial Overview
10.13.3. Products Offered
10.13.4. Key Developments
10.13.5. SWOT Analysis
10.13.6. Key Strategies
10.14. BMV Fragrances Private Limited
10.14.1. Company Overview
10.14.2. Financial Overview
10.14.3. Products Offered
10.14.4. Key Developments
10.14.5. SWOT Analysis
10.14.6. Key Strategies
11. APPENDIX
11.1. General Sources & References
11.2. List of Abbreviation
LIST OF TABLES
Table 1 Global Natural Fragrances Market, by Region, 2018–2023 (USD Million)
Table 2 Global Natural Fragrances Market, by Source, 2018–2023 (USD Million)
Table 3 Global Natural Fragrances Market, by Application, 2018–2023 (USD Million)
Table 4 North America: Natural Fragrances Market, by Country, 2018–2023 (USD Million)
Table 5 North America: Natural Fragrances Market, by Source, 2018–2023 (USD Million)
Table 6 North America: Natural Fragrances Market, by Application, 2018–2023 (USD Million)
Table 7 US: Natural Fragrances Market, by Source, 2018–2023 (USD Million)
Table 8 US: Natural Fragrances Market, by Application, 2018–2023 (USD Million)
Table 9 Canada: Natural Fragrances Market, by Source, 2018–2023 (USD Million)
Table 10 Canada: Natural Fragrances Market, by Application, 2018–2023 (USD Million)
Table 11 Mexico: Natural Fragrances Market, by Source, 2018–2023 (USD Million)
Table 12 Mexico: Natural Fragrances Market, by Application, 2018–2023 (USD Million)
Table 13 Europe: Natural Fragrances Market, by Country, 2018–2023 (USD Million)
Table 14 Europe: Natural Fragrances Market, by Source, 2018–2023 (USD Million)
Table 15 Europe: Natural Fragrances Market, by Application, 2018–2023 (USD Million)
Table 16 Germany: Natural Fragrances Market, by Source, 2018–2023 (USD Million)
Table 17 Germany: Natural Fragrances Market, by Application, 2018–2023 (USD Million)
Table 18 France: Natural Fragrances Market, by Source, 2018–2023 (USD Million)
Table 19 France: Natural Fragrances Market, by Application, 2018–2023 (USD Million)
Table 20 Italy: Natural Fragrances Market, by Source, 2018–2023 (USD Million)
Table 21 Italy: Natural Fragrances Market, by Application, 2018–2023 (USD Million)
Table 22 Spain: Natural Fragrances Market, by Source, 2018–2023 (USD Million)
Table 23 Spain: Natural Fragrances Market, by Application, 2018–2023 (USD Million)
Table 24 UK: Natural Fragrances Market, by Source, 2018–2023 (USD Million)
Table 25 UK: Natural Fragrances Market, by Application, 2018–2023 (USD Million)
Table 26 Rest of Europe: Natural Fragrances Market, by Source, 2018–2023 (USD Million)
Table 27 Rest of Europe: Natural Fragrances Market, by Application, 2018–2023 (USD Million)
Table 28 Asia-Pacific: Natural Fragrances Market, by Country, 2018–2023 (USD Million)
Table 29 Asia-Pacific: Natural Fragrances Market, by Source, 2018–2023 (USD Million)
Table 30 Asia-Pacific: Natural Fragrances Market, by Application, 2018–2023 (USD Million)
Table 31 China: Natural Fragrances Market, by Source, 2018–2023 (USD Million)
Table 32 China: Natural Fragrances Market, by Application, 2018–2023 (USD Million)
Table 33 India: Natural Fragrances Market, by Source, 2018–2023 (USD Million)
Table 34 India: Natural Fragrances Market, by Application, 2018–2023 (USD Million)
Table 35 Japan: Natural Fragrances Market, by Source, 2018–2023 (USD Million)
Table 36 Japan: Natural Fragrances Market, by Application, 2018–2023 (USD Million)
Table 37 Australia & New Zealand: Natural Fragrances Market, by Source, 2018–2023 (USD Million)
Table 38 Australia & New Zealand: Natural Fragrances Market, by Application, 2018–2023 (USD Million)
Table 39 Rest of Asia-Pacific: Natural Fragrances Market, by Source, 2018–2023 (USD Million)
Table 40 Rest of Asia-Pacific: Natural Fragrances Market, by Application, 2018–2023 (USD Million)
Table 41 Rest of the World (RoW): Natural Fragrances Market, by Country, 2018–2023 (USD Million)
Table 42 Rest of the World (RoW): Natural Fragrances Market, by Source, 2018–2023 (USD Million)
Table 43 Rest of the World (RoW): Natural Fragrances Market, by Application, 2018–2023 (USD Million)
Table 44 South America: Natural Fragrances Market, by Source, 2018–2023 (USD Million)
Table 45 South America: Natural Fragrances Market, by Application, 2018–2023 (USD Million)
Table 46 Middle East: Natural Fragrances Market, by Source, 2018–2023 (USD Million)
Table 47 Middle East: Natural Fragrances Market, by Application, 2018–2023 (USD Million)
Table 48 Africa: Natural Fragrances Market, by Source, 2018–2023 (USD Million)
Table 49 Africa: Natural Fragrances Market, by Application, 2018–2023 (USD Million)
LIST OF FIGURES
FIGURE 1 Global Natural Fragrances Market Segmentation
FIGURE 2 Forecast Research Methodology
FIGURE 3 Five Forces Analysis of Global Natural Fragrances Market
FIGURE 4 Value Chain of Global Natural Fragrances Market
FIGURE 5 Share of Global Natural Fragrances Market in 2018, by Country (%)
FIGURE 6 Global Natural Fragrances Market, by Region, 2019–2024,
FIGURE 7 Global Natural Fragrances Market Size, by Source, 2018
FIGURE 8 Share of Global Natural Fragrances Market, by Source, 2019–2024 (%)
FIGURE 9 Global Natural Fragrances Market Size, by Application, 2018
FIGURE 10 Share of Global Natural Fragrances Market, by Application, 2019–2024 (%)