Global Motor Vehicle Market Overview
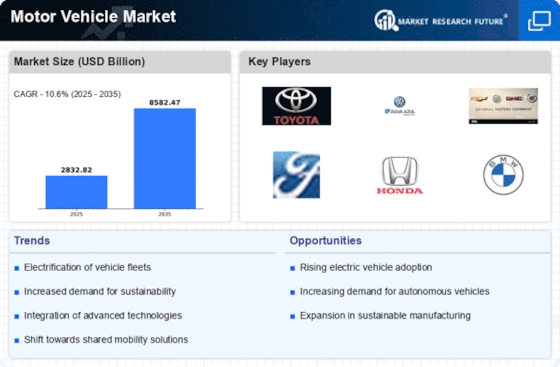
As per MRFR analysis, the Motor Vehicle Market Size was estimated at 2,377.62 (USD Billion) in 2023.The Motor Vehicle Market Industry is expected to grow from 2,424.22(USD Billion) in 2024 to 3,000 (USD Billion) by 2035. The Motor Vehicle Market CAGR (growth rate) is expected to be around 1.96% during the forecast period (2025 - 2035).
Key Motor Vehicle Market Trends Highlighted
There are a number of major changes happening right now in the Motor Vehicle Market that are changing how the industry works. One important factor driving the market is the growing demand for electric cars (EVs) from consumers, which is being fuelled by worries about the environment and government initiatives that encourage eco-friendly transportation options.
Many governments throughout the globe have set high goals to get rid of internal combustion engines. This has led car companies to put money into greener technology.
Another big reason is that car technology is becoming better, such as self-driving cars and capabilities that let you connect to the internet. These make driving safer and more enjoyable overall.
One chance to look into the worldwide market is the rising interest in mobility-as-a-service (MaaS), which moves the emphasis from owning a car to using shared transportation. This approach fits with the trend of cities being bigger because they want to cut down on traffic and make the air cleaner.
The rise of ride-sharing apps also gives both new and old car firms a chance to try out a new business model. Many people are using smart cars that have artificial intelligence and Internet of Things (IoT) features in them these days. This change makes it easier to monitor, maintain, and customize vehicles, which appeals to a growing number of tech-savvy customers.
Sustainability trends are also encouraging manufacturers and suppliers to look into new materials and manufacturing methods in order to make the supply chain more sustainable. These changes are changing the global motor vehicle industry. Therefore, firms need to be flexible and able to change to suit changing customer needs and government rules.

Source: Primary Research, Secondary Research, MRFR Database and Analyst Review
Motor Vehicle Market Drivers
Increasing Demand for Electric Vehicles (EVs)
The shift towards electric vehicles in the Motor Vehicle Market Industry is gaining momentum due to increasing environmental concerns and stringent regulations on emissions.
According to reports from the International Energy Agency, the number of electric vehicles on the road globally surpassed 10 million in 2020, reflecting a 43% increase from the previous year.
Moreover, the global market for electric vehicles is predicted to grow rapidly, driven by advancements in battery technology and government incentives for consumers.
Major automotive companies such as Tesla, General Motors, and Volkswagen are heavily investing in electric vehicle platforms, which is significantly contributing to market growth.
The European Union's aim of making all new cars emissions-free by 2035 is also expected to accelerate the adoption of electric vehicles, positioning the Motor Vehicle Market Industry to benefit from this significant regulatory shift.
Technological Advancements in Automation and AI
The integration of advanced technologies, particularly automation and artificial intelligence, is reshaping the Motor Vehicle Market Industry. For instance, self-driving technology is being adopted at a rapid pace, with experts estimating that approximately 10 million autonomous vehicles may be on roads by 2025.
Companies like Waymo and Ford are at the forefront of this technological revolution, investing heavily in Research and Development to improve safety and efficiency.
Government policies are also endorsing this shift as seen in various countries implementing pilot programs for autonomous vehicles. By enhancing safety features and reducing operational costs, the integration of automation is poised to drive significant growth in the Motor Vehicle Market.
Rising Urbanization and Changing Consumer Preferences
Urbanization is driving a transformation in the Motor Vehicle Market Industry as more people move to urban areas. According to the United Nations, by 2050, 68% of the worldโs population is expected to live in urban areas, which is prompting a shift in consumer preferences.
Urban residents tend to favor smaller vehicles that are more fuel-efficient and suited for congested cities. The demand for compact cars and hybrids is increasing, leading to innovations in vehicle design and technology by major manufacturers such as Honda and Toyota.
This adaptation to consumer preferences is expected to propel the Motor Vehicle Market forward, especially in regions with high urban growth.
Motor Vehicle Market Segment Insights
Motor Vehicle Market Type Insights
The Motor Vehicle Market is a diverse landscape segmented by type, reflective of the varied consumer preferences and technological advancements within the industry. As of 2024, the overall market is set to reach a value of 2424.22 USD Billion, playing a pivotal role in economies worldwide.
Among the types of motor vehicles, the Passenger Car holds majority significance, valued at 1400.0 USD Billion, and projected to grow to 1800.0 USD Billion by 2035. This segment dominates the market due to the increasing preference for personal mobility and advancements in electric vehicle technology, catering to both urban and suburban environments.
Following closely, the Commercial Vehicle segment stands at 404.22 USD Billion in 2024 and is expected to rise to 420.0 USD Billion by 2035, showcasing steady growth driven by the expansion of e-commerce and logistic industries.
The necessity for robust transportation solutions contributes to this segment's importance and emphasizes its integration into business operations globally.
Motorcycles, valued at 380.0 USD Billion in 2024 and projected to reach 480.0 USD Billion by 2035, cater to specific markets particularly in densely populated and developing urban areas where space conservation is essential. This segment has shown steady interest from consumers seeking cost-effective and maneuverable options for commuting.
Similarly, the Bicycle segment, while comparatively smaller, has a valuation of 240.0 USD Billion in 2024, expected to grow to 300.0 USD Billion by 2035, reflecting the global trend towards sustainability and health consciousness. The rise in environmental awareness has propelled this segment as an eco-friendly transportation choice.
Overall, the Motor Vehicle Market segmentation reveals a well-distributed focus on fulfilling diverse consumer needs and adapting to societal shifts. Trends such as urbanization, technological innovation, and sustainability are critical growth drivers, influencing purchasing decisions across all vehicle types.
The demand for eco-friendly vehicles and alternative mobility solutions offers significant opportunities for growth within these segments while also posing challenges such as regulatory frameworks and supply chain dependencies. Each segment contributes uniquely to the overall strength of the industry, ensuring a balanced progression towards the future.
The insights from the Motor Vehicle Market data illustrate a cohesive picture of a market in constant evolution, driven by consumer demand and technological advancements.

Source: Primary Research, Secondary Research, MRFR Database and Analyst Review
Motor Vehicle Market Fuel Type Insights
The Motor Vehicle Market, focusing on the Fuel Type segment, has shown substantial growth, with a market value of 2424.22 USD Billion in 2024. This segment is primarily divided into three main categories: Gasoline, Diesel, and Other Fuel Types.
Gasoline remains a predominant choice among consumers due to its widespread availability and relatively lower cost compared to alternatives, accounting for a significant portion of vehicle registrations globally.
Diesel is also a crucial player in this market, particularly favored in commercial transportation due to its fuel efficiency and torque performance, catering to heavy-duty applications.
Meanwhile, Other Fuel Types, including electric and alternative fuels, are gaining momentum as the industry shifts towards sustainability and reducing carbon emissions. This growing interest offers opportunities for innovation in fuel technologies and infrastructure development.
The market is further driven by government initiatives promoting cleaner fuels and stricter emission regulations, fostering growth in the Fuel Type segment of the Motor Vehicle Market. Such trends contribute to the evolving landscape of the industry, addressing environmental concerns while meeting consumer demand for efficiency and variety in fuel options.
Motor Vehicle Market Engine Capacity Insights
The Motor Vehicle Market, particularly within the Engine Capacity segment, reflects significant trends and patterns influencing overall dynamics. By 2024, the market is poised to be valued at 2424.22 USD Billion, showcasing robust growth potential influenced by changes in consumer preferences and technological advancements.
The Engine Capacity market comprises various categories, including vehicles with engine capacities of less than 1000 Cc, between 1000-1500 Cc, 1500-2000 Cc, and those exceeding 2000 Cc. Smaller engines, often seen in compact cars, are increasingly favored for their fuel efficiency and lower emissions, appealing to environmentally conscious consumers.
In contrast, engine capacities above 2000 Cc are more prevalent in larger vehicles, such as SUVs and luxury cars, which continue to attract buyers seeking performance and comfort. The Motor Vehicle Market revenue is also impacted by regulatory changes aimed at reducing carbon footprints, pushing manufacturers to innovate and enhance engine efficiency.
With rising urbanization and disposable income globally, the demand within each engine capacity category varies, presenting unique challenges and opportunities. Overall, the segmentation of engine capacity plays a pivotal role in shaping vehicle performance, consumer choice, and market growth strategies.
Motor Vehicle Market Propulsion Type Insights
The Motor Vehicle Market is evolving significantly, with pivotal emphasis on the Propulsion Type segment, reflecting the changing preferences in transportation technologies. The market is expected to be valued at 2424.22 USD Billion in 2024, showcasing robust growth prospects.
Within this segment, notable categories such as Internal Combustion (IC) Engine and Electric Vehicles are fundamentally reshaping the landscape. The IC Engine continues to dominate the market, primarily due to its established infrastructure and widespread consumer familiarity.
However, Electric Vehicles are gaining traction, driven by increasing awareness of environmental sustainability and government policies advocating for reduced emissions. The growing demand for cleaner transportation options has positioned Electric Vehicles as a rapidly emerging segment with substantial growth potential.
Overall, the Motor Vehicle Market segmentation highlights the importance of these propulsion types, reflecting global trends towards innovation and sustainability in the automotive industry while addressing market statistics that underscore this transformational phase.
Motor Vehicle Market Regional Insights
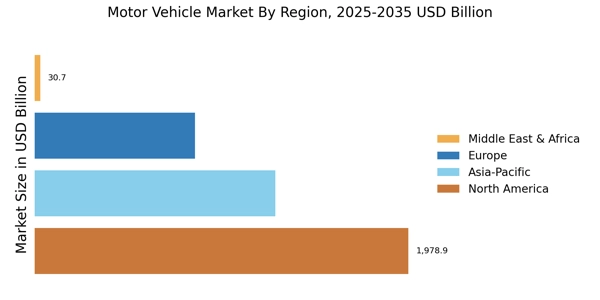
The Motor Vehicle Market is a significant sector projected to be valued at 2424.22 USD Billion by 2024. The Regional segmentation plays a pivotal role in understanding market dynamics, with North America valued at 700.0 USD Billion, followed by Europe at 640.0 USD Billion.
Asia Pacific dominates the market with a valuation of 850.0 USD Billion, reflecting its significant demand and production capabilities. South America, valued at 120.0 USD Billion, and the Middle East and Africa, with a valuation of 114.22 USD Billion, showcase emerging markets with growth potential.
The Asia Pacific region stands out due to its majority holding in both manufacturing and consumption, driven by a burgeoning middle class and rapid urbanization.
North America's value position is bolstered by advanced technology and innovation in vehicle design, while Europe focuses on sustainability and regulatory compliance. As cities grow, the demand for efficient transportation solutions increases, presenting opportunities across all regions.
However, challenges include regulatory hurdles and market volatility which may impact growth. As the market evolves, opportunities arise in electric and hybrid vehicles, driven by consumer preferences and environmental awareness.
Overall, the Regional analysis of the Motor Vehicle Market reveals essential insights into trends, dynamics, and future growth potential.

Source: Primary Research, Secondary Research, MRFR Database and Analyst Review
Motor Vehicle Market Key Players and Competitive Insights
The Motor Vehicle Market is characterized by intense competition among manufacturers striving to capture market share, innovate, and meet the diverse needs of consumers worldwide. Key trends such as electrification, automation, and digitization are reshaping the landscape, pushing companies to adapt rapidly to changing consumer preferences and regulatory requirements.
The competitive dynamics are influenced by various factors, including technological advancements, supply chain management, and strategic collaborations. Companies are leveraging advanced manufacturing processes and investing in sustainable practices to gain a competitive edge.
Additionally, the rise of electric vehicles and advancements in mobility solutions have intensified competition, prompting legacy automakers as well as new entrants to redefine their strategies in order to thrive in a market characterized by both opportunity and threat.
BMW stands out in the Motor Vehicle Market due to its strong brand reputation for luxury, performance, and innovation. The company has established a robust market presence with a broad portfolio of vehicles that caters to various segments, from compact cars to high-end sports models.
BMWโs commitment to research and development has positioned it as a leader in electric and hybrid vehicle technology, showcasing strengths such as superior engineering, cutting-edge design, and a focus on sustainability.
Additionally, BMW's strong global distribution network and strategic partnerships enhance its competitive advantage, enabling it to respond swiftly to emerging market trends and consumer demands while capitalizing on economies of scale.
Subaru differentiates itself in the Motor Vehicle Market primarily through its focus on all-wheel-drive technology and safety features, appealing to a niche market of adventurous and safety-conscious consumers. The company offers a range of key products including compact SUVs, sedans, and crossovers that emphasize reliability and performance.
Subaru's market presence is bolstered by a loyal customer base, enhanced by its reputation for durability and resale value. The brand has made significant strides in increasing its global footprint through strategic initiatives and collaborations, including partnerships that enhance its technological offerings and expand its reach.
Subaruโs strengths lie in its commitment to quality, community engagement, and environmental consciousness, as demonstrated by its efforts in sustainability and recent mergers and acquisitions aimed at strengthening its product lineup and market position on a global scale.
Key Companies in the Motor Vehicle Market Include
- BMW
- Subaru
- Porsche
- Hyundai
- Toyota
- Mazda
- Honda
- Volkswagen
- SAIC Motor
- Nissan
- Ford
- Kia
- General Motors
Motor Vehicle Industry Developments
In October 2023, multiple manufacturers in the Motor Vehicle Industry have been making headlines due to significant developments. BMW announced the expansion of its electric vehicle lineup, aiming for substantial sales growth. Subaru is focusing on hydrogen fuel cell technology to ensure sustainability in its vehicle development.
Meanwhile, Porsche reported enhanced delivery capabilities due to improved supply chain management. Hyundai's ongoing investment in autonomous vehicle technology signals its commitment to future mobility solutions.
Recent market analysis indicates growth in the valuations of Toyota, Kia, and General Motors, driven by increased consumer interest in electric vehicles. In August 2023, Ford acquired a startup specializing in battery technology, enhancing its position in the EV sector.
Notably, Volkswagen has partnered with battery suppliers to secure raw materials essential for electric vehicle production. The global push for sustainable mobility is reshaping strategies across the industry, marking a transformative period for major players such as Nissan as they innovate in response to market demand and regulatory pressures.
Report Attribute/Metric |
Details |
Market Size 2023 |
2377.62(USD Billion) |
Market Size 2024 |
2424.22(USD Billion) |
Market Size 2035 |
3000.0(USD Billion) |
Compound Annual Growth Rate (CAGR) |
1.96% (2025 - 2035) |
Report Coverage |
Revenue Forecast, Competitive Landscape, Growth Factors, and Trends |
Base Year |
2024 |
Market Forecast Period |
2025 - 2035 |
Historical Data |
2019 - 2024 |
Market Forecast Units |
USD Billion |
Key Companies Profiled |
BMW, Subaru, Porsche, Hyundai, Toyota, Mazda, Honda, Volkswagen, SAIC Motor, Nissan, Ford, Kia, General Motors |
Segments Covered |
Type, Fuel Type, Engine Capacity, Propulsion Type, Regional |
Key Market Opportunities |
Electric vehicle adoption surge, Autonomous driving technology advancements, Sustainable materials integration, Smart mobility solutions expansion, Connected vehicle ecosystems development |
Key Market Dynamics |
technological advancements, environmental regulations, consumer preferences shift, electric vehicle growth, supply chain disruptions |
Countries Covered |
North America, Europe, APAC, South America, MEA |
Frequently Asked Questions (FAQ):
The Motor Vehicle Market is expected to be valued at approximately 2424.22 USD Billion in 2024.
By 2035, the Motor Vehicle Market is projected to reach a value of around 3000 USD Billion.
The expected CAGR for the Motor Vehicle Market from 2025 to 2035 is approximately 1.96%.
North America is expected to have the largest market share in the Motor Vehicle Market, valued at 700 USD Billion in 2024.
The Asia Pacific region will have a market value of around 850 USD Billion in 2024.
The projected market size for Passenger Cars is approximately 1800 USD Billion by 2035.
Major players in the Motor Vehicle Market include Toyota, Ford, Volkswagen, and General Motors, among others.
The Commercial Vehicle segment is expected to have a market value close to 404.22 USD Billion in 2024, with modest growth anticipated.
South America's market size for the Motor Vehicle Market is projected to reach approximately 150 USD Billion by 2035.
Key trends include the shift towards electric vehicles, increasing consumer demand for fuel-efficient cars, and technological advancements in vehicle safety and automation
TABLE OF CONTENTS
EXECUTIVE SUMMARY
1.1. Market Overview
1.2. Key Findings
1.3. Market Segmentation
1.4. Competitive Landscape
1.5. Challenges and Opportunities
1.6. Future Outlook
MARKET INTRODUCTION
2.1. Definition
2.2. Scope of the study
2.2.1. Research Objective
2.2.2. Assumption
2.2.3. Limitations
3. RESEARCH METHODOLOGY
3.1. Overview
3.2. Data Mining
3.3. Secondary Research
3.4. Primary Research
3.4.1. Primary Interviews and Information Gathering Process
3.4.2. Breakdown of Primary Respondents
3.5. Forecasting Model
3.6. Market Size Estimation
3.6.1. Bottom-Up Approach
3.6.2. Top-Down Approach
3.7. Data Triangulation
3.8. Validation
MARKET DYNAMICS
4.1. Overview
4.2. Drivers
4.3. Restraints
4.4. Opportunities
5. MARKET FACTOR ANALYSIS
5.1. Value chain Analysis
5.2. Porter's Five Forces Analysis
5.2.1. Bargaining Power of Suppliers
5.2.2. Bargaining Power of Buyers
5.2.3. Threat of New Entrants
5.2.4. Threat of Substitutes
5.2.5. Intensity of Rivalry
5.3. COVID-19 Impact Analysis
5.3.1. Market Impact Analysis
5.3.2. Regional Impact
5.3.3. Opportunity and Threat Analysis
MOTOR VEHICLE MARKET, BY TYPE (USD BILLION)
6.1. Motorcycle
6.2. Bicycle
6.3. Passenger Car
6.4. Commercial Vehicle
7. MOTOR VEHICLE MARKET, BY FUEL TYPE (USD BILLION)
7.1. Gasoline
7.2. Diesel
7.3. Other Fuel Types
8. MOTOR VEHICLE MARKET, BY ENGINE CAPACITY (USD BILLION)
8.1. 1000 Cc
8.2. 1000-1500 Cc
8.3. 1500-2000 Cc
8.4. >2000 Cc
9. MOTOR VEHICLE MARKET, BY PROPULSION TYPE (USD BILLION)
9.1. IC Engine
9.2. Electric Vehicle
10. MOTOR VEHICLE MARKET, BY REGIONAL (USD BILLION)
10.1. North America
10.1.1. US
10.1.2. Canada
10.2. Europe
10.2.1. Germany
10.2.2. UK
10.2.3. France
10.2.4. Russia
10.2.5. Italy
10.2.6. Spain
10.2.7. Rest of Europe
10.3. APAC
10.3.1. China
10.3.2. India
10.3.3. Japan
10.3.4. South Korea
10.3.5. Malaysia
10.3.6. Thailand
10.3.7. Indonesia
10.3.8. Rest of APAC
10.4. South America
10.4.1. Brazil
10.4.2. Mexico
10.4.3. Argentina
10.4.4. Rest of South America
10.5. MEA
10.5.1. GCC Countries
10.5.2. South Africa
10.5.3. Rest of MEA
COMPETITIVE LANDSCAPE
11.1. Overview
11.2. Competitive Analysis
11.3. Market share Analysis
11.4. Major Growth Strategy in the Motor Vehicle Market
11.5. Competitive Benchmarking
11.6. Leading Players in Terms of Number of Developments in the Motor Vehicle Market
11.7. Key developments and growth strategies
11.7.1. New Product Launch/Service Deployment
11.7.2. Merger Acquisitions
11.7.3. Joint Ventures
11.8. Major Players Financial Matrix
11.8.1. Sales and Operating Income
11.8.2. Major Players RD Expenditure. 2023
12. COMPANY PROFILES
12.1. BMW
12.1.1. Financial Overview
12.1.2. Products Offered
12.1.3. Key Developments
12.1.4. SWOT Analysis
12.1.5. Key Strategies
12.2. Subaru
12.2.1. Financial Overview
12.2.2. Products Offered
12.2.3. Key Developments
12.2.4. SWOT Analysis
12.2.5. Key Strategies
12.3. Chrysler
12.3.1. Financial Overview
12.3.2. Products Offered
12.3.3. Key Developments
12.3.4. SWOT Analysis
12.3.5. Key Strategies
12.4. Porsche
12.4.1. Financial Overview
12.4.2. Products Offered
12.4.3. Key Developments
12.4.4. SWOT Analysis
12.4.5. Key Strategies
12.5. Hyundai
12.5.1. Financial Overview
12.5.2. Products Offered
12.5.3. Key Developments
12.5.4. SWOT Analysis
12.5.5. Key Strategies
12.6. Toyota
12.6.1. Financial Overview
12.6.2. Products Offered
12.6.3. Key Developments
12.6.4. SWOT Analysis
12.6.5. Key Strategies
12.7. Mazda
12.7.1. Financial Overview
12.7.2. Products Offered
12.7.3. Key Developments
12.7.4. SWOT Analysis
12.7.5. Key Strategies
12.8. Honda
12.8.1. Financial Overview
12.8.2. Products Offered
12.8.3. Key Developments
12.8.4. SWOT Analysis
12.8.5. Key Strategies
12.9. Volkswagen
12.9.1. Financial Overview
12.9.2. Products Offered
12.9.3. Key Developments
12.9.4. SWOT Analysis
12.9.5. Key Strategies
12.10. SAIC Motor
12.10.1. Financial Overview
12.10.2. Products Offered
12.10.3. Key Developments
12.10.4. SWOT Analysis
12.10.5. Key Strategies
12.11. Nissan
12.11.1. Financial Overview
12.11.2. Products Offered
12.11.3. Key Developments
12.11.4. SWOT Analysis
12.11.5. Key Strategies
12.12. Ford
12.12.1. Financial Overview
12.12.2. Products Offered
12.12.3. Key Developments
12.12.4. SWOT Analysis
12.12.5. Key Strategies
12.13. Daimler
12.13.1. Financial Overview
12.13.2. Products Offered
12.13.3. Key Developments
12.13.4. SWOT Analysis
12.13.5. Key Strategies
12.14. Kia
12.14.1. Financial Overview
12.14.2. Products Offered
12.14.3. Key Developments
12.14.4. SWOT Analysis
12.14.5. Key Strategies
12.15. General Motors
12.15.1. Financial Overview
12.15.2. Products Offered
12.15.3. Key Developments
12.15.4. SWOT Analysis
12.15.5. Key Strategies
13. APPENDIX
13.1. References
13.2. Related Reports
LIST OF TABLES
TABLE 1. LIST OF ASSUMPTIONS
TABLE 2. NORTH AMERICA MARKET SIZE ESTIMATES & FORECAST, BY TYPE, 2019-2035 (USD BILLIONS)
TABLE 3. NORTH AMERICA MARKET SIZE ESTIMATES & FORECAST, BY FUEL TYPE, 2019-2035 (USD BILLIONS)
TABLE 4. NORTH AMERICA MARKET SIZE ESTIMATES & FORECAST, BY ENGINE CAPACITY, 2019-2035 (USD BILLIONS)
TABLE 5. NORTH AMERICA MARKET SIZE ESTIMATES & FORECAST, BY PROPULSION TYPE, 2019-2035 (USD BILLIONS)
TABLE 6. NORTH AMERICA MARKET SIZE ESTIMATES & FORECAST, BY REGIONAL, 2019-2035 (USD BILLIONS)
TABLE 7. US MARKET SIZE ESTIMATES & FORECAST, BY TYPE, 2019-2035 (USD BILLIONS)
TABLE 8. US MARKET SIZE ESTIMATES & FORECAST, BY FUEL TYPE, 2019-2035 (USD BILLIONS)
TABLE 9. US MARKET SIZE ESTIMATES & FORECAST, BY ENGINE CAPACITY, 2019-2035 (USD BILLIONS)
TABLE 10. US MARKET SIZE ESTIMATES & FORECAST, BY PROPULSION TYPE, 2019-2035 (USD BILLIONS)
TABLE 11. US MARKET SIZE ESTIMATES & FORECAST, BY REGIONAL, 2019-2035 (USD BILLIONS)
TABLE 12. CANADA MARKET SIZE ESTIMATES & FORECAST, BY TYPE, 2019-2035 (USD BILLIONS)
TABLE 13. CANADA MARKET SIZE ESTIMATES & FORECAST, BY FUEL TYPE, 2019-2035 (USD BILLIONS)
TABLE 14. CANADA MARKET SIZE ESTIMATES & FORECAST, BY ENGINE CAPACITY, 2019-2035 (USD BILLIONS)
TABLE 15. CANADA MARKET SIZE ESTIMATES & FORECAST, BY PROPULSION TYPE, 2019-2035 (USD BILLIONS)
TABLE 16. CANADA MARKET SIZE ESTIMATES & FORECAST, BY REGIONAL, 2019-2035 (USD BILLIONS)
TABLE 17. EUROPE MARKET SIZE ESTIMATES & FORECAST, BY TYPE, 2019-2035 (USD BILLIONS)
TABLE 18. EUROPE MARKET SIZE ESTIMATES & FORECAST, BY FUEL TYPE, 2019-2035 (USD BILLIONS)
TABLE 19. EUROPE MARKET SIZE ESTIMATES & FORECAST, BY ENGINE CAPACITY, 2019-2035 (USD BILLIONS)
TABLE 20. EUROPE MARKET SIZE ESTIMATES & FORECAST, BY PROPULSION TYPE, 2019-2035 (USD BILLIONS)
TABLE 21. EUROPE MARKET SIZE ESTIMATES & FORECAST, BY REGIONAL, 2019-2035 (USD BILLIONS)
TABLE 22. GERMANY MARKET SIZE ESTIMATES & FORECAST, BY TYPE, 2019-2035 (USD BILLIONS)
TABLE 23. GERMANY MARKET SIZE ESTIMATES & FORECAST, BY FUEL TYPE, 2019-2035 (USD BILLIONS)
TABLE 24. GERMANY MARKET SIZE ESTIMATES & FORECAST, BY ENGINE CAPACITY, 2019-2035 (USD BILLIONS)
TABLE 25. GERMANY MARKET SIZE ESTIMATES & FORECAST, BY PROPULSION TYPE, 2019-2035 (USD BILLIONS)
TABLE 26. GERMANY MARKET SIZE ESTIMATES & FORECAST, BY REGIONAL, 2019-2035 (USD BILLIONS)
TABLE 27. UK MARKET SIZE ESTIMATES & FORECAST, BY TYPE, 2019-2035 (USD BILLIONS)
TABLE 28. UK MARKET SIZE ESTIMATES & FORECAST, BY FUEL TYPE, 2019-2035 (USD BILLIONS)
TABLE 29. UK MARKET SIZE ESTIMATES & FORECAST, BY ENGINE CAPACITY, 2019-2035 (USD BILLIONS)
TABLE 30. UK MARKET SIZE ESTIMATES & FORECAST, BY PROPULSION TYPE, 2019-2035 (USD BILLIONS)
TABLE 31. UK MARKET SIZE ESTIMATES & FORECAST, BY REGIONAL, 2019-2035 (USD BILLIONS)
TABLE 32. FRANCE MARKET SIZE ESTIMATES & FORECAST, BY TYPE, 2019-2035 (USD BILLIONS)
TABLE 33. FRANCE MARKET SIZE ESTIMATES & FORECAST, BY FUEL TYPE, 2019-2035 (USD BILLIONS)
TABLE 34. FRANCE MARKET SIZE ESTIMATES & FORECAST, BY ENGINE CAPACITY, 2019-2035 (USD BILLIONS)
TABLE 35. FRANCE MARKET SIZE ESTIMATES & FORECAST, BY PROPULSION TYPE, 2019-2035 (USD BILLIONS)
TABLE 36. FRANCE MARKET SIZE ESTIMATES & FORECAST, BY REGIONAL, 2019-2035 (USD BILLIONS)
TABLE 37. RUSSIA MARKET SIZE ESTIMATES & FORECAST, BY TYPE, 2019-2035 (USD BILLIONS)
TABLE 38. RUSSIA MARKET SIZE ESTIMATES & FORECAST, BY FUEL TYPE, 2019-2035 (USD BILLIONS)
TABLE 39. RUSSIA MARKET SIZE ESTIMATES & FORECAST, BY ENGINE CAPACITY, 2019-2035 (USD BILLIONS)
TABLE 40. RUSSIA MARKET SIZE ESTIMATES & FORECAST, BY PROPULSION TYPE, 2019-2035 (USD BILLIONS)
TABLE 41. RUSSIA MARKET SIZE ESTIMATES & FORECAST, BY REGIONAL, 2019-2035 (USD BILLIONS)
TABLE 42. ITALY MARKET SIZE ESTIMATES & FORECAST, BY TYPE, 2019-2035 (USD BILLIONS)
TABLE 43. ITALY MARKET SIZE ESTIMATES & FORECAST, BY FUEL TYPE, 2019-2035 (USD BILLIONS)
TABLE 44. ITALY MARKET SIZE ESTIMATES & FORECAST, BY ENGINE CAPACITY, 2019-2035 (USD BILLIONS)
TABLE 45. ITALY MARKET SIZE ESTIMATES & FORECAST, BY PROPULSION TYPE, 2019-2035 (USD BILLIONS)
TABLE 46. ITALY MARKET SIZE ESTIMATES & FORECAST, BY REGIONAL, 2019-2035 (USD BILLIONS)
TABLE 47. SPAIN MARKET SIZE ESTIMATES & FORECAST, BY TYPE, 2019-2035 (USD BILLIONS)
TABLE 48. SPAIN MARKET SIZE ESTIMATES & FORECAST, BY FUEL TYPE, 2019-2035 (USD BILLIONS)
TABLE 49. SPAIN MARKET SIZE ESTIMATES & FORECAST, BY ENGINE CAPACITY, 2019-2035 (USD BILLIONS)
TABLE 50. SPAIN MARKET SIZE ESTIMATES & FORECAST, BY PROPULSION TYPE, 2019-2035 (USD BILLIONS)
TABLE 51. SPAIN MARKET SIZE ESTIMATES & FORECAST, BY REGIONAL, 2019-2035 (USD BILLIONS)
TABLE 52. REST OF EUROPE MARKET SIZE ESTIMATES & FORECAST, BY TYPE, 2019-2035 (USD BILLIONS)
TABLE 53. REST OF EUROPE MARKET SIZE ESTIMATES & FORECAST, BY FUEL TYPE, 2019-2035 (USD BILLIONS)
TABLE 54. REST OF EUROPE MARKET SIZE ESTIMATES & FORECAST, BY ENGINE CAPACITY, 2019-2035 (USD BILLIONS)
TABLE 55. REST OF EUROPE MARKET SIZE ESTIMATES & FORECAST, BY PROPULSION TYPE, 2019-2035 (USD BILLIONS)
TABLE 56. REST OF EUROPE MARKET SIZE ESTIMATES & FORECAST, BY REGIONAL, 2019-2035 (USD BILLIONS)
TABLE 57. APAC MARKET SIZE ESTIMATES & FORECAST, BY TYPE, 2019-2035 (USD BILLIONS)
TABLE 58. APAC MARKET SIZE ESTIMATES & FORECAST, BY FUEL TYPE, 2019-2035 (USD BILLIONS)
TABLE 59. APAC MARKET SIZE ESTIMATES & FORECAST, BY ENGINE CAPACITY, 2019-2035 (USD BILLIONS)
TABLE 60. APAC MARKET SIZE ESTIMATES & FORECAST, BY PROPULSION TYPE, 2019-2035 (USD BILLIONS)
TABLE 61. APAC MARKET SIZE ESTIMATES & FORECAST, BY REGIONAL, 2019-2035 (USD BILLIONS)
TABLE 62. CHINA MARKET SIZE ESTIMATES & FORECAST, BY TYPE, 2019-2035 (USD BILLIONS)
TABLE 63. CHINA MARKET SIZE ESTIMATES & FORECAST, BY FUEL TYPE, 2019-2035 (USD BILLIONS)
TABLE 64. CHINA MARKET SIZE ESTIMATES & FORECAST, BY ENGINE CAPACITY, 2019-2035 (USD BILLIONS)
TABLE 65. CHINA MARKET SIZE ESTIMATES & FORECAST, BY PROPULSION TYPE, 2019-2035 (USD BILLIONS)
TABLE 66. CHINA MARKET SIZE ESTIMATES & FORECAST, BY REGIONAL, 2019-2035 (USD BILLIONS)
TABLE 67. INDIA MARKET SIZE ESTIMATES & FORECAST, BY TYPE, 2019-2035 (USD BILLIONS)
TABLE 68. INDIA MARKET SIZE ESTIMATES & FORECAST, BY FUEL TYPE, 2019-2035 (USD BILLIONS)
TABLE 69. INDIA MARKET SIZE ESTIMATES & FORECAST, BY ENGINE CAPACITY, 2019-2035 (USD BILLIONS)
TABLE 70. INDIA MARKET SIZE ESTIMATES & FORECAST, BY PROPULSION TYPE, 2019-2035 (USD BILLIONS)
TABLE 71. INDIA MARKET SIZE ESTIMATES & FORECAST, BY REGIONAL, 2019-2035 (USD BILLIONS)
TABLE 72. JAPAN MARKET SIZE ESTIMATES & FORECAST, BY TYPE, 2019-2035 (USD BILLIONS)
TABLE 73. JAPAN MARKET SIZE ESTIMATES & FORECAST, BY FUEL TYPE, 2019-2035 (USD BILLIONS)
TABLE 74. JAPAN MARKET SIZE ESTIMATES & FORECAST, BY ENGINE CAPACITY, 2019-2035 (USD BILLIONS)
TABLE 75. JAPAN MARKET SIZE ESTIMATES & FORECAST, BY PROPULSION TYPE, 2019-2035 (USD BILLIONS)
TABLE 76. JAPAN MARKET SIZE ESTIMATES & FORECAST, BY REGIONAL, 2019-2035 (USD BILLIONS)
TABLE 77. SOUTH KOREA MARKET SIZE ESTIMATES & FORECAST, BY TYPE, 2019-2035 (USD BILLIONS)
TABLE 78. SOUTH KOREA MARKET SIZE ESTIMATES & FORECAST, BY FUEL TYPE, 2019-2035 (USD BILLIONS)
TABLE 79. SOUTH KOREA MARKET SIZE ESTIMATES & FORECAST, BY ENGINE CAPACITY, 2019-2035 (USD BILLIONS)
TABLE 80. SOUTH KOREA MARKET SIZE ESTIMATES & FORECAST, BY PROPULSION TYPE, 2019-2035 (USD BILLIONS)
TABLE 81. SOUTH KOREA MARKET SIZE ESTIMATES & FORECAST, BY REGIONAL, 2019-2035 (USD BILLIONS)
TABLE 82. MALAYSIA MARKET SIZE ESTIMATES & FORECAST, BY TYPE, 2019-2035 (USD BILLIONS)
TABLE 83. MALAYSIA MARKET SIZE ESTIMATES & FORECAST, BY FUEL TYPE, 2019-2035 (USD BILLIONS)
TABLE 84. MALAYSIA MARKET SIZE ESTIMATES & FORECAST, BY ENGINE CAPACITY, 2019-2035 (USD BILLIONS)
TABLE 85. MALAYSIA MARKET SIZE ESTIMATES & FORECAST, BY PROPULSION TYPE, 2019-2035 (USD BILLIONS)
TABLE 86. MALAYSIA MARKET SIZE ESTIMATES & FORECAST, BY REGIONAL, 2019-2035 (USD BILLIONS)
TABLE 87. THAILAND MARKET SIZE ESTIMATES & FORECAST, BY TYPE, 2019-2035 (USD BILLIONS)
TABLE 88. THAILAND MARKET SIZE ESTIMATES & FORECAST, BY FUEL TYPE, 2019-2035 (USD BILLIONS)
TABLE 89. THAILAND MARKET SIZE ESTIMATES & FORECAST, BY ENGINE CAPACITY, 2019-2035 (USD BILLIONS)
TABLE 90. THAILAND MARKET SIZE ESTIMATES & FORECAST, BY PROPULSION TYPE, 2019-2035 (USD BILLIONS)
TABLE 91. THAILAND MARKET SIZE ESTIMATES & FORECAST, BY REGIONAL, 2019-2035 (USD BILLIONS)
TABLE 92. INDONESIA MARKET SIZE ESTIMATES & FORECAST, BY TYPE, 2019-2035 (USD BILLIONS)
TABLE 93. INDONESIA MARKET SIZE ESTIMATES & FORECAST, BY FUEL TYPE, 2019-2035 (USD BILLIONS)
TABLE 94. INDONESIA MARKET SIZE ESTIMATES & FORECAST, BY ENGINE CAPACITY, 2019-2035 (USD BILLIONS)
TABLE 95. INDONESIA MARKET SIZE ESTIMATES & FORECAST, BY PROPULSION TYPE, 2019-2035 (USD BILLIONS)
TABLE 96. INDONESIA MARKET SIZE ESTIMATES & FORECAST, BY REGIONAL, 2019-2035 (USD BILLIONS)
TABLE 97. REST OF APAC MARKET SIZE ESTIMATES & FORECAST, BY TYPE, 2019-2035 (USD BILLIONS)
TABLE 98. REST OF APAC MARKET SIZE ESTIMATES & FORECAST, BY FUEL TYPE, 2019-2035 (USD BILLIONS)
TABLE 99. REST OF APAC MARKET SIZE ESTIMATES & FORECAST, BY ENGINE CAPACITY, 2019-2035 (USD BILLIONS)
TABLE 100. REST OF APAC MARKET SIZE ESTIMATES & FORECAST, BY PROPULSION TYPE, 2019-2035 (USD BILLIONS)
TABLE 101. REST OF APAC MARKET SIZE ESTIMATES & FORECAST, BY REGIONAL, 2019-2035 (USD BILLIONS)
TABLE 102. SOUTH AMERICA MARKET SIZE ESTIMATES & FORECAST, BY TYPE, 2019-2035 (USD BILLIONS)
TABLE 103. SOUTH AMERICA MARKET SIZE ESTIMATES & FORECAST, BY FUEL TYPE, 2019-2035 (USD BILLIONS)
TABLE 104. SOUTH AMERICA MARKET SIZE ESTIMATES & FORECAST, BY ENGINE CAPACITY, 2019-2035 (USD BILLIONS)
TABLE 105. SOUTH AMERICA MARKET SIZE ESTIMATES & FORECAST, BY PROPULSION TYPE, 2019-2035 (USD BILLIONS)
TABLE 106. SOUTH AMERICA MARKET SIZE ESTIMATES & FORECAST, BY REGIONAL, 2019-2035 (USD BILLIONS)
TABLE 107. BRAZIL MARKET SIZE ESTIMATES & FORECAST, BY TYPE, 2019-2035 (USD BILLIONS)
TABLE 108. BRAZIL MARKET SIZE ESTIMATES & FORECAST, BY FUEL TYPE, 2019-2035 (USD BILLIONS)
TABLE 109. BRAZIL MARKET SIZE ESTIMATES & FORECAST, BY ENGINE CAPACITY, 2019-2035 (USD BILLIONS)
TABLE 110. BRAZIL MARKET SIZE ESTIMATES & FORECAST, BY PROPULSION TYPE, 2019-2035 (USD BILLIONS)
TABLE 111. BRAZIL MARKET SIZE ESTIMATES & FORECAST, BY REGIONAL, 2019-2035 (USD BILLIONS)
TABLE 112. MEXICO MARKET SIZE ESTIMATES & FORECAST, BY TYPE, 2019-2035 (USD BILLIONS)
TABLE 113. MEXICO MARKET SIZE ESTIMATES & FORECAST, BY FUEL TYPE, 2019-2035 (USD BILLIONS)
TABLE 114. MEXICO MARKET SIZE ESTIMATES & FORECAST, BY ENGINE CAPACITY, 2019-2035 (USD BILLIONS)
TABLE 115. MEXICO MARKET SIZE ESTIMATES & FORECAST, BY PROPULSION TYPE, 2019-2035 (USD BILLIONS)
TABLE 116. MEXICO MARKET SIZE ESTIMATES & FORECAST, BY REGIONAL, 2019-2035 (USD BILLIONS)
TABLE 117. ARGENTINA MARKET SIZE ESTIMATES & FORECAST, BY TYPE, 2019-2035 (USD BILLIONS)
TABLE 118. ARGENTINA MARKET SIZE ESTIMATES & FORECAST, BY FUEL TYPE, 2019-2035 (USD BILLIONS)
TABLE 119. ARGENTINA MARKET SIZE ESTIMATES & FORECAST, BY ENGINE CAPACITY, 2019-2035 (USD BILLIONS)
TABLE 120. ARGENTINA MARKET SIZE ESTIMATES & FORECAST, BY PROPULSION TYPE, 2019-2035 (USD BILLIONS)
TABLE 121. ARGENTINA MARKET SIZE ESTIMATES & FORECAST, BY REGIONAL, 2019-2035 (USD BILLIONS)
TABLE 122. REST OF SOUTH AMERICA MARKET SIZE ESTIMATES & FORECAST, BY TYPE, 2019-2035 (USD BILLIONS)
TABLE 123. REST OF SOUTH AMERICA MARKET SIZE ESTIMATES & FORECAST, BY FUEL TYPE, 2019-2035 (USD BILLIONS)
TABLE 124. REST OF SOUTH AMERICA MARKET SIZE ESTIMATES & FORECAST, BY ENGINE CAPACITY, 2019-2035 (USD BILLIONS)
TABLE 125. REST OF SOUTH AMERICA MARKET SIZE ESTIMATES & FORECAST, BY PROPULSION TYPE, 2019-2035 (USD BILLIONS)
TABLE 126. REST OF SOUTH AMERICA MARKET SIZE ESTIMATES & FORECAST, BY REGIONAL, 2019-2035 (USD BILLIONS)
TABLE 127. MEA MARKET SIZE ESTIMATES & FORECAST, BY TYPE, 2019-2035 (USD BILLIONS)
TABLE 128. MEA MARKET SIZE ESTIMATES & FORECAST, BY FUEL TYPE, 2019-2035 (USD BILLIONS)
TABLE 129. MEA MARKET SIZE ESTIMATES & FORECAST, BY ENGINE CAPACITY, 2019-2035 (USD BILLIONS)
TABLE 130. MEA MARKET SIZE ESTIMATES & FORECAST, BY PROPULSION TYPE, 2019-2035 (USD BILLIONS)
TABLE 131. MEA MARKET SIZE ESTIMATES & FORECAST, BY REGIONAL, 2019-2035 (USD BILLIONS)
TABLE 132. GCC COUNTRIES MARKET SIZE ESTIMATES & FORECAST, BY TYPE, 2019-2035 (USD BILLIONS)
TABLE 133. GCC COUNTRIES MARKET SIZE ESTIMATES & FORECAST, BY FUEL TYPE, 2019-2035 (USD BILLIONS)
TABLE 134. GCC COUNTRIES MARKET SIZE ESTIMATES & FORECAST, BY ENGINE CAPACITY, 2019-2035 (USD BILLIONS)
TABLE 135. GCC COUNTRIES MARKET SIZE ESTIMATES & FORECAST, BY PROPULSION TYPE, 2019-2035 (USD BILLIONS)
TABLE 136. GCC COUNTRIES MARKET SIZE ESTIMATES & FORECAST, BY REGIONAL, 2019-2035 (USD BILLIONS)
TABLE 137. SOUTH AFRICA MARKET SIZE ESTIMATES & FORECAST, BY TYPE, 2019-2035 (USD BILLIONS)
TABLE 138. SOUTH AFRICA MARKET SIZE ESTIMATES & FORECAST, BY FUEL TYPE, 2019-2035 (USD BILLIONS)
TABLE 139. SOUTH AFRICA MARKET SIZE ESTIMATES & FORECAST, BY ENGINE CAPACITY, 2019-2035 (USD BILLIONS)
TABLE 140. SOUTH AFRICA MARKET SIZE ESTIMATES & FORECAST, BY PROPULSION TYPE, 2019-2035 (USD BILLIONS)
TABLE 141. SOUTH AFRICA MARKET SIZE ESTIMATES & FORECAST, BY REGIONAL, 2019-2035 (USD BILLIONS)
TABLE 142. REST OF MEA MARKET SIZE ESTIMATES & FORECAST, BY TYPE, 2019-2035 (USD BILLIONS)
TABLE 143. REST OF MEA MARKET SIZE ESTIMATES & FORECAST, BY FUEL TYPE, 2019-2035 (USD BILLIONS)
TABLE 144. REST OF MEA MARKET SIZE ESTIMATES & FORECAST, BY ENGINE CAPACITY, 2019-2035 (USD BILLIONS)
TABLE 145. REST OF MEA MARKET SIZE ESTIMATES & FORECAST, BY PROPULSION TYPE, 2019-2035 (USD BILLIONS)
TABLE 146. REST OF MEA MARKET SIZE ESTIMATES & FORECAST, BY REGIONAL, 2019-2035 (USD BILLIONS)
TABLE 147. PRODUCT LAUNCH/PRODUCT DEVELOPMENT/APPROVAL
TABLE 148. ACQUISITION/PARTNERSHIP
LIST OF FIGURES
FIGURE 1. MARKET SYNOPSIS
FIGURE 2. NORTH AMERICA MARKET ANALYSIS
FIGURE 3. US MARKET ANALYSIS BY TYPE
FIGURE 4. US MARKET ANALYSIS BY FUEL TYPE
FIGURE 5. US MARKET ANALYSIS BY ENGINE CAPACITY
FIGURE 6. US MARKET ANALYSIS BY PROPULSION TYPE
FIGURE 7. US MARKET ANALYSIS BY REGIONAL
FIGURE 8. CANADA MARKET ANALYSIS BY TYPE
FIGURE 9. CANADA MARKET ANALYSIS BY FUEL TYPE
FIGURE 10. CANADA MARKET ANALYSIS BY ENGINE CAPACITY
FIGURE 11. CANADA MARKET ANALYSIS BY PROPULSION TYPE
FIGURE 12. CANADA MARKET ANALYSIS BY REGIONAL
FIGURE 13. EUROPE MARKET ANALYSIS
FIGURE 14. GERMANY MARKET ANALYSIS BY TYPE
FIGURE 15. GERMANY MARKET ANALYSIS BY FUEL TYPE
FIGURE 16. GERMANY MARKET ANALYSIS BY ENGINE CAPACITY
FIGURE 17. GERMANY MARKET ANALYSIS BY PROPULSION TYPE
FIGURE 18. GERMANY MARKET ANALYSIS BY REGIONAL
FIGURE 19. UK MARKET ANALYSIS BY TYPE
FIGURE 20. UK MARKET ANALYSIS BY FUEL TYPE
FIGURE 21. UK MARKET ANALYSIS BY ENGINE CAPACITY
FIGURE 22. UK MARKET ANALYSIS BY PROPULSION TYPE
FIGURE 23. UK MARKET ANALYSIS BY REGIONAL
FIGURE 24. FRANCE MARKET ANALYSIS BY TYPE
FIGURE 25. FRANCE MARKET ANALYSIS BY FUEL TYPE
FIGURE 26. FRANCE MARKET ANALYSIS BY ENGINE CAPACITY
FIGURE 27. FRANCE MARKET ANALYSIS BY PROPULSION TYPE
FIGURE 28. FRANCE MARKET ANALYSIS BY REGIONAL
FIGURE 29. RUSSIA MARKET ANALYSIS BY TYPE
FIGURE 30. RUSSIA MARKET ANALYSIS BY FUEL TYPE
FIGURE 31. RUSSIA MARKET ANALYSIS BY ENGINE CAPACITY
FIGURE 32. RUSSIA MARKET ANALYSIS BY PROPULSION TYPE
FIGURE 33. RUSSIA MARKET ANALYSIS BY REGIONAL
FIGURE 34. ITALY MARKET ANALYSIS BY TYPE
FIGURE 35. ITALY MARKET ANALYSIS BY FUEL TYPE
FIGURE 36. ITALY MARKET ANALYSIS BY ENGINE CAPACITY
FIGURE 37. ITALY MARKET ANALYSIS BY PROPULSION TYPE
FIGURE 38. ITALY MARKET ANALYSIS BY REGIONAL
FIGURE 39. SPAIN MARKET ANALYSIS BY TYPE
FIGURE 40. SPAIN MARKET ANALYSIS BY FUEL TYPE
FIGURE 41. SPAIN MARKET ANALYSIS BY ENGINE CAPACITY
FIGURE 42. SPAIN MARKET ANALYSIS BY PROPULSION TYPE
FIGURE 43. SPAIN MARKET ANALYSIS BY REGIONAL
FIGURE 44. REST OF EUROPE MARKET ANALYSIS BY TYPE
FIGURE 45. REST OF EUROPE MARKET ANALYSIS BY FUEL TYPE
FIGURE 46. REST OF EUROPE MARKET ANALYSIS BY ENGINE CAPACITY
FIGURE 47. REST OF EUROPE MARKET ANALYSIS BY PROPULSION TYPE
FIGURE 48. REST OF EUROPE MARKET ANALYSIS BY REGIONAL
FIGURE 49. APAC MARKET ANALYSIS
FIGURE 50. CHINA MARKET ANALYSIS BY TYPE
FIGURE 51. CHINA MARKET ANALYSIS BY FUEL TYPE
FIGURE 52. CHINA MARKET ANALYSIS BY ENGINE CAPACITY
FIGURE 53. CHINA MARKET ANALYSIS BY PROPULSION TYPE
FIGURE 54. CHINA MARKET ANALYSIS BY REGIONAL
FIGURE 55. INDIA MARKET ANALYSIS BY TYPE
FIGURE 56. INDIA MARKET ANALYSIS BY FUEL TYPE
FIGURE 57. INDIA MARKET ANALYSIS BY ENGINE CAPACITY
FIGURE 58. INDIA MARKET ANALYSIS BY PROPULSION TYPE
FIGURE 59. INDIA MARKET ANALYSIS BY REGIONAL
FIGURE 60. JAPAN MARKET ANALYSIS BY TYPE
FIGURE 61. JAPAN MARKET ANALYSIS BY FUEL TYPE
FIGURE 62. JAPAN MARKET ANALYSIS BY ENGINE CAPACITY
FIGURE 63. JAPAN MARKET ANALYSIS BY PROPULSION TYPE
FIGURE 64. JAPAN MARKET ANALYSIS BY REGIONAL
FIGURE 65. SOUTH KOREA MARKET ANALYSIS BY TYPE
FIGURE 66. SOUTH KOREA MARKET ANALYSIS BY FUEL TYPE
FIGURE 67. SOUTH KOREA MARKET ANALYSIS BY ENGINE CAPACITY
FIGURE 68. SOUTH KOREA MARKET ANALYSIS BY PROPULSION TYPE
FIGURE 69. SOUTH KOREA MARKET ANALYSIS BY REGIONAL
FIGURE 70. MALAYSIA MARKET ANALYSIS BY TYPE
FIGURE 71. MALAYSIA MARKET ANALYSIS BY FUEL TYPE
FIGURE 72. MALAYSIA MARKET ANALYSIS BY ENGINE CAPACITY
FIGURE 73. MALAYSIA MARKET ANALYSIS BY PROPULSION TYPE
FIGURE 74. MALAYSIA MARKET ANALYSIS BY REGIONAL
FIGURE 75. THAILAND MARKET ANALYSIS BY TYPE
FIGURE 76. THAILAND MARKET ANALYSIS BY FUEL TYPE
FIGURE 77. THAILAND MARKET ANALYSIS BY ENGINE CAPACITY
FIGURE 78. THAILAND MARKET ANALYSIS BY PROPULSION TYPE
FIGURE 79. THAILAND MARKET ANALYSIS BY REGIONAL
FIGURE 80. INDONESIA MARKET ANALYSIS BY TYPE
FIGURE 81. INDONESIA MARKET ANALYSIS BY FUEL TYPE
FIGURE 82. INDONESIA MARKET ANALYSIS BY ENGINE CAPACITY
FIGURE 83. INDONESIA MARKET ANALYSIS BY PROPULSION TYPE
FIGURE 84. INDONESIA MARKET ANALYSIS BY REGIONAL
FIGURE 85. REST OF APAC MARKET ANALYSIS BY TYPE
FIGURE 86. REST OF APAC MARKET ANALYSIS BY FUEL TYPE
FIGURE 87. REST OF APAC MARKET ANALYSIS BY ENGINE CAPACITY
FIGURE 88. REST OF APAC MARKET ANALYSIS BY PROPULSION TYPE
FIGURE 89. REST OF APAC MARKET ANALYSIS BY REGIONAL
FIGURE 90. SOUTH AMERICA MARKET ANALYSIS
FIGURE 91. BRAZIL MARKET ANALYSIS BY TYPE
FIGURE 92. BRAZIL MARKET ANALYSIS BY FUEL TYPE
FIGURE 93. BRAZIL MARKET ANALYSIS BY ENGINE CAPACITY
FIGURE 94. BRAZIL MARKET ANALYSIS BY PROPULSION TYPE
FIGURE 95. BRAZIL MARKET ANALYSIS BY REGIONAL
FIGURE 96. MEXICO MARKET ANALYSIS BY TYPE
FIGURE 97. MEXICO MARKET ANALYSIS BY FUEL TYPE
FIGURE 98. MEXICO MARKET ANALYSIS BY ENGINE CAPACITY
FIGURE 99. MEXICO MARKET ANALYSIS BY PROPULSION TYPE
FIGURE 100. MEXICO MARKET ANALYSIS BY REGIONAL
FIGURE 101. ARGENTINA MARKET ANALYSIS BY TYPE
FIGURE 102. ARGENTINA MARKET ANALYSIS BY FUEL TYPE
FIGURE 103. ARGENTINA MARKET ANALYSIS BY ENGINE CAPACITY
FIGURE 104. ARGENTINA MARKET ANALYSIS BY PROPULSION TYPE
FIGURE 105. ARGENTINA MARKET ANALYSIS BY REGIONAL
FIGURE 106. REST OF SOUTH AMERICA MARKET ANALYSIS BY TYPE
FIGURE 107. REST OF SOUTH AMERICA MARKET ANALYSIS BY FUEL TYPE
FIGURE 108. REST OF SOUTH AMERICA MARKET ANALYSIS BY ENGINE CAPACITY
FIGURE 109. REST OF SOUTH AMERICA MARKET ANALYSIS BY PROPULSION TYPE
FIGURE 110. REST OF SOUTH AMERICA MARKET ANALYSIS BY REGIONAL
FIGURE 111. MEA MARKET ANALYSIS
FIGURE 112. GCC COUNTRIES MARKET ANALYSIS BY TYPE
FIGURE 113. GCC COUNTRIES MARKET ANALYSIS BY FUEL TYPE
FIGURE 114. GCC COUNTRIES MARKET ANALYSIS BY ENGINE CAPACITY
FIGURE 115. GCC COUNTRIES MARKET ANALYSIS BY PROPULSION TYPE
FIGURE 116. GCC COUNTRIES MARKET ANALYSIS BY REGIONAL
FIGURE 117. SOUTH AFRICA MARKET ANALYSIS BY TYPE
FIGURE 118. SOUTH AFRICA MARKET ANALYSIS BY FUEL TYPE
FIGURE 119. SOUTH AFRICA MARKET ANALYSIS BY ENGINE CAPACITY
FIGURE 120. SOUTH AFRICA MARKET ANALYSIS BY PROPULSION TYPE
FIGURE 121. SOUTH AFRICA MARKET ANALYSIS BY REGIONAL
FIGURE 122. REST OF MEA MARKET ANALYSIS BY TYPE
FIGURE 123. REST OF MEA MARKET ANALYSIS BY FUEL TYPE
FIGURE 124. REST OF MEA MARKET ANALYSIS BY ENGINE CAPACITY
FIGURE 125. REST OF MEA MARKET ANALYSIS BY PROPULSION TYPE
FIGURE 126. REST OF MEA MARKET ANALYSIS BY REGIONAL
FIGURE 127. KEY BUYING CRITERIA OF MOTOR VEHICLE MARKET
FIGURE 128. RESEARCH PROCESS OF MRFR
FIGURE 129. DRO ANALYSIS OF MOTOR VEHICLE MARKET
FIGURE 130. DRIVERS IMPACT ANALYSIS: MOTOR VEHICLE MARKET
FIGURE 131. RESTRAINTS IMPACT ANALYSIS: MOTOR VEHICLE MARKET
FIGURE 132. SUPPLY / VALUE CHAIN: MOTOR VEHICLE MARKET
FIGURE 133. MARKET, BY TYPE, 2025 (% SHARE)
FIGURE 134. MARKET, BY TYPE, 2019 TO 2035 (USD Billions)
FIGURE 135. MARKET, BY FUEL TYPE, 2025 (% SHARE)
FIGURE 136. MARKET, BY FUEL TYPE, 2019 TO 2035 (USD Billions)
FIGURE 137. MARKET, BY ENGINE CAPACITY, 2025 (% SHARE)
FIGURE 138. MARKET, BY ENGINE CAPACITY, 2019 TO 2035 (USD Billions)
FIGURE 139. MARKET, BY PROPULSION TYPE, 2025 (% SHARE)
FIGURE 140. MARKET, BY PROPULSION TYPE, 2019 TO 2035 (USD Billions)
FIGURE 141. MARKET, BY REGIONAL, 2025 (% SHARE)
FIGURE 142. MARKET, BY REGIONAL, 2019 TO 2035 (USD Billions)
FIGURE 143. BENCHMARKING OF MAJOR COMPETITORS