• Cat-intel
  • MedIntelliX
  • Resources
  • About Us
  • English
    Chinese
    French
    Japanese
    Korean
    German
    Spanish

    Molecular Breeding Market Share

    ID: MRFR/HC/10270-CR
    177 Pages
    Rahul Gotadki
    July 2024

    Molecular Breeding Market Research Report Information by Process (Marker-assisted selection, Marker-assisted backcrossing, QTL mapping), By Maker (SNP, SSR), By Application (Plant, Livestock), and Region (North America, Europe, Asia-Pacific, and South America, Middle East and Africa)—Forecast till 2035

    Share:
    Download PDF ×

    We do not share your information with anyone. However, we may send you emails based on your report interest from time to time. You may contact us at any time to opt-out.

    Molecular Breeding Market Infographic
    $ 4,950.0
    $ 5,950.0
    $ 7,250.0

    Market Share

    Molecular Breeding Market Share Analysis

    molecular breeding market share companies are employing various strategies to establish their positions and gain a competitive edge in addressing the needs of farmers, agricultural researchers, and the biotechnology industry. Molecular breeding, which integrates advanced genomic technologies with traditional breeding methods to develop improved crop varieties, requires strategic positioning to effectively capture market share and cater to the evolving demands of stakeholders. One of the primary strategies utilized in the molecular breeding market is product differentiation. Companies invest heavily in research and development to create innovative molecular breeding solutions that offer unique benefits to agricultural stakeholders. These solutions may include advanced genotyping and phenotyping technologies, bioinformatics tools for data analysis, and predictive modeling algorithms for trait selection. By differentiating their products based on these desirable features, companies can attract customers seeking solutions to accelerate crop improvement, enhance genetic diversity, and increase yield potential. Pricing strategy is also crucial in market share positioning within the molecular breeding market. While the development and commercialization of molecular breeding technologies involve significant investment costs, companies must balance pricing to remain competitive. Some companies choose to compete based on price by offering cost-effective molecular breeding services and solutions that provide value for agricultural researchers and breeders. This approach aims to appeal to budget-conscious customers while ensuring profitability and sustainability for molecular breeding providers. Furthermore, companies often target niche markets or specific customer segments to tailor their molecular breeding strategies. For example, companies may focus on developing molecular breeding solutions tailored to specific crops, such as maize, wheat, rice, or soybeans. Additionally, companies may specialize in addressing particular challenges or needs prevalent in certain regions or cropping systems, such as drought tolerance, disease resistance, or nutritional quality improvement. By understanding the unique requirements and preferences of different customer segments, companies can customize their molecular breeding offerings to provide targeted solutions effectively. This targeted approach allows companies to position themselves as leaders in specific crop segments and build strong relationships with customers seeking tailored breeding solutions. Branding and marketing efforts are also instrumental in market share positioning within the molecular breeding market. Building a strong brand identity helps companies establish credibility, trust, and recognition among agricultural researchers, breeders, and industry stakeholders. Through effective branding, companies can communicate the benefits and value proposition of their molecular breeding services and technologies, distinguishing themselves from competitors. Additionally, targeted marketing campaigns highlighting the efficiency, precision, and impact of molecular breeding on crop improvement can influence purchasing decisions and drive demand in the market. Moreover, strategic partnerships and collaborations play a crucial role in expanding market share and enhancing competitive positioning in the molecular breeding market. Collaborating with agricultural research institutions, seed companies, biotechnology firms, and breeding associations allows companies to leverage their combined expertise, resources, and networks to penetrate new markets and reach a broader customer base. Partnerships may involve joint research and development projects, licensing agreements, or commercialization partnerships to accelerate the adoption and application of molecular breeding technologies. By forging strategic alliances, companies can capitalize on synergies, expand their market reach, and strengthen their competitive position in the molecular breeding market.

    Market Summary

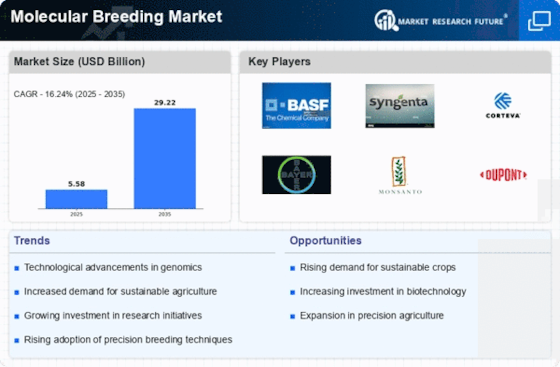
    As per Market Research Future Analysis, the Global Molecular Breeding Market was valued at USD 5.58 billion in 2024 and is projected to grow to USD 29.22 billion by 2035, with a CAGR of 16.24% from 2025 to 2035. The market growth is driven by the increasing development of high-yielding and stress-resistant varieties, rising awareness of molecular breeding, and growing consumer demand for nutritionally enhanced foods. North America held the largest market share in 2023, supported by advances in genomic technologies and substantial investments in agricultural R&D.

    Key Market Trends & Highlights

    Key trends driving the Molecular Breeding Market include advancements in breeding techniques and rising consumer demand for sustainable food.

    • Market Size in 2024: USD 5.58 billion; projected to reach USD 29.22 billion by 2035.
    • CAGR during 2024-2032: 16.24%; driven by high-yielding and stress-resistant crop development.
    • North America accounted for the largest market share in 2023, benefiting from strong R&D investments.
    • SNP segment dominated the market in 2023; SSR projected as the fastest-growing segment from 2024-2032.

    Market Size & Forecast

    2024 Market Size USD 5.58 billion
    2035 Market Size USD 29.22 billion
    CAGR (2024-2035) 16.24%
    Largest Regional Market Share in 2023 North America.

    Major Players

    Key players include Charles River Laboratories (US), Eurofins Scientific (Europe), DanBred P/S (Denmark), Intertek Group Plc (UK), and Slipstream Automation (New Zealand).

    Market Trends

    Increasing development of High-Yielding and Stress-Resistant Varieties of molecular breeding is to boost the market growth

    The increasing development of high-yielding and stress-resistant varieties plays a crucial role in boosting the demand for the Molecular Breeding Market. As the global population continues to grow and environmental challenges such as climate change become more pronounced, there is a pressing need to develop crops and livestock breeds that can thrive under adverse conditions while maintaining high productivity. Researchers are developing crops with molecular breeding to meet the demand of people who are seeking a crop that can grow in dried areas.

    For instance, in September 2019, the International Crops Research Institute for the Semi-arid Tropics announced that the All India Coordinated Research Project (AICRP) for Chickpea identified two desi chickpea (Bengal chana) varieties, ‘Pusa 10216’ and ‘MABC-WR-SA-1’, which were developed by the ICAR-Indian Agricultural Research Institute (IARI) and the University of Agricultural Sciences (UAS) in Karnataka, India. This Pusa 10216 showed higher yields during testing in Indian drought conditions, and the chickpea project is the first AICRP among pulse crops to identify molecular breeding products for commercial release in India.

    As a result, the research and development of high-yielding crops is boosting the growth of the Molecular Breeding Market.

    The ongoing advancements in molecular breeding technologies are poised to enhance crop resilience and productivity, thereby addressing the growing global food security challenges.

    United States Department of Agriculture (USDA)

    Molecular Breeding Market Market Drivers

    Market Growth Projections

    The Global Molecular Breeding Market Industry is poised for substantial growth, with projections indicating a market value of 5.58 USD Billion in 2024 and an anticipated increase to 27.2 USD Billion by 2035. This growth trajectory reflects a compound annual growth rate of 15.49% from 2025 to 2035, driven by various factors including technological advancements, rising demand for high-yield crops, and increasing government support. The market's expansion is indicative of the growing recognition of molecular breeding as a critical tool in addressing global food security challenges and promoting sustainable agricultural practices.

    Government Support and Funding

    Government initiatives and funding play a pivotal role in the Global Molecular Breeding Market Industry. Many countries are investing in research and development to promote sustainable agricultural practices through molecular breeding. For instance, the U.S. Department of Agriculture has allocated substantial grants to support projects focused on developing climate-resilient crops. Such investments not only foster innovation but also encourage collaboration between public and private sectors. This growing support is likely to enhance the market's growth trajectory, as evidenced by the increasing number of research projects and partnerships aimed at advancing molecular breeding techniques.

    Rising Demand for High-Yield Crops

    The Global Molecular Breeding Market Industry is experiencing a surge in demand for high-yield crops, driven by the need to enhance food security amid a growing global population. As agricultural practices evolve, molecular breeding techniques enable the development of crop varieties that are not only more productive but also resilient to environmental stresses. For instance, the introduction of genetically modified crops has led to yield increases of up to 30 percent in certain regions. This trend is expected to contribute significantly to the market's growth, with projections indicating a market value of 5.58 USD Billion in 2024, expanding to 27.2 USD Billion by 2035.

    Global Population Growth and Urbanization

    The Global Molecular Breeding Market Industry is significantly influenced by global population growth and urbanization trends. As the world population is projected to reach approximately 9.7 billion by 2050, the demand for food is expected to increase dramatically. Urbanization further exacerbates this challenge, as more people move to cities, reducing the available land for agriculture. Molecular breeding provides a viable solution by enabling the development of crop varieties that can thrive in diverse environments and under varying conditions. This necessity for increased food production is likely to propel the market forward, with a projected market value of 5.58 USD Billion in 2024.

    Increasing Awareness of Sustainable Agriculture

    The Global Molecular Breeding Market Industry is witnessing a heightened awareness of sustainable agricultural practices among consumers and producers alike. As environmental concerns rise, there is a growing emphasis on developing crops that require fewer resources, such as water and fertilizers. Molecular breeding offers solutions that align with these sustainability goals by creating varieties that are more efficient in resource utilization. For example, drought-resistant crops developed through molecular techniques can significantly reduce water usage in agriculture. This shift towards sustainability is expected to drive market growth, as stakeholders seek to adopt practices that are both economically viable and environmentally friendly.

    Technological Advancements in Breeding Techniques

    Innovations in molecular breeding technologies are transforming the Global Molecular Breeding Market Industry. Techniques such as CRISPR and genomic selection are facilitating precise genetic modifications, allowing for the rapid development of improved crop varieties. These advancements not only enhance the efficiency of breeding programs but also reduce the time required to bring new varieties to market. For example, CRISPR technology has been utilized to develop disease-resistant varieties of wheat and rice, which are crucial for maintaining food supply chains. The anticipated compound annual growth rate of 15.49% from 2025 to 2035 underscores the potential of these technologies to reshape the industry.

    Market Segment Insights

    Molecular Breeding Process Insights

    The Molecular Breeding Market segmentation, based on Process, includes Segmental Marker-assisted selection, Marker-assisted backcrossing, and QTL mapping. The Segmental Marker-assisted selection segment is to hold the majority share in 2023 in the Molecular Breeding Market revenue. This is because of increasing demand for improved crop varieties amid food security and climate change concerns. Technological advancements in genomics and bioinformatics, along with cost-effective breeding methods, enhance efficiency and accuracy.

    Molecular Breeding Insights

    The Molecular Breeding Market segmentation is based on a Maker that includes SNP and SSR. The SNP segment has dominated the market in 2023 and SSR is projected to be the fastest-growing segment during the forecast period, 2024-2032. This is due to their high polymorphism, co-dominant inheritance, and widespread distribution, making them ideal for assessing genetic diversity and accurate genotyping.

    Figure 2: MOLECULAR BREEDING MARKET, BY APPLICATION, 2023 & 2032 (USD Billion)

    Source: Secondary Research, Primary Research, Market Research Future Database, and Analyst Review

    Get more detailed insights about Molecular Breeding Market Research Report—Global Forecast till 2032

    Regional Insights

    By Region, the study segments the market into North America, Europe, Asia-Pacific, and South America, and Middle East and Africa. The North American Molecular Breeding Market accounted for the largest market share in 2023. Advances in genomic technologies, such as next-generation sequencing and CRISPR-Cas9, have enhanced the precision and efficiency of molecular breeding. This region benefits from substantial investment in agricultural research and development by both public and private sectors. Government policies supporting agricultural innovation and food security further drive the market.

    North America's robust research infrastructure and presence of leading agricultural biotechnology companies facilitate the rapid adoption of molecular breeding techniques. Marker-assisted selection (MAS) is particularly popular, enabling precise identification and selection of desirable traits, reducing breeding time and costs.

    Further, the major countries studied are the U.S., Canada, Germany, France, the UK, Italy, Spain, China, Japan, India, Australia, South Korea, and Brazil.

    Figure 3: MOLECULAR BREEDING MARKET BY REGION 2023 & 2032

    MOLECULAR BREEDING MARKET BY REGION 2023 & 2032

    Source: Secondary Research, Primary Research, Market Research Future Database, and Analyst Review

    Europe Molecular Breeding Market is expected to account for the second-largest market share due to Europe's strong research infrastructure and collaboration among research institutions and biotech companies position it as a significant player in the molecular breeding market. Further, the German Molecular Breeding Market was attributed to holding the largest market share, and Spain Molecular Breeding Market is expected to fastest-growing market in the European region.

    The Asia-Pacific Molecular Breeding market is expected to grow at the fastest rate from 2024 to 2032. This is due to the rising consumer demand for high-quality, nutritious, and sustainable food that drives the adoption of molecular breeding. The need for climate-resilient crops amid changing environmental conditions also fuels market expansion.

    South America, the Middle East, and Africa possess rich biodiversity and agricultural potential, making them increasingly attractive for agricultural research and investment. Growing research capabilities and knowledge exchange initiatives further enhance their competitiveness in the Molecular Breeding Market is driving market expansion.

    Key Players and Competitive Insights

    The Molecular Breeding Market is characterized by the presence of many global and regional, players. The market comprises tier-1, tier-2, and local players. The tier-1 and tier-2 players have reached across the globe with diverse types of portfolios. Companies such as Charles River Laboratories (US), Eurofins Scientific (Europe), DanBred P/S (Denmark), Intertek Group Plc (UK), and Slipstream Automation (New Zealand) dominate the Molecular Breeding Market due to Type differentiation, financial stability, strategic services, and diversified regional presence. The players are focused on investing in extensive research and development as well.

    Furthermore, they adopt strategic growth initiatives, such as expansion, joint ventures, and partnerships, to strengthen their market position and capture a large customer base.

    One of the primary business strategies adopted by manufacturers in the global Molecular Breeding industry to benefit clients and expand the Molecular Breeding Market sector is to manufacture locally to reduce operating costs.

    Key Companies in the Molecular Breeding Market market include

    Industry Developments

    In March 2024, Charles River Laboratories (US) extended its breeding and housing services throughout Southern California to free up time and space to focus on research. Additionally, it gave clients access to expert advice on rat and mouse breeding concerns.

    In November 2021, DanBred P/S (Denmark) has expanded its subsidiary in Belgium. The establishment of DanBred Belgium allowed the company to further strengthen its relationships with its clients and completely integrate into the Belgian molecular breeding market.

    Future Outlook

    Molecular Breeding Market Future Outlook

    The Global Molecular Breeding Market is poised for growth at 16.24% CAGR from 2025 to 2035, driven by technological advancements, increasing demand for sustainable agriculture, and enhanced crop yield.

    New opportunities lie in:

    • Develop precision breeding technologies to enhance crop resilience against climate change.
    • Invest in partnerships with biotech firms to accelerate genetic research and product development.
    • Leverage data analytics for targeted breeding strategies to optimize yield and reduce costs.

    By 2035, the Molecular Breeding Market is expected to achieve substantial growth, reflecting its critical role in global agriculture.

    Market Segmentation

    Molecular Breeding Maker Outlook

    • SNP
    • SSR

    Molecular Breeding Process Outlook

    • Marker-assisted selection
    • Marker-assisted backcrossing
    • QTL mapping

    Molecular Breeding End User Outlook

    • Plant
    • Livestock

    Molecular Breeding Regional Outlook

    • US
    • Canada

    Report Scope

    Report Attribute/Metric Details
    Market Size 2024 USD 5.58 billion
    Market Size 2035 29.22
    Compound Annual Growth Rate (CAGR) 16.24% (2025 - 2035)
    Base Year 2024
    Forecast Period 2025 - 2035
    Historical Data 2019 to 2022
    Forecast Units Value (USD Billion)
    Report Coverage Revenue Forecast, Competitive Landscape, Growth Factors, and Trends
    Segments Covered Type, Treatment, End User, and Region
    Geographies Covered North America, Europe, Asia Pacific, South America, and Middle East and Africa
    Countries Covered The US, Canada, Germany, France, the UK, Italy, Spain, China, Japan, India, Australia, South Korea, Argentina and Brazil
    Key Companies Profiled Charles River Laboratories (US), Eurofins Scientific (Europe), DanBred P/S (Denmark), Intertek Group Plc (UK), Slipstream Automation (New Zealand), Illumina Inc (US), Thermo Fisher Scientific Inc (US), LGC Limited (England), SGS Société Générale de Surveillance SA (Switzerland), LemnaTec GmbH (Germany)
    Key Market Opportunities ·       Growing Investments in Research and Development ·       Increasing consumer preference for sustainably produced food
    Key Market Dynamics ·       Increasing development of High-Yielding and Stress-Resistant Varieties of molecular breeding ·       Rising awareness of molecular breeding ·       Growing consumer demand for foods with enhanced nutritional profiles
    Market Size 2025 6.49

    Market Highlights

    Author

    Rahul Gotadki
    Assistant Manager

    She holds an experience of about 6+ years in market research and business consulting, working under the spectrum of information communication technology, telecommunications and semiconductor domains. aarti conceptualizes and implements a scalable business strategy and provides strategic leadership to the clients. her expertise lies in market estimation, competitive intelligence, pipeline analysis, customer assessment, etc.

    Leave a Comment

    Latest Comments

    John Doe
    john@example.com

    This is a great article! Really helped me understand the topic better.

    Posted on July 23, 2025, 10:15 AM
    Jane Smith
    jane@domain.com

    Thanks for sharing this. I’ve bookmarked it for later reference.

    Posted on July 22, 2025, 7:45 PM

    FAQs

    How much is the Molecular Breeding Market?

    The Molecular Breeding Market is anticipated to reach 17.32 billion at a CAGR of 16.24% during the forecast period of 2024-2032.

    How big is the US Molecular Breeding Market?

    The US is expected to hold a 70-80% share of the North American market for the Molecular Breeding Market during the forecast period of 2024-2032.

    What is the growth rate of the Molecular Breeding Market?

    The Molecular Breeding Market is expected to grow at a 16.24% CAGR during the forecast period from 2024 to 2032.

    Which region held the largest market share in the Molecular Breeding Market?

    The North American region market held the largest market share in the Molecular Breeding Market.

    Who are the key players in the Molecular Breeding Market?

    The key players Charles River Laboratories (US), Eurofins Scientific (Europe), DanBred P/S (Denmark), Intertek Group Plc (UK), Slipstream Automation (New Zealand), Illumina Inc (US), Thermo Fisher Scientific Inc (US), LGC Limited (England), SGS Société Générale de Surveillance SA (Switzerland), LemnaTec GmbH (Germany) (Switzerland).

    Which type of Marker-assisted selection led the Molecular Breeding Market?

    The Marker-assisted selection segment was estimated to lead the Molecular Breeding Market.

    Which end user had the largest market share in the Molecular Breeding Market?

    The Plant segment is attributed to having the largest market share based on end users.

    1. Table of Contents
    2. Executive Summary
      1. OVERVIEW
    3. Market Introduction
      1. DEFINITION
      2. Scope of the Study
      3. RESEARCH OBJECTIVE
      4. MARKET STRUCTURE
      5. ASSUMPTIONS & LIMITATIONS
    4. Research Methodology
      1. DATA MINING
      2. SECONDARY RESEARCH
      3. PRIMARY RESEARCH
      4. BREAKDOWN OF PRIMARY RESPONDENTS
      5. FORECASTING TECHNIQUES
      6. Research Methodology FOR MARKET SIZE ESTIMATION
        1. Bottom-up Approach
        2. TOP-DOWN APPROACH
      7. DATA TRIANGULATION
      8. VALIDATION
    5. MARKET DYNAMICS
      1. OVERVIEW
      2. DRIVERS
        1. INCREASING DEVELOPMENT OF HIGH-YIELDING AND STRESS-RESISTANT VARIETIES OF MOLECULAR BREEDING
        2. RISING AWARENESS OF MOLECULAR BREEDING
      3. RESTRAINTS
        1. HIGH COSTS ASSOCIATED WITH IMPLEMENTING MOLECULAR BREEDING TECHNOLOGIES
      4. OPPORTUNITIES
        1. GROWING INVESTMENTS IN RESEARCH AND DEVELOPMENT
    6. MARKET FACTOR ANALYSIS
      1. PORTER''S FIVE FORCES MODEL
        1. THREAT OF NEW ENTRANTS
        2. BARGAINING POWER OF SUPPLIERS
        3. THREAT OF SUBSTITUTES
        4. BARGAINING POWER OF BUYERS
        5. INTENSITY OF RIVALRY
      2. IMPACT OF COVID-19 ON THE GLOBAL MOLECULAR BREEDING MARKET
    7. GLOBAL MOLECULAR BREEDING MARKET, BY PROCESS
      1. OVERVIEW
      2. MARKER-ASSISTED SELECTION
      3. MARKER-ASSISTED BACKCROSSING
      4. QTL MAPPING
    8. GLOBAL MOLECULAR BREEDING MARKET, BY MAKER
      1. OVERVIEW
      2. SNP
      3. SSR
    9. GLOBAL MOLECULAR BREEDING MARKET, BY APPLICATION
      1. OVERVIEW
      2. PLANT
      3. LIVESTOCK
    10. GLOBAL MOLECULAR BREEDING MARKET, BY REGION
      1. OVERVIEW
      2. NORTH AMERICA
        1. US
        2. CANADA
        3. MEXICO
      3. EUROPE
        1. GERMANY
        2. FRANCE
        3. UK
        4. ITALY
        5. SPAIN
        6. RUSSIA
        7. BENELUX
        8. NORDICS
        9. REST OF EUROPE
      4. ASIA-PACIFIC
        1. CHINA
        2. INDIA
        3. JAPAN
        4. SOUTH KOREA
        5. AUSTRALIA & NEW ZEALAND
        6. REST OF ASIA-PACIFIC
      5. SOUTH AMERICA
        1. BRAZIL
        2. ARGENTINA
        3. REST OF SOUTH AMERICA
      6. MEA
        1. GCC COUNTRIES
        2. TURKEY
        3. NORTHERN AFRICA
        4. SOUTHERN AFRICA
    11. Competitive Landscape
      1. THE LEADING PLAYERS IN TERMS OF NUMBER OF DEVELOPMENTS IN GLOBAL MOLECULAR BREEDING MARKET
      2. KEY DEVELOPMENTS & GROWTH STRATEGIES
        1. EXPANSION
      3. MAJOR PLAYERS FINANCIAL MATRIX
        1. SALES (USD BILLION), 2022
        2. R&D (USD BILLION), 2022
    12. COMPANY PROFILES
      1. CHARLES RIVER LABORATORIES
        1. COMPANY OVERVIEW
        2. FINANCIAL OVERVIEW
        3. PRODUCTS/SERVICES OFFERED
        4. KEY DEVELOPMENTS
        5. SWOT ANALYSIS
        6. KEY STRATEGIES
      2. EUROFINS SCIENTIFIC
        1. COMPANY OVERVIEW
        2. FINANCIAL OVERVIEW
        3. SERVICS OFFERED
        4. KEY DEVELOPMENTS
        5. SWOT ANALYSIS
        6. KEY STRATEGIES
      3. DANBRED P/S
        1. COMPANY OVERVIEWS
        2. FINANCIAL OVERVIEW
        3. SERVICE OFFERED
        4. KEY DEVELOPMENTS
        5. KEY STRATEGIES
      4. INTERTEK GROUP PLC
        1. COMPANY OVERVIEWS
        2. FINANCIAL OVERVIEW
        3. SERVICES OFFERED
        4. KEY DEVELOPMENTS
        5. KEY STRATEGIES
      5. SLIPSTREAM AUTOMATION
        1. COMPANY OVERVIEW
        2. FINANCIAL OVERVIEW
        3. PRODUCTS/SERVICES OFFERED
        4. KEY DEVELOPMENTS
        5. KEY STRATEGIES
      6. ILLUMINA INC
        1. COMPANY OVERVIEW
        2. FINANCIAL OVERVIEW
        3. PRODUCTS OFFERED
        4. KEY DEVELOPMENTS
        5. SWOT ANALYSIS
        6. KEY STRATEGIES
      7. THERMO FISHER SCIENTIFIC INC.
        1. COMPANY OVERVIEW
        2. FINANCIAL OVERVIEW
        3. PRODUCTS OFFERED
        4. SWOT ANALYSIS
        5. KEY DEVELOPMENTS
        6. KEY STRATEGIES
      8. LGC LIMITED
        1. COMPANY OVERVIEW
        2. FINANCIAL OVERVIEW
        3. SOLUTIONS/SERVICES OFFERED
        4. KEY DEVELOPMENTS
        5. SWOT ANALYSIS
        6. KEY STRATEGIES
      9. SGS SOCIÉTÉ GÉNÉRALE DE SURVEILLANCE SA
        1. COMPANY OVERVIEW
        2. FINANCIAL OVERVIEW
        3. PRODUCTS OFFERED
        4. KEY DEVELOPMENTS
        5. KEY STRATEGIES
      10. LEMNATEC GMBH
        1. COMPANY OVERVIEW
        2. FINANCIAL OVERVIEW
        3. SOLUTIONS OFFERED
        4. KEY DEVELOPMENTS
        5. KEY STRATEGIES
    13. APPENDIX
      1. REFERENCES
      2. RELATED REPORTS
    14. List of Tables and Figures
      1. LIST OF TABLES
      2. TABLE 1 LIST OF ASSUMPTIONS & LIMITATIONS
      3. TABLE 2 GLOBAL MOLECULAR BREEDING MARKET, BY PROCESS, 2019–2032 (USD BILLION)
      4. TABLE 3 GLOBAL MOLECULAR BREEDING MARKET, FOR MARKER-ASSISTED SELECTION, BY REGION, 2019–2032 (USD BILLION)
      5. TABLE 4 GLOBAL MOLECULAR BREEDING MARKET, FOR MARKER-ASSISTED BACKCROSSING, BY REGION, 2019–2032 (USD BILLION)
      6. TABLE 5 GLOBAL MOLECULAR BREEDING MARKET, FOR QTL MAPPING, BY REGION, 2019–2032 (USD BILLION)
      7. TABLE 6 GLOBAL MOLECULAR BREEDING MARKET, BY MAKER, 2019–2032 (USD BILLION)
      8. TABLE 7 GLOBAL MOLECULAR BREEDING MARKET, FOR SNP, BY REGION, 2019–2032 (USD BILLION)
      9. TABLE 8 GLOBAL MOLECULAR BREEDING MARKET, FOR SSR, BY REGION, 2019–2032 (USD BILLION)
      10. TABLE 9 GLOBAL MOLECULAR BREEDING MARKET, BY APPLICATION, 2019–2032 (USD BILLION)
      11. TABLE 10 GLOBAL MOLECULAR BREEDING MARKET, FOR PLANT, BY REGION, 2019–2032 (USD BILLION)
      12. TABLE 11 GLOBAL MOLECULAR BREEDING MARKET, FOR LIVESTOCK, BY REGION, 2019–2032 (USD BILLION)
      13. TABLE 12 GLOBAL MOLECULAR BREEDING MARKET, BY REGION, 2019–2032 (USD BILLION)
      14. TABLE 13 NORTH AMERICA: MOLECULAR BREEDING MARKET, BY COUNTRY, 2019–2032 (USD BILLION)
      15. TABLE 14 NORTH AMERICA: MOLECULAR BREEDING MARKET, BY PROCESS, 2019–2032 (USD BILLION)
      16. TABLE 15 NORTH AMERICA: MOLECULAR BREEDING MARKET, BY MARKER, 2019–2032 (USD BILLION)
      17. TABLE 16 NORTH AMERICA: MOLECULAR BREEDING MARKET, BY APPLICATION, 2019–2032 (USD BILLION)
      18. TABLE 17 US: MOLECULAR BREEDING MARKET, BY PROCESS, 2019–2032 (USD BILLION)
      19. TABLE 18 US: MOLECULAR BREEDING MARKET, BY MARKER, 2019–2032 (USD BILLION)
      20. TABLE 19 US: MOLECULAR BREEDING MARKET, BY APPLICATION, 2019–2032 (USD BILLION)
      21. TABLE 20 CANADA: MOLECULAR BREEDING MARKET, BY PROCESS, 2019–2032 (USD BILLION)
      22. TABLE 21 CANADA: MOLECULAR BREEDING MARKET, BY MARKER, 2019–2032 (USD BILLION)
      23. TABLE 22 CANADA: MOLECULAR BREEDING MARKET, BY APPLICATION, 2019–2032 (USD BILLION)
      24. TABLE 23 MEXICO: MOLECULAR BREEDING MARKET, BY PROCESS, 2019–2032 (USD BILLION)
      25. TABLE 24 MEXICO: MOLECULAR BREEDING MARKET, BY MARKER, 2019–2032 (USD BILLION)
      26. TABLE 25 MEXICO: MOLECULAR BREEDING MARKET, BY APPLICATION, 2019–2032 (USD BILLION)
      27. TABLE 26 EUROPE: MOLECULAR BREEDING MARKET, BY COUNTRY, 2019–2032 (USD BILLION)
      28. TABLE 27 EUROPE MOLECULAR BREEDING MARKET, BY PROCESS, 2019–2032 (USD BILLION)
      29. TABLE 28 EUROPE MOLECULAR BREEDING MARKET, BY MARKER, 2019–2032 (USD BILLION)
      30. TABLE 29 EUROPE MOLECULAR BREEDING MARKET, BY APPLICATION, 2019–2032 (USD BILLION)
      31. TABLE 30 GERMANY: MOLECULAR BREEDING MARKET, BY PROCESS, 2019–2032 (USD BILLION)
      32. TABLE 31 GERMANY: MOLECULAR BREEDING MARKET, BY MARKER, 2019–2032 (USD BILLION)
      33. TABLE 32 GERMANY: MOLECULAR BREEDING MARKET, BY APPLICATION, 2019–2032 (USD BILLION)
      34. TABLE 33 FRANCE: MOLECULAR BREEDING MARKET, BY PROCESS, 2019–2032 (USD BILLION)
      35. TABLE 34 FRANCE: MOLECULAR BREEDING MARKET, BY MARKER, 2019–2032 (USD BILLION)
      36. TABLE 35 FRANCE: MOLECULAR BREEDING MARKET, BY APPLICATION, 2019–2032 (USD BILLION)
      37. TABLE 36 UK: MOLECULAR BREEDING MARKET, BY PROCESS, 2019–2032 (USD BILLION)
      38. TABLE 37 UK: MOLECULAR BREEDING MARKET, BY MARKER, 2019–2032 (USD BILLION)
      39. TABLE 38 UK: MOLECULAR BREEDING MARKET, BY APPLICATION, 2019–2032 (USD BILLION)
      40. TABLE 39 ITALY: MOLECULAR BREEDING MARKET, BY PROCESS, 2019–2032 (USD BILLION)
      41. TABLE 40 ITALY: MOLECULAR BREEDING MARKET, BY MARKER, 2019–2032 (USD BILLION)
      42. TABLE 41 ITALY: MOLECULAR BREEDING MARKET, BY APPLICATION, 2019–2032 (USD BILLION)
      43. TABLE 42 SPAIN: MOLECULAR BREEDING MARKET, BY PROCESS, 2019–2032 (USD BILLION)
      44. TABLE 43 SPAIN: MOLECULAR BREEDING MARKET, BY MARKER, 2019–2032 (USD BILLION)
      45. TABLE 44 SPAIN: MOLECULAR BREEDING MARKET, BY APPLICATION, 2019–2032 (USD BILLION)
      46. TABLE 45 RUSSIA: MOLECULAR BREEDING MARKET, BY PROCESS, 2019–2032 (USD BILLION)
      47. TABLE 46 RUSSIA: MOLECULAR BREEDING MARKET, BY MARKER, 2019–2032 (USD BILLION)
      48. TABLE 47 RUSSIA: MOLECULAR BREEDING MARKET, BY APPLICATION, 2019–2032 (USD BILLION)
      49. TABLE 48 BENELUX: MOLECULAR BREEDING MARKET, BY PROCESS, 2019–2032 (USD BILLION)
      50. TABLE 49 BENELUX: MOLECULAR BREEDING MARKET, BY MARKER, 2019–2032 (USD BILLION)
      51. TABLE 50 BENELUX: MOLECULAR BREEDING MARKET, BY APPLICATION, 2019–2032 (USD BILLION)
      52. TABLE 51 NORDICS: MOLECULAR BREEDING MARKET, BY PROCESS, 2019–2032 (USD BILLION)
      53. TABLE 52 NORDICS: MOLECULAR BREEDING MARKET, BY MARKER, 2019–2032 (USD BILLION)
      54. TABLE 53 NORDICS: MOLECULAR BREEDING MARKET, BY APPLICATION, 2019–2032 (USD BILLION)
      55. TABLE 54 REST OF EUROPE: MOLECULAR BREEDING MARKET, BY PROCESS, 2019–2032 (USD BILLION)
      56. TABLE 55 REST OF EUROPE: MOLECULAR BREEDING MARKET, BY MARKER, 2019–2032 (USD BILLION)
      57. TABLE 56 REST OF EUROPE: MOLECULAR BREEDING MARKET, BY APPLICATION, 2019–2032 (USD BILLION)
      58. TABLE 57 ASIA-PACIFIC: MOLECULAR BREEDING MARKET, BY COUNTRY, 2019–2032 (USD BILLION)
      59. TABLE 58 ASIA-PACIFIC: MOLECULAR BREEDING MARKET, BY PROCESS, 2019–2032 (USD BILLION)
      60. TABLE 59 ASIA-PACIFIC: MOLECULAR BREEDING MARKET, BY MAKER, 2019–2032 (USD BILLION)
      61. TABLE 60 ASIA-PACIFIC: MOLECULAR BREEDING MARKET, BY APPLICATION, 2019–2032 (USD BILLION)
      62. TABLE 61 CHINA: MOLECULAR BREEDING MARKET, BY PROCESS, 2019–2032 (USD BILLION)
      63. TABLE 62 CHINA: MOLECULAR BREEDING MARKET, BY MAKER, 2019–2032 (USD BILLION)
      64. TABLE 63 CHINA: MOLECULAR BREEDING MARKET, BY APPLICATION, 2019–2032 (USD BILLION)
      65. TABLE 64 INDIA: MOLECULAR BREEDING MARKET, BY PROCESS, 2019–2032 (USD BILLION)
      66. TABLE 65 INDIA: MOLECULAR BREEDING MARKET, BY MAKER, 2019–2032 (USD BILLION)
      67. TABLE 66 INDIA: MOLECULAR BREEDING MARKET, BY APPLICATION, 2019–2032 (USD BILLION)
      68. TABLE 67 JAPAN: MOLECULAR BREEDING MARKET, BY PROCESS, 2019–2032 (USD BILLION)
      69. TABLE 68 JAPAN: MOLECULAR BREEDING MARKET, BY MAKER, 2019–2032 (USD BILLION)
      70. TABLE 69 JAPAN: MOLECULAR BREEDING MARKET, BY APPLICATION, 2019–2032 (USD BILLION)
      71. TABLE 70 SOUTH KOREA: MOLECULAR BREEDING MARKET, BY PROCESS, 2019–2032 (USD BILLION)
      72. TABLE 71 SOUTH KOREA: MOLECULAR BREEDING MARKET, BY MAKER, 2019–2032 (USD BILLION)
      73. TABLE 72 SOUTH KOREA: MOLECULAR BREEDING MARKET, BY APPLICATION, 2019–2032 (USD BILLION)
      74. TABLE 73 AUSTRALIA & NEW ZEALAND: MOLECULAR BREEDING MARKET, BY PROCESS, 2019–2032 (USD BILLION)
      75. TABLE 74 AUSTRALIA & NEW ZEALAND: MOLECULAR BREEDING MARKET, BY MAKER, 2019–2032 (USD BILLION)
      76. TABLE 75 AUSTRALIA & NEW ZEALAND: MOLECULAR BREEDING MARKET, BY APPLICATION, 2019–2032 (USD BILLION)
      77. TABLE 76 REST OF ASIA PACIFIC: MOLECULAR BREEDING MARKET, BY PROCESS, 2019–2032 (USD BILLION)
      78. TABLE 77 REST OF ASIA PACIFIC: MOLECULAR BREEDING MARKET, BY MAKER, 2019–2032 (USD BILLION)
      79. TABLE 78 REST OF ASIA PACIFIC: MOLECULAR BREEDING MARKET, BY APPLICATION, 2019–2032 (USD BILLION)
      80. TABLE 79 SOUTH AMERICA: MOLECULAR BREEDING MARKET, BY COUNTRY, 2019–2032 (USD BILLION)
      81. TABLE 80 SOUTH AMERICA: MOLECULAR BREEDING MARKET, BY PROCESS, 2019–2032 (USD BILLION)
      82. TABLE 81 SOUTH AMERICA: MOLECULAR BREEDING MARKET, BY MAKER, 2019–2032 (USD BILLION)
      83. TABLE 82 SOUTH AMERICA: MOLECULAR BREEDING MARKET, BY APPLICATION, 2019–2032 (USD BILLION)
      84. TABLE 83 BRAZIL: MOLECULAR BREEDING MARKET, BY PROCESS, 2019–2032 (USD BILLION)
      85. TABLE 84 BRAZIL: MOLECULAR BREEDING MARKET, BY MAKER, 2019–2032 (USD BILLION)
      86. TABLE 85 BRAZIL: MOLECULAR BREEDING MARKET, BY APPLICATION, 2019–2032 (USD BILLION)
      87. TABLE 86 ARGENTINA: MOLECULAR BREEDING MARKET, BY PROCESS, 2019–2032 (USD BILLION)
      88. TABLE 87 ARGENTINA: MOLECULAR BREEDING MARKET, BY MAKER, 2019–2032 (USD BILLION)
      89. TABLE 88 ARGENTINA: MOLECULAR BREEDING MARKET, BY APPLICATION, 2019–2032 (USD BILLION)
      90. TABLE 89 REST OF SOUTH AMERICA: MOLECULAR BREEDING MARKET, BY PROCESS, 2019–2032 (USD BILLION)
      91. TABLE 90 REST OF SOUTH AMERICA: MOLECULAR BREEDING MARKET, BY MAKER, 2019–2032 (USD BILLION)
      92. TABLE 91 REST OF SOUTH AMERICA: MOLECULAR BREEDING MARKET, BY APPLICATION, 2019–2032 (USD BILLION)
      93. TABLE 92 MEA: MOLECULAR BREEDING MARKET, BY COUNTRY, 2019–2032 (USD BILLION)
      94. TABLE 93 MEA: MOLECULAR BREEDING MARKET, BY PROCESS, 2019–2032 (USD BILLION)
      95. TABLE 94 MEA: MOLECULAR BREEDING MARKET, BY MAKER, 2019–2032 (USD BILLION)
      96. TABLE 95 MEA: MOLECULAR BREEDING MARKET, BY APPLICATION, 2019–2032 (USD BILLION)
      97. TABLE 96 GCC COUNTRIES: MOLECULAR BREEDING MARKET, BY PROCESS, 2019–2032 (USD BILLION)
      98. TABLE 97 GCC COUNTRIES: MOLECULAR BREEDING MARKET, BY MAKER, 2019–2032 (USD BILLION)
      99. TABLE 98 GCC COUNTRIES: MOLECULAR BREEDING MARKET, BY APPLICATION, 2019–2032 (USD BILLION)
      100. TABLE 99 TURKEY: MOLECULAR BREEDING MARKET, BY PROCESS, 2019–2032 (USD BILLION)
      101. TABLE 100 TURKEY: MOLECULAR BREEDING MARKET, BY MAKER, 2019–2032 (USD BILLION)
      102. TABLE 101 TURKEY: MOLECULAR BREEDING MARKET, BY APPLICATION, 2019–2032 (USD BILLION)
      103. TABLE 102 NORTHERN AFRICA: MOLECULAR BREEDING MARKET, BY PROCESS, 2019–2032 (USD BILLION)
      104. TABLE 103 NORTHERN AFRICA: MOLECULAR BREEDING MARKET, BY MAKER, 2019–2032 (USD BILLION)
      105. TABLE 104 NORTHERN AFRICA: MOLECULAR BREEDING MARKET, BY APPLICATION, 2019–2032 (USD BILLION)
      106. TABLE 105 SOUTHERN AFRICA: MOLECULAR BREEDING MARKET, BY PROCESS, 2019–2032 (USD BILLION)
      107. TABLE 106 SOUTHERN AFRICA: MOLECULAR BREEDING MARKET, BY MAKER, 2019–2032 (USD BILLION)
      108. TABLE 107 SOUTHERN AFRICA: MOLECULAR BREEDING MARKET, BY APPLICATION, 2019–2032 (USD BILLION)
      109. TABLE 108 MAJOR PLAYERS IN THE GLOBAL MOLECULAR BREEDING MARKET
      110. TABLE 109 MOST ACTIVE PLAYERS IN THE GLOBAL MOLECULAR BREEDING MARKET
      111. TABLE 110 EXPANSION
      112. TABLE 111 CHARLES RIVER LABORATORIES: PRODUCTS/SERVICES OFFERED
      113. TABLE 112 CHARLES RIVER LABORATORIES: KEY DEVELOPMENTS
      114. TABLE 113 EUROFINS SCIENTIFIC: SERVICE OFFERED

        Molecular Breeding Market Segmentation

        Molecular Breeding Process Outlook (USD Billion, 2019-2032)

        • Marker-assisted selection
        • Marker-assisted backcrossing
        • QTL mapping

        Molecular Breeding Maker Outlook (USD Billion, 2019-2032)

        • SNP
        • SSR  

        Molecular Breeding Application Outlook (USD Billion, 2019-2032)

        • Plant
        • Livestock

        Molecular Breeding Regional Outlook (USD Billion, 2019-2032)

        • North America Outlook (USD Billion, 2019-2032)
          • North America Molecular Breeding by Process
            • Marker-assisted selection
            • Marker-assisted backcrossing
            • QTL mapping
          • North America Molecular Breeding by Maker
            • SNP
            • SSR
          • North America Molecular Breeding by Application
            • Plant
            • Livestock
          • US Outlook (USD Billion, 2019-2032)
        • US Outlook (USD Billion, 2019-2032)
          • US Molecular Breeding by Process
            • Marker-assisted selection
            • Marker-assisted backcrossing
            • QTL mapping
          • US Molecular Breeding by Maker
            • SNP
            • SSR
          • US Molecular Breeding by Application
            • Plant
            • Livestock
          • Canada Outlook (USD Billion, 2019-2032)
          • Canada Molecular Breeding by Process
            • Marker-assisted selection
            • Marker-assisted backcrossing
            • QTL mapping
          • Canada Molecular Breeding by Maker
            • SNP
            • SSR
          • Canada Molecular Breeding by Application
            • Plant
            • Livestock
          • Europe Outlook (USD Billion, 2019-2032)
            • Europe Molecular Breeding by Process
              • Marker-assisted selection
              • Marker-assisted backcrossing
              • QTL mapping
            • Europe Molecular Breeding by Maker
              • SNP
              • SSR
            • Europe Molecular Breeding by Application
              • Plant
              • Livestock
            • Germany Outlook (USD Billion, 2019-2032)
            • Germany Molecular Breeding by Process
              • Marker-assisted selection
              • Marker-assisted backcrossing
              • QTL mapping
            • Germany Molecular Breeding by Maker
              • SNP
              • SSR
            • Germany Molecular Breeding by Application
              • Plant
              • Livestock
            • France Outlook (USD Billion, 2019-2032)
            • France Molecular Breeding by Process
              • Marker-assisted selection
              • Marker-assisted backcrossing
              • QTL mapping
            • France Molecular Breeding by Maker
              • SNP
              • SSR
            • France Molecular Breeding by Application
              • Plant
              • Livestock
            • UK Outlook (USD Billion, 2019-2032)
            • UK Molecular Breeding by Process
              • Marker-assisted selection
              • Marker-assisted backcrossing
              • QTL mapping
            • UK Molecular Breeding by Maker
              • SNP
              • SSR
            • UK Molecular Breeding by Application
              • Plant
              • Livestock
            • Italy Outlook (USD Billion, 2019-2032)
            • Italy Molecular Breeding by Process
              • Marker-assisted selection
              • Marker-assisted backcrossing
              • QTL mapping
            • Italy Molecular Breeding by Maker
              • SNP
              • SSR
            • Italy Molecular Breeding by Application
              • Plant
              • Livestock
            • Spain Outlook (USD Billion, 2019-2032)
            • Spain Molecular Breeding by Process
              • Marker-assisted selection
              • Marker-assisted backcrossing
              • QTL mapping
            • Spain Molecular Breeding by Maker
              • SNP
              • SSR
            • Spain Molecular Breeding by Application
              • Plant
              • Livestock
            • Rest Of Europe Outlook (USD Billion, 2019-2032)
            • Rest Of Europe Molecular Breeding by Process
              • Marker-assisted selection
              • Marker-assisted backcrossing
              • QTL mapping
            • Rest Of Europe Molecular Breeding by Maker
              • SNP
              • SSR
            • Rest Of Europe Molecular Breeding by Application
              • Plant
              • Livestock
            • Asia-Pacific Outlook (USD Billion, 2019-2032)
              • Asia-Pacific Molecular Breeding by Process
                • Marker-assisted selection
                • Marker-assisted backcrossing
                • QTL mapping
              • Asia-Pacific Molecular Breeding by Maker
                • SNP
                • SSR
              • Asia-Pacific Molecular Breeding by Application
                • Plant
                • Livestock
              • China Outlook (USD Billion, 2019-2032)
              • China Molecular Breeding by Process
                • Marker-assisted selection
                • Marker-assisted backcrossing
                • QTL mapping
              • China Molecular Breeding by Maker
                • SNP
                • SSR
              • China Molecular Breeding by Application
                • Plant
                • Livestock
              • Japan Outlook (USD Billion, 2019-2032)
              • Japan Molecular Breeding by Process
                • Marker-assisted selection
                • Marker-assisted backcrossing
                • QTL mapping
              • Japan Molecular Breeding by Maker
                • SNP
                • SSR
              • Japan Molecular Breeding by Application
                • Plant
                • Livestock
              • India Outlook (USD Billion, 2019-2032)
              • India Molecular Breeding by Process
                • Marker-assisted selection
                • Marker-assisted backcrossing
                • QTL mapping
              • India Molecular Breeding by Maker
                • SNP
                • SSR
              • India Molecular Breeding by Application
                • Plant
                • Livestock
              • Australia Outlook (USD Billion, 2019-2032)
              • Australia Molecular Breeding by Process
                • Marker-assisted selection
                • Marker-assisted backcrossing
                • QTL mapping
              • Australia Molecular Breeding by Maker
                • SNP
                • SSR
              • Australia Molecular Breeding by Application
                • Plant
                • Livestock
              • South Korea Outlook (USD Billion, 2019-2032)
              • South Korea Molecular Breeding by Process
                • Marker-assisted selection
                • Marker-assisted backcrossing
                • QTL mapping
              • South Korea Molecular Breeding by Maker
                • SNP
                • SSR
              • South Korea Molecular Breeding by Application
                • Plant
                • Livestock
              • Rest of Asia-Pacific Outlook (USD Billion, 2019-2032)
              • Rest of Asia-Pacific Molecular Breeding by Process
                • Marker-assisted selection
                • Marker-assisted backcrossing
                • QTL mapping
              • Rest of Asia-Pacific Molecular Breeding by Maker
                • SNP
                • SSR
              • Rest of Asia-Pacific Molecular Breeding by Application
                • Plant
                • Livestock
              • Middle East Outlook (USD Billion, 2019-2032)
              • Middle East Molecular Breeding by Process
                • Marker-assisted selection
                • Marker-assisted backcrossing
                • QTL mapping
              • Middle East Molecular Breeding by Maker
                • SNP
                • SSR
              • Middle East Molecular Breeding by Application
                • Plant
                • Livestock
              • GCC Countries Outlook (USD Billion, 2019-2032)
              • GCC Countries Molecular Breeding by Process
                • Marker-assisted selection
                • Marker-assisted backcrossing
                • QTL mapping
              • GCC Countries Molecular Breeding by Maker
                • SNP
                • SSR
              • GCC Countries Molecular Breeding by Application
                • Plant
                • Livestock
              • Turkey Outlook (USD Billion, 2019-2032)
              • Turkey Molecular Breeding by Process
                • Marker-assisted selection
                • Marker-assisted backcrossing
                • QTL mapping
              • Turkey Molecular Breeding by Maker
                • SNP
                • SSR
              • Turkey Molecular Breeding by Application
                • Plant
                • Livestock
              • Northern Africa Outlook (USD Billion, 2019-2032)
              • Northern Africa Molecular Breeding by Process
                • Marker-assisted selection
                • Marker-assisted backcrossing
                • QTL mapping
              • Northern Africa Molecular Breeding by Maker
                • SNP
                • SSR
              • Northern Africa Molecular Breeding by Application
                • Plant
                • Livestock
              • Southern Africa Outlook (USD Billion, 2019-2032)
              • Southern Africa Molecular Breeding by Process
                • Marker-assisted selection
                • Marker-assisted backcrossing
                • QTL mapping
              • Southern Africa Molecular Breeding by Maker
                • SNP
                • SSR
              • Southern Africa Molecular Breeding by Application
                • Plant
                • Livestock
              • South America Outlook (USD Billion, 2019-2032)
              • South America Molecular Breeding by Process
                • Marker-assisted selection
                • Marker-assisted backcrossing
                • QTL mapping
              • South America Molecular Breeding by Maker
                • SNP
                • SSR
              • South America Molecular Breeding by Application
                • Plant
                • Livestock
              • Brazil Outlook (USD Billion, 2019-2032)
              • Brazil Molecular Breeding by Process
                • Marker-assisted selection
                • Marker-assisted backcrossing
                • QTL mapping
              • Brazil Molecular Breeding by Maker
                • SNP
                • SSR
              • Brazil Molecular Breeding by Application
                • Plant
                • Livestock
              • Argentina Outlook (USD Billion, 2019-2032)
              • Argentina Molecular Breeding by Process
                • Marker-assisted selection
                • Marker-assisted backcrossing
                • QTL mapping
              • Argentina Molecular Breeding by Maker
                • SNP
                • SSR
              • Argentina Molecular Breeding by Application
                • Plant
                • Livestock
              • Rest of South America Outlook (USD Billion, 2019-2032)
              • Rest of South America Molecular Breeding by Process
                • Marker-assisted selection
                • Marker-assisted backcrossing
                • QTL mapping
              • Rest of South America Molecular Breeding by Maker
                • SNP
                • SSR
              • Rest of South America Molecular Breeding by Application
                • Plant
                • Livestock
    Infographic

    Free Sample Request

    Kindly complete the form below to receive a free sample of this Report

    Get Free Sample

    Customer Strories

    “I am very pleased with how market segments have been defined in a relevant way for my purposes (such as "Portable Freezers & refrigerators" and "last-mile"). In general the report is well structured. Thanks very much for your efforts.”

    Victoria Milne

    Founder
    Case Study
    Chemicals and Materials