

Food, Beverages & Nutrition Market Segmentation
Food, Beverages & Nutrition By Application (USD Billion, 2025-2035)
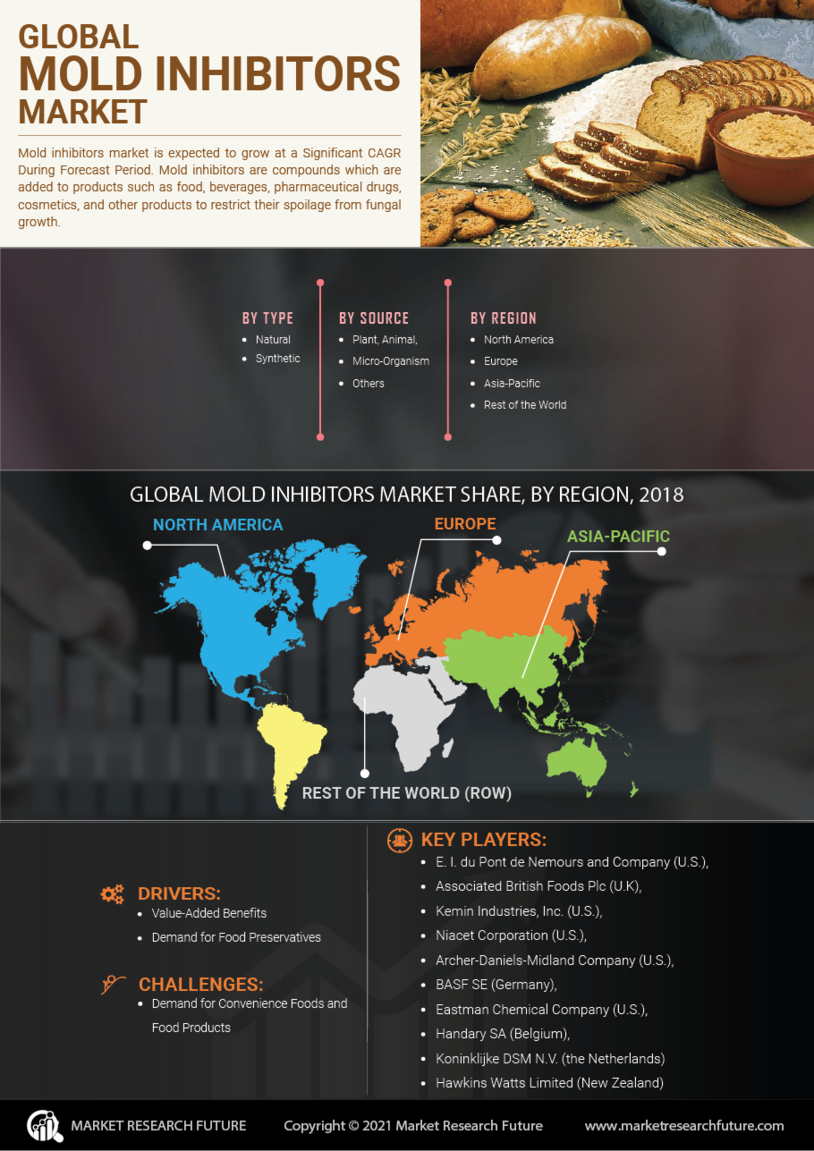
- Food Preservation
- Paints and Coatings
- Textiles
- Building Materials
Food, Beverages & Nutrition By Type (USD Billion, 2025-2035)
- Natural Mold Inhibitors
- Chemical Mold Inhibitors
- Physical Mold Inhibitors
Food, Beverages & Nutrition By Formulation (USD Billion, 2025-2035)
- Liquid
- Powder
- Granular
Food, Beverages & Nutrition By End Use (USD Billion, 2025-2035)
- Food and Beverage Industry
- Construction Industry
- Textile Industry
- Consumer Goods


