ID: MRFR/ICT/7168-HCR | August 2022 | Region: Global | 140 Pages
Table of Contents
1. EXECUTIVE SUMMARY
1.1. Market Attractiveness Analysis
1.1.1. Global Mobile VOIP Market, by Services
1.1.2. Global Mobile VOIP Market, by OS Type
1.1.3. Global Mobile VOIP Market, by User Type
1.1.4. Global Mobile VOIP Market, by Region
2. MARKET INTRODUCTION
2.1. Definition
2.2. Scope of the Study
2.3. Market Structure
3. RESEARCH METHODOLOGY
3.1. Research Process
3.2. Primary Research
3.3. Secondary Research
3.4. Market Size Estimation
3.5. Forecast Model
3.6. List of Assumptions
4. MARKET DYNAMICS
4.1. Introduction
4.2. Drivers
4.2.1. Strong penetration of internet network
4.2.2. Increasing smartphone penetration
4.2.3. Trend of BYOD in enterprises
4.3. Restraints
4.3.1. Awareness about Mobile VOIP services
4.4. Opportunities
4.4.1. Lower monthly bill associated with VOIP is expected to create opportunity
4.4.2. Introduction of various services including unified communication and Mobile OTT
4.5. Challenge
4.5.1. Growing competition in the market
5. MARKET FACTOR ANALYSIS
5.1. Value Chain Analysis/Supply Chain Analysis
5.2. Porterโs Five Forces Model
5.2.1. Bargaining Power of Suppliers
5.2.2. Bargaining Power of Buyers
5.2.3. Threat of New Entrants
5.2.4. Threat of Substitutes
5.2.5. Intensity of Rivalry
6. GLOBAL MOBILE VOIP MARKET, BY SERVICES
6.1. Introduction
6.2. Voice
6.2.1. International VOIP Calls
6.2.2. Enterprise System Management Domestic VOIP Calls
6.3. Video
6.4. Instant Messaging
7. GLOBAL MOBILE VOIP MARKET, BY OS TYPE
7.1. Introduction
7.2. Android
7.3. iOS
7.4. Windows
7.5. Others
8. GLOBAL MOBILE VOIP MARKET, BY USER TYPE
8.1. Introduction
8.2. Enterprises
8.3. Individuals
9. GLOBAL MOBILE VOIP MARKET, BY REGION
9.1. Introduction
9.2. North America
9.2.1. US
9.2.2. Canada
9.2.3. Mexico
9.3. Europe
9.3.1. Germany
9.3.2. France
9.3.3. UK
9.3.4. Rest of Europe
9.4. Asia-Pacific
9.4.1. China
9.4.2. India
9.4.3. Rest of Asia-Pacific
9.5. Middle East & Africa
9.6. South America
10. COMPETITIVE LANDSCAPE
10.1. Introduction
10.2. Competitive Analysis
11. COMPANY PROFILES
11.1. 3CX
11.1.1. Company Overview
11.1.2. Financial Overview
11.1.3. Products Offered
11.1.4. Key Developments
11.1.5. SWOT Analysis
11.1.6. Key Strategies
11.2. Vonage
11.2.1. Company Overview
11.2.2. Financial Overview
11.2.3. Products Offered
11.2.4. Key Developments
11.2.5. SWOT Analysis
11.2.6. Key Strategies
11.3. Microsoft Corporation
11.3.1. Company Overview
11.3.2. Financial Overview
11.3.3. Products Offered
11.3.4. Key Developments
11.3.5. SWOT Analysis
11.3.6. Key Strategies
11.4. Facebook Inc.
11.4.1. Company Overview
11.4.2. Financial Overview
11.4.3. Products Offered
11.4.4. Key Developments
11.4.5. SWOT Analysis
11.4.6. Key Strategies
11.5. Rebtel
11.5.1. Company Overview
11.5.2. Financial Overview
11.5.3. Products Offered
11.5.4. Key Developments
11.5.5. SWOT Analysis
11.5.6. Key Strategies
11.6. CommPeak Limited
11.6.1. Company Overview
11.6.2. Financial Overview
11.6.3. Products Offered
11.6.4. Key Developments
11.6.5. SWOT Analysis
11.6.6. Key Strategies
11.7. 8x8, Inc
11.7.1. Company Overview
11.7.2. Financial Overview
11.7.3. Products Offered
11.7.4. Key Developments
11.7.5. SWOT Analysis
11.7.6. Key Strategies
11.8. Nextiva
11.8.1. Company Overview
11.8.2. Financial Overview
11.8.3. Products Offered
11.8.4. Key Developments
11.8.5. SWOT Analysis
11.8.6. Key Strategies
11.9. Phone Power
11.9.1. Company Overview
11.9.2. Financial Overview
11.9.3. Products Offered
11.9.4. Key Developments
11.9.5. SWOT Analysis
11.9.6. Key Strategies
11.10. Tata Communications
11.10.1. Company Overview
11.10.2. Financial Overview
11.10.3. Products Offered
11.10.4. Key Developments
11.10.5. SWOT Analysis
11.10.6. Key Strategies
11.11. VoIP Office
11.11.1. Company Overview
11.11.2. Financial Overview
11.11.3. Products Offered
11.11.4. Key Developments
11.11.5. SWOT Analysis
11.11.6. Key Strategies
11.12. RingCentral, Inc.
11.12.1. Company Overview
11.12.2. Financial Overview
11.12.3. Products Offered
11.12.4. Key Developments
11.12.5. SWOT Analysis
11.12.6. Key Strategies
11.13. Junction Networks
11.13.1. Company Overview
11.13.2. Financial Overview
11.13.3. Products Offered
11.13.4. Key Developments
11.13.5. SWOT Analysis
11.13.6. Key Strategies
12. APPENDIX
12.1.1. Discussion Blueprint
NOTE:
This table of content is tentative and subject to change as the research progresses.
In section 12, only the top 13 companies will be profiled. Each company will be profiled based on the Market Overview, Financials, Product Portfolio, Business Strategies, and Recent Developments parameters.
Please note: The financial details of the company cannot be provided if the information is not available in the public domain and or from reliable sources.
LIST OF TABLES
TABLE 1: LIST OF ASSUMPTIONS
TABLE 2 GLOBAL MOBILE VOIP MARKET, BY SERVICES, 2020-2027 (USD MILLION)
TABLE 3 GLOBAL MOBILE VOIP MARKET, BY OS TYPE, 2020-2027 (USD MILLION)
TABLE 4 GLOBAL MOBILE VOIP MARKET, BY USER TYPE, 2020-2027 (USD MILLION)
TABLE 5 GLOBAL MOBILE VOIP MARKET, BY REGION, 2020-2027 (USD MILLION)
TABLE 6 NORTH AMERICA: MOBILE VOIP MARKET, BY COUNTRY, 2020-2027 (USD MILLION)
TABLE 7 NORTH AMERICA: MOBILE VOIP MARKET, BY SERVICES, 2020-2027 (USD MILLION)
TABLE 8 NORTH AMERICA: MOBILE VOIP MARKET, BY OS TYPE, 2020-2027 (USD MILLION)
TABLE 9 NORTH AMERICA: MOBILE VOIP MARKET, BY USER TYPE, 2020-2027 (USD MILLION)
TABLE 10 US: MOBILE VOIP MARKET, BY SERVICES, 2020-2027 (USD MILLION)
TABLE 11 US: MOBILE VOIP MARKET, BY OS TYPE, 2020-2027 (USD MILLION)
TABLE 12 US: MOBILE VOIP MARKET, BY USER TYPE, 2020-2027 (USD MILLION)
TABLE 13 CANADA: MOBILE VOIP MARKET, BY SERVICES, 2020-2027 (USD MILLION)
TABLE 14 CANADA: MOBILE VOIP MARKET, BY OS TYPE, 2020-2027 (USD MILLION)
TABLE 15 CANADA: MOBILE VOIP MARKET, BY USER TYPE, 2020-2027 (USD MILLION)
TABLE 16 MEXICO: MOBILE VOIP MARKET, BY SERVICES, 2020-2027 (USD MILLION)
TABLE 17 GLOBAL MOBILE VOIP MARKET, BY OS TYPE, 2020-2027 (USD MILLION)
TABLE 18 MEXICO: MOBILE VOIP MARKET, BY USER TYPE, 2020-2027 (USD MILLION)
TABLE 19 EUROPE: MOBILE VOIP MARKET, BY COUNTRY, 2020-2027 (USD MILLION)
TABLE 20 EUROPE: MOBILE VOIP MARKET, BY SERVICES, 2020-2027 (USD MILLION)
TABLE 21 EUROPE: MOBILE VOIP MARKET, BY OS TYPE, 2020-2027 (USD MILLION)
TABLE 22 EUROPE: MOBILE VOIP MARKET, BY USER TYPE, 2020-2027 (USD MILLION)
TABLE 23 UK: MOBILE VOIP MARKET, BY SERVICES, 2020-2027 (USD MILLION)
TABLE 24 UK: MOBILE VOIP MARKET, BY OS TYPE, 2020-2027 (USD MILLION)
TABLE 25 UK: MOBILE VOIP MARKET, BY USER TYPE, 2020-2027 (USD MILLION)
TABLE 26 GERMANY: MOBILE VOIP MARKET, BY SERVICES, 2020-2027 (USD MILLION)
TABLE 27 GERMANY: MOBILE VOIP MARKET, BY OS TYPE, 2020-2027 (USD MILLION)
TABLE 28 GERMANY: MOBILE VOIP MARKET, BY USER TYPE, 2020-2027 (USD MILLION)
TABLE 29 FRANCE: MOBILE VOIP MARKET, BY SERVICES, 2020-2027 (USD MILLION)
TABLE 30 FRANCE: MOBILE VOIP MARKET, BY OS TYPE, 2020-2027 (USD MILLION)
TABLE 31 FRANCE: MOBILE VOIP MARKET, BY USER TYPE, 2020-2027 (USD MILLION)
TABLE 32 REST OF EUROPE: MOBILE VOIP MARKET, BY SERVICES, 2020-2027 (USD MILLION)
TABLE 33 REST OF EUROPE: MOBILE VOIP MARKET, BY OS TYPE, 2020-2027 (USD MILLION)
TABLE 34 REST OF EUROPE: MOBILE VOIP MARKET, BY USER TYPE, 2020-2027 (USD MILLION)
TABLE 35 ASIA-PACIFIC: MOBILE VOIP MARKET, BY COUNTRY, 2020-2027 (USD MILLION)
TABLE 36 ASIA-PACIFIC: MOBILE VOIP MARKET, BY OS TYPE, 2020-2027 (USD MILLION)
TABLE 37 ASIA-PACIFIC: MOBILE VOIP MARKET, BY SERVICES, 2020-2027 (USD MILLION)
TABLE 38 ASIA-PACIFIC: MOBILE VOIP MARKET, BY USER TYPE, 2020-2027 (USD MILLION)
TABLE 39 CHINA: MOBILE VOIP MARKET, BY SERVICES, 2020-2027 (USD MILLION)
TABLE 40 CHINA: MOBILE VOIP MARKET, BY OS TYPE, 2020-2027 (USD MILLION)
TABLE 41 CHINA: MOBILE VOIP MARKET, BY USER TYPE, 2020-2027 (USD MILLION)
TABLE 42 INDIA: MOBILE VOIP MARKET, BY SERVICES, 2020-2027 (USD MILLION)
TABLE 43 INDIA: MOBILE VOIP MARKET, BY OS TYPE, 2020-2027 (USD MILLION)
TABLE 44 INDIA: MOBILE VOIP MARKET, BY USER TYPE, 2020-2027 (USD MILLION)
TABLE 45 JAPAN: MOBILE VOIP MARKET, BY SERVICES, 2020-2027 (USD MILLION)
TABLE 46 JAPAN: MOBILE VOIP MARKET, BY OS TYPE, 2020-2027 (USD MILLION)
TABLE 60: JAPAN: MOBILE VOIP MARKET, BY USER TYPE, 2020-2027 (USD MILLION)
TABLE 62: REST OF ASIA-PACIFIC: MOBILE VOIP MARKET, BY SERVICES, 2020-2027 (USD MILLION)
TABLE 63: REST OF ASIA-PACIFIC: MOBILE VOIP MARKET, BY OS TYPE, 2020-2027 (USD MILLION)
TABLE 64: REST OF ASIA-PACIFIC: MOBILE VOIP MARKET, BY USER TYPE, 2020-2027 (USD MILLION)
TABLE 66: MIDDLE EAST AND AFRICA: MOBILE VOIP MARKET, BY SERVICES, 2020-2027 (USD MILLION)
TABLE 67: MIDDLE EAST AND AFRICA: MOBILE VOIP MARKET, BY OS TYPE, 2020-2027 (USD MILLION)
TABLE 68: MIDDLE EAST AND AFRICA: MOBILE VOIP MARKET, BY USER TYPE, 2020-2027 (USD MILLION)
TABLE 70: SOUTH AMERICA: MOBILE VOIP MARKET, BY SERVICES, 2020-2027 (USD MILLION)
TABLE 71: SOUTH AMERICA: MOBILE VOIP MARKET, BY OS TYPE, 2020-2027 (USD MILLION)
TABLE 72: SOUTH AMERICA: MOBILE VOIP MARKET, BY USER TYPE, 2020-2027 (USD MILLION)
โ
LIST OF FIGURES
FIGURE 1 MARKET SYNOPSIS
FIGURE 2 RESEARCH PROCESS OF MRFR
FIGURE 3 TOP DOWN & BOTTOM-UP APPROACH
FIGURE 4 GLOBAL MOBILE VOIP MARKET, BY SERVICES, 2020-2027 (USD MILLION)
FIGURE 5 GLOBAL MOBILE VOIP MARKET, BY OS TYPE, 2020-2027 (USD MILLION)
FIGURE 6 GLOBAL MOBILE VOIP MARKET, BY USER TYPE, 2020-2027 (USD MILLION)
FIGURE 8 GLOBAL MOBILE VOIP MARKET, BY REGION, 2020-2027 (USD MILLION)
FIGURE 10 NORTH AMERICA: MOBILE VOIP MARKET, BY COUNTRY, 2020-2027 (USD MILLION)
FIGURE 11 NORTH AMERICA: MOBILE VOIP MARKET, BY SERVICES, 2020-2027 (USD MILLION)
FIGURE 12 NORTH AMERICA: MOBILE VOIP MARKET, BY OS TYPE, 2020-2027 (USD MILLION)
FIGURE 13 NORTH AMERICA: MOBILE VOIP MARKET, BY USER TYPE, 2020-2027 (USD MILLION)
FIGURE 15 EUROPE: MOBILE VOIP MARKET, BY COUNTRY, 2020-2027 (USD MILLION)
FIGURE 16 EUROPE: MOBILE VOIP MARKET, BY SERVICES, 2020-2027 (USD MILLION)
FIGURE 17 EUROPE: MOBILE VOIP MARKET, BY OS TYPE, 2020-2027 (USD MILLION)
FIGURE 18 EUROPE: MOBILE VOIP MARKET, BY USER TYPE, 2020-2027 (USD MILLION)
FIGURE 20 ASIA-PACIFIC: MOBILE VOIP MARKET, BY COUNTRY, 2020-2027 (USD MILLION)
FIGURE 21 ASIA-PACIFIC: MOBILE VOIP MARKET, BY SERVICES, 2020-2027 (USD MILLION)
FIGURE 22 ASIA-PACIFIC: MOBILE VOIP MARKET, BY OS TYPE, 2020-2027 (USD MILLION)
FIGURE 23 ASIA-PACIFIC: MOBILE VOIP MARKET, BY USER TYPE, 2020-2027 (USD MILLION)
FIGURE 25 MIDDLE EAST & AFRICA: MOBILE VOIP MARKET, BY SERVICES, 2020-2027 (USD MILLION)
FIGURE 26 MIDDLE EAST AND AFRICA: MOBILE VOIP MARKET, BY OS TYPE, 2020-2027 (USD MILLION)
FIGURE 27 MIDDLE EAST & AFRICA: MOBILE VOIP MARKET, BY USER TYPE, 2020-2027 (USD MILLION)
FIGURE 29 SOUTH AMERICA: MOBILE VOIP MARKET, BY SERVICES, 2020-2027 (USD MILLION)
FIGURE 30 SOUTH AMERICA: MOBILE VOIP MARKET, BY OS TYPE, 2020-2027 (USD MILLION)
FIGURE 31 SOUTH AMERICA: MOBILE VOIP MARKET, BY USER TYPE, 2020-2027 (USD MILLION)
$58.21 Billion
12.2%
North America
2020-2027
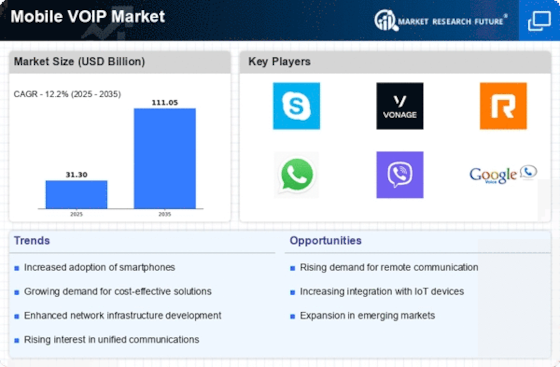
Mobile VOIP Market is expected to expand at 12.2% CAGR, to reach USD 58.21 Billion in 2025 during the forecast period.
Mobile VOIP is an efficient and low-cost way to communicate via mobile devices including smartphones and tablets. Mobile VOIP works with mobile devices’ 3G, 4G, GSM or any other internet service and enables them to communicate efficiently. With the help of mobile VOIP, users can benefit from lower cost when calling, texting or video conferencing. Digital data transmission via VOIP is much faster as digital data is spread over various packets, each packet traveling through the fastest route. Users of mobile VOIP can take the benefit of nominal roaming charges, unlimited messaging, and low incoming call charges among others. Users can use mobile VOIP service by installing mobile VOIP software. These are essentially apps offered by VOIP phone service providers. Mobile VOIP is not only beneficial for individual customers, it also benefits enterprises across varied industry verticals. Businesses can save on money and can increase overall communication efficiency with the help of mobile VOIP services. VOIP apps are available for various operating systems (OS) including Android, iOS, and Windows among others. Enterprises of all sizes are continuously looking for Mobile VOIP solutions that can help organizations in overcoming various IT complexity.
There are a number of mobile VOIP providers operating in the market, who have been offering services to both the individual customers and enterprises. They are also extending their services to offer OTT apps for their customers. OTT apps refer to “over the top” apps and services including WhatsApp, Viber, and Voxox that allow customers to communicate via text, call, and video as well as share files. These providers are also offering value-added services scheduled pre-type messaging services wherein the users can schedule their text messages. Nowadays, some providers are also offering features where users can hide chat and can lock and unlock hidden chat through various means like a password or fingerprint. This feature is highly beneficial for enterprise communication, who can easily prevent sensitive content from unlawful access. Providers like Viber offer such value-added services. Other value-added services include removing spam messages while messaging, support of multiple languages, message searching, and file compression among others.
The mobile VOIP market is driven by strong penetration of the Internet and smartphone as well as the growing trend of BYOD among enterprises. Also, due to lower call rates and seamless communication, the use of mobile VOIP services is significantly increasing.
Segmentation
The Global Mobile VOIP Market has been segmented on the basis of Type, Service Type, Organization Size, Vertical and Region.
Based on the service type, the mobile VOIP market has been segmented into voice, video, instant messaging. Voice service accounted for the largest share in the year 2018. However, video service is expected to grow at the highest CAGR. Video services also include video conferencing and collaboration, which is expected to significantly increase its adoption among enterprises.
Based on OS type, the mobile VOIP market has been divided into Android, iOS, Windows, and others. The Android segment occupied the largest share in the market in the year 2018. The reason for the same is large number of android smartphone users across the globe.
Based on user type, the mobile VOIP market has been segmented into enterprises and individuals. Enterprise segment is expected to hold the larger market share. Growing need to have a cost-effective and smooth communication among enterprises is expected to drive the mobile VOIP service among them in the coming years.
Regional Analysis
Geographically, the Global Mobile VOIP Market has been segmented into Asia-Pacific, North America, Europe, the Middle East & Africa, and South America.
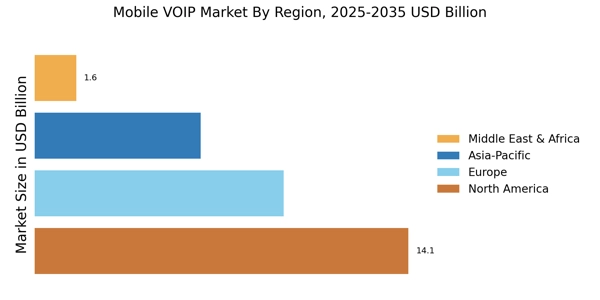
North America leads the market in terms of market share in the mobile VOIP market. Some of the factors that are responsible for the growth of the mobile VOIP market include increasing use of such services among individuals in various countries of North America including the US and Canada.
Europe has occupied the second position in the mobile VOIP market. Europe has been segmented into the UK, Germany, France, Spain, Italy, and the rest of Europe. According to the MRFR analysis, the UK is expected to gain the highest market share, followed by Germany and France.
Companies Covered
Key players of the Global Mobile VOIP Market are 3CX, Vonage, Microsoft Corporation, Facebook Inc., Rebtel, CommPeak Limited, 8x8, Inc., Nextiva, Phone Power, Tata Communications, VoIP Office, RingCentral, Inc., and Junction Networks
Key Developments
Key questions addressed by the report
Report Attribute/Metric | Details |
---|---|
Market Size | USD 58.21 Billion |
CAGR | CAGR 12.2% |
Base Year | 2019 |
Forecast Period | 2020-2027 |
Historical Data | 2018 |
Forecast Units | Value (USD Billion) |
Report Coverage | Revenue Forecast, Competitive Landscape, Growth Factors, and Trends |
Segments Covered | Type |
Geographies Covered | North America, Europe, Asia-Pacific |
Key Vendors | 3cx Facebook Inc. Apple Inc. Google Inc. Microsoft Corporation Skype StarSSIP Ltd Talk 360 Vonage Holdings Corporation TATA Communications Ltd |
Key Market Opportunities | |
Key Market Drivers | Growing trend of BYOD among enterprises |
Frequently Asked Questions (FAQ) :
The global mobile VOIP market is slated to expand at a substantial CAGR of 12.2% over the review period (2019 to 2025).
The global mobile VOIP market is slated to generate revenue of up to USD 58.21 billion by 2025.
The key market players of the global mobile VOIP market observing a vast scope of opportunities due the increasing deployment of 4g, and the growing investment by telecommunication operators.
The regional analysis of the global mobile VOIP market has been conducted in five major regions, namely, North America, Asia Pacific, Europe, Latin America, and the Middle East and Africa.
The segmentation of the global mobile VOIP market is done on the basis of service type, organization size, vertical OS type.