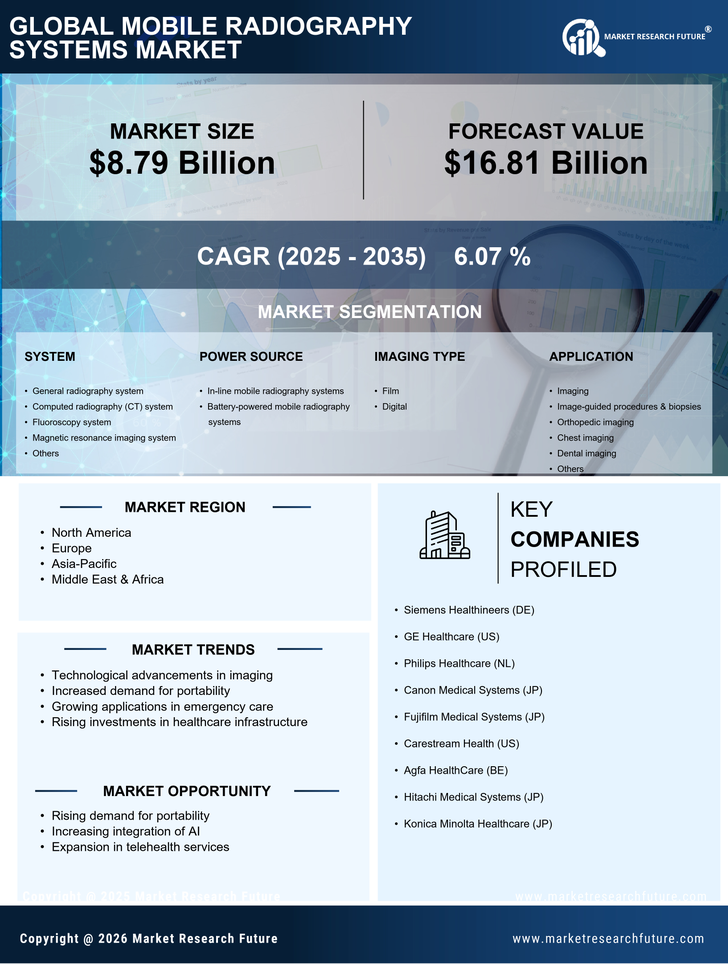
Certified Global Research Member
Isomar fd.webp Wcrc 57.webp
Key Questions Answered
  • Global Market Outlook
  • In-depth analysis of global and regional trends
  • Analyze and identify the major players in the market, their market share, key developments, etc.
  • To understand the capability of the major players based on products offered, financials, and strategies.
  • Identify disrupting products, companies, and trends.
  • To identify opportunities in the market.
  • Analyze the key challenges in the market.
  • Analyze the regional penetration of players, products, and services in the market.
  • Comparison of major playersโ€™ financial performance.
  • Evaluate strategies adopted by major players.
  • Recommendations
Why Choose Market Research Future?
  • Vigorous research methodologies for specific market.
  • Knowledge partners across the globe
  • Large network of partner consultants.
  • Ever-increasing/ Escalating data base with quarterly monitoring of various markets
  • Trusted by fortune 500 companies/startups/ universities/organizations
  • Large database of 5000+ markets reports.
  • Effective and prompt pre- and post-sales support.

Mobile Radiography Systems Market Research Report, by Type (In-Line, Battery-Powered), Imaging (Film, Computed Radiography, Direct Digital), Application (Orthopedic Imaging, Chest Imaging, Dental Imaging), End User, and Region โ€” Forecast till 2030


ID: MRFR/HC/6101-HCR | 110 Pages | Author: Rahul Gotadki| May 2024
Leading companies partner with us for data-driven Insights
client_1 client_2 client_3 client_4 client_5 client_6 client_7 client_8 client_9 client_10
Please fill in Business Email for Quick Response

TABLE OF CONTENT

Chapter 1. Report Prologue

Chapter 2. Market Introduction

2.1 Definition

2.2 Scope of the Study

2.2.1 Research Objective

2.2.2 Assumptions

2.2.3 Limitations

Chapter 3. Research Methodology

3.1 Introduction

3.2 Primary Research

3.3 Secondary Research

3.4 Market Size Estimation

Chapter 4. Market Dynamics

4.1 Drivers

4.2 Restraints

4.3 Opportunities

4.4 Power Source Trends & Assessment

Chapter 5. Market Factor Analysis

5.1 Porterโ€™s Five Forces Analysis

5.1.1 Bargaining Power of Suppliers

5.1.2 Bargaining Power of Buyers

5.1.3 Threat of New Entrants

5.1.4 Threat of Substitutes

5.1.5 Intensity of Rivalry

5.2 Value Chain Analysis

5.3 Pricing Analysis

Chapter 6. Global Mobile Radiography Systems Market, by System

6.1 Introduction

6.2 General radiography system

6.3 Computed radiography (CT) system

6.4 Fluoroscopy system

6.5 Magnetic resonance imaging system

6.6 Others

Chapter 7. Global Mobile Radiography Systems Market, by Power Source

7.1 Introduction

7.2 In-line mobile radiography systems

7.3 Battery-powered mobile radiography systems

Chapter 8. Global Mobile Radiography Systems Market, by Imaging Type

8.1 Introduction

8.2 Film

8.3 Digital

Chapter 9. Global Mobile Radiography Systems Market, by Application

9.1 Introduction

9.2 Imaging

9.2.1 Orthopedic imaging

9.2.2 Chest imaging

9.2.3 Dental imaging

9.2.4 Others

9.3 Image-guided procedures & biopsies

Chapter 10. Global Mobile Radiography Systems Market, by End User

10.1 Introduction

10.2 Hospitals & Clinics

10.3 Academic & Medical Research Institutes

10.4 Diagnostic Centers

Chapter 11. Global Mobile Radiography Systems Market, by Region

11.1 Introduction

11.2 America

11.2.1 North America

11.2.1.1 US

11.2.1.2 Canada

11.2.2 South America

11.3 Europe

11.3.1 Western Europe

11.3.1.1 Germany

11.3.1.2 France

11.3.1.3 Italy

11.3.1.4 Spain

11.3.1.5 UK

11.3.1.6 Rest of Western Europe

11.3.2 Eastern Europe

11.4 Asia-Pacific

11.4.1 Japan

11.4.2 China

11.4.3 India

11.4.4 Australia

11.4.5 Republic of Korea

11.4.6 Rest of Asia-Pacific

11.5 Middle East & Africa

11.5.1 United Arab Emirates

11.5.2 Saudi Arabia

11.5.3 Oman

11.5.4 Kuwait

11.5.5 Qatar

11.5.6 Rest of the Middle East & Africa

Chapter 12. Company Landscape

12.1 Introduction

12.2 Market Share Analysis

12.3 Key Development & Strategies

12.3.1 Key Developments

Chapter 13 Company Profiles

13.1 AGFA Healthcare

13.1.1 Company Overview

13.1.2 Type Overview

13.1.3 Financials

13.2.4 Key Developments

13.1.5 SWOT Analysis

13.2 BMI Biomedical International

13.2.1 Company Overview

13.2.2 Type Overview

13.2.3 Financial Overview

13.2.4 Key Developments

13.2.5 SWOT Analysis

13.3 CAT Medical

13.3.1 Company Overview

13.3.2 Type Overview

13.3.3 Financial Overview

13.3.4 Key Development

13.3.5 SWOT Analysis

13.4 DMS Imaging

13.4.1 Company Overview

13.4.2 Type/Business Segment Overview

13.4.3 Financial Overview

13.4.4 Key Development

13.4.5 SWOT Analysis

13.5 GE Healthcare

13.5.1 Company Overview

13.5.2 Type Overview

13.5.3 Financial overview

13.5.4 Key Developments

13.5.5 SWOT Analysis

13.6 Idetec Medical Imaging

13.6.1 Company Overview

13.6.2 Type Overview

13.6.3 Financial Overview

13.6.4 Key Developments

13.6.5 SWOT Analysis

13.7 Innomed Medical Developing and Manufacturing

13.7.1 Overview

13.7.2 Type Overview

13.7.3 Financials

13.7.4 Key Developments

13.7.5 SWOT Analysis

13.8 Konica Minolta

13.8.1 Overview

13.8.2 Type Overview

13.8.3 Financials

13.8.4 Key Developments

13.8.5 SWOT Analysis

13.9 Philips Healthcare

13.9.1 Overview

13.9.2 Type Overview

13.9.3 Financials

13.9.4 Key Developments

13.9.5 SWOT Analysis

13.10 Shimadzu

13.10.1 Overview

13.10.2 Type Overview

13.10.3 Financials

13.10.4 Key Developments

13.10.5 SWOT Analysis

13.11 Siemens AG

13.11.1 Overview

13.11.2 Type Overview

13.11.3 Financials

13.11.4 Key Developments

13.11.5 SWOT Analysis

13.12 Others

Chapter 14 Appendix

LIST OF TABLES

Table 1 Global Mobile Radiography Systems Market Industry Synopsis, 2020โ€“2027

Table 2 Global Mobile Radiography Systems Market Estimates & Forecast, 2020โ€“2027, (USD Million)

Table 3 Global Mobile Radiography Systems Market, by Region, 2020โ€“2027, (USD Million)

Table 4 Global Mobile Radiography Systems Market, by System, 2020โ€“2027, (USD Million)

Table 5 Global Mobile Radiography Systems Market, by Power Source, 2020โ€“2027, (USD Million)

Table 6 Global Mobile Radiography Systems Market, by Imaging Type, 2020โ€“2027, (USD Million)

Table 7 Global Mobile Radiography Systems Market, by Application, 2020โ€“2027, (USD Million)

Table 8 Global Mobile Radiography Systems Market, by End User, 2020โ€“2027, (USD Million)

Table 9 North America: Mobile Radiography Systems Market, by System, 2020โ€“2027, (USD Million)

Table 10 North America: Mobile Radiography Systems Market, by Power Source, 2020โ€“2027, (USD Million)

Table 11 North America: Mobile Radiography Systems Market, by Imaging Type, 2020โ€“2027, (USD Million)

Table 12 North America: Mobile Radiography Systems Market, by Application, 2020โ€“2027, (USD Million)

Table 13 North America: Mobile Radiography Systems Market, by End User, 2020โ€“2027, (USD Million)

Table 14 US: Mobile Radiography Systems Market, by System, 2020โ€“2027, (USD Million)

Table 15 US: Mobile Radiography Systems Market, by Power Source, 2020โ€“2027, (USD Million)

Table 16 US: Mobile Radiography Systems Market, by Imaging Type, 2020โ€“2027, (USD Million)

Table 17 US: Mobile Radiography Systems Market, by Application, 2020โ€“2027, (USD Million)

Table 18 US: Mobile Radiography Systems Market, by End User, 2020โ€“2027, (USD Million)

Table 19 Canada: Mobile Radiography Systems Market, by System, 2020โ€“2027, (USD Million)

Table 20 Canada: Mobile Radiography Systems Market, by Power Source, 2020โ€“2027, (USD Million)

Table 21 Canada: Mobile Radiography Systems Market, by Imaging Type, 2020โ€“2027, (USD Million)

Table 22 Canada: Mobile Radiography Systems Market, by Application, 2020โ€“2027, (USD Million)

Table 23 Canada: Mobile Radiography Systems Market, by End User, 2020โ€“2027, (USD Million)

Table 24 Latin America: Mobile Radiography Systems Market, by System, 2020โ€“2027, (USD Million)

Table 25 Latin America: Mobile Radiography Systems Market, by Power Source, 2020โ€“2027, (USD Million)

Table 26 Latin America: Mobile Radiography Systems Market, by Imaging Type, 2020โ€“2027, (USD Million)

Table 27 Latin America: Mobile Radiography Systems Market, by Application, 2020โ€“2027, (USD Million)

Table 28 Latin America: Mobile Radiography Systems Market, by End User, 2020โ€“2027, (USD Million)

Table 29 Europe: Mobile Radiography Systems Market, Type, 2020โ€“2027, (USD Million)

Table 30 Europe: Mobile Radiography Systems Market, by Power Source, 2020โ€“2027, (USD Million)

Table 31 Europe: Mobile Radiography Systems Market, by Imaging Type, 2020โ€“2027, (USD Million)

Table 32 Europe: Mobile Radiography Systems Market, by Application, 2020โ€“2027, (USD Million)

Table 33 Europe: Mobile Radiography Systems Market, by End User, 2020โ€“2027, (USD Million)

Table 34 Western Europe: Mobile Radiography Systems Market, by System, 2020โ€“2027, (USD Million)

Table 35 Western Europe: Mobile Radiography Systems Market, by Power Source, 2020โ€“2027, (USD Million)

Table 36 Western Europe: Mobile Radiography Systems Market, by Imaging Type, 2020โ€“2027, (USD Million)

Table 37 Western Europe: Mobile Radiography Systems Market, by Application, 2020โ€“2027, (USD Million)

Table 38 Western Europe: Mobile Radiography Systems Market, by End User, 2020โ€“2027, (USD Million)

Table 39 Eastern Europe: Mobile Radiography Systems Market, by System, 2020โ€“2027, (USD Million)

Table 40 Eastern Europe: Mobile Radiography Systems Market, by Power Source, 2020โ€“2027, (USD Million)

Table 41 Eastern Europe: Mobile Radiography Systems Market, by Imaging Type, 2020โ€“2027, (USD Million)

Table 42 Eastern Europe: Mobile Radiography Systems Market, by Application, 2020โ€“2027, (USD Million)

Table 43 Eastern Europe: Mobile Radiography Systems Market, by End User, 2020โ€“2027, (USD Million)

Table 44 Asia-Pacific: Mobile Radiography Systems Market, by System, 2020โ€“2027, (USD Million)

Table 45 Asia-Pacific: Mobile Radiography Systems Market, by Power Source, 2020โ€“2027, (USD Million)

Table 46 Asia-Pacific: Mobile Radiography Systems Market, by Imaging Type, 2020โ€“2027, (USD Million)

Table 47 Asia-Pacific: Mobile Radiography Systems Market, by Application, 2020โ€“2027, (USD Million)

Table 48 Asia-Pacific: Mobile Radiography Systems Market, by End User, 2020โ€“2027, (USD Million)

Table 49 Middle East & Africa: Mobile Radiography Systems Market, by System, 2020โ€“2027, (USD Million)

Table 50 Middle East & Africa: Mobile Radiography Systems Market, by Power Source, 2020โ€“2027, (USD Million)

Table 51 Middle East & Africa: Mobile Radiography Systems Market, by Imaging Type, 2020โ€“2027, (USD Million)

Table 52 Middle East & Africa: Mobile Radiography Systems Market, by Application, 2020โ€“2027, (USD Million)

Table 53 Middle East & Africa: Mobile Radiography Systems Market, by End User, 2020โ€“2027, (USD Million)

LIST OF FIGURES

Figure 1 Research Process

Figure 2 Segmentation for the Global Mobile Radiography Systems Market

Figure 3 Market Dynamics for the Global Mobile Radiography Systems Market

Figure 4 Global Mobile Radiography Systems Market Share, by System 2020

Figure 5 Global Mobile Radiography Systems Market Share, by Power Source, 2020

Figure 6 Global Mobile Radiography Systems Market Share, by Imaging Type, 2020

Figure 7 Global Mobile Radiography Systems Market Share, by Application, 2020

Figure 8 Global Mobile Radiography Systems Market Share, by End User, 2020

Figure 9 Global Mobile Radiography Systems Market Share, by Region, 2020

Figure 10 North America: Mobile Radiography Systems Market Share, by Country, 2020

Figure 11 Europe: Mobile Radiography Systems Market, by Country, 2020

Figure 12 Asia-Pacific: Mobile Radiography Systems Market Share, by Country, 2020

Figure 13 Middle East & Africa: Mobile Radiography Systems Market Share, by Country, 2020

Figure 14 Global Mobile Radiography Systems Market: Company Share Analysis, 2020 (%)

Figure 15 AGFA Healthcare: Key Financials

Figure 16 AGFA Healthcare: Segmental Revenue

Figure 17 AGFA Healthcare: Geographical Revenue

Figure 18 BMI Biomedical International: Key Financials

Figure 19 BMI Biomedical International: Segmental Revenue

Figure 20 BMI Biomedical International: Geographical Revenue

Figure 21 CAT Medical: Key Financials

Figure 22 CAT Medical: Segmental Revenue

Figure 23 CAT Medical: Geographical Revenue

Figure 24 DMS Imaging: Key Financials

Figure 25 DMS Imaging: Segmental Revenue

Figure 26 DMS Imaging: Geographical Revenue

Figure 27 GE Healthcare: Key Financials

Figure 28 GE Healthcare: Segmental Revenue

Figure 29 GE Healthcare: Geographical Revenue

Figure 30 Idetec Medical Imaging: Key Financials

Figure 31 Idetec Medical Imaging: Segmental Revenue

Figure 32 Idetec Medical Imaging: Geographical Revenue

Figure 33 Innomed Medical Developing and Manufacturing: Key Financials

Figure 34 Innomed Medical Developing and Manufacturing: Segmental Revenue

Figure 35 Innomed Medical Developing and Manufacturing: Geographical Revenue

Figure 36 Konica Minolta: Key Financials

Figure 37 Konica Minolta: Segmental Revenue

Figure 38 Konica Minolta: Geographical Revenue

Figure 39 Philips Healthcare: Key Financials

Figure 40 Philips Healthcare: Segmental Revenue

Figure 41 Philips Healthcare: Geographical Revenue

Figure 42 Shimadzu: Key Financials

Figure 43 Shimadzu: Segmental Revenue

Figure 44 Shimadzu: Geographical Revenue

Figure 45 Siemens AG: Key Financials

Figure 46 Siemens AG: Segmental Revenue

Figure 47 Siemens AG: Geographical Revenue

Purchase Option
Single User $ 4,950
Multiuser License $ 5,950
Enterprise User $ 7,250
Compare Licenses
Tailored for You
  • Dedicated Research on any specifics segment or region.
  • Focused Research on specific players in the market.
  • Custom Report based only on your requirements.
  • Flexibility to add or subtract any chapter in the study.
  • Historic data from 2014 and forecasts outlook till 2040.
  • Flexibility of providing data/insights in formats (PDF, PPT, Excel).
  • Provide cross segmentation in applicable scenario/markets.