ID: MRFR/A&D/4939-HCR | February 2021 | Region: Global | 100 pages
Market Scenario
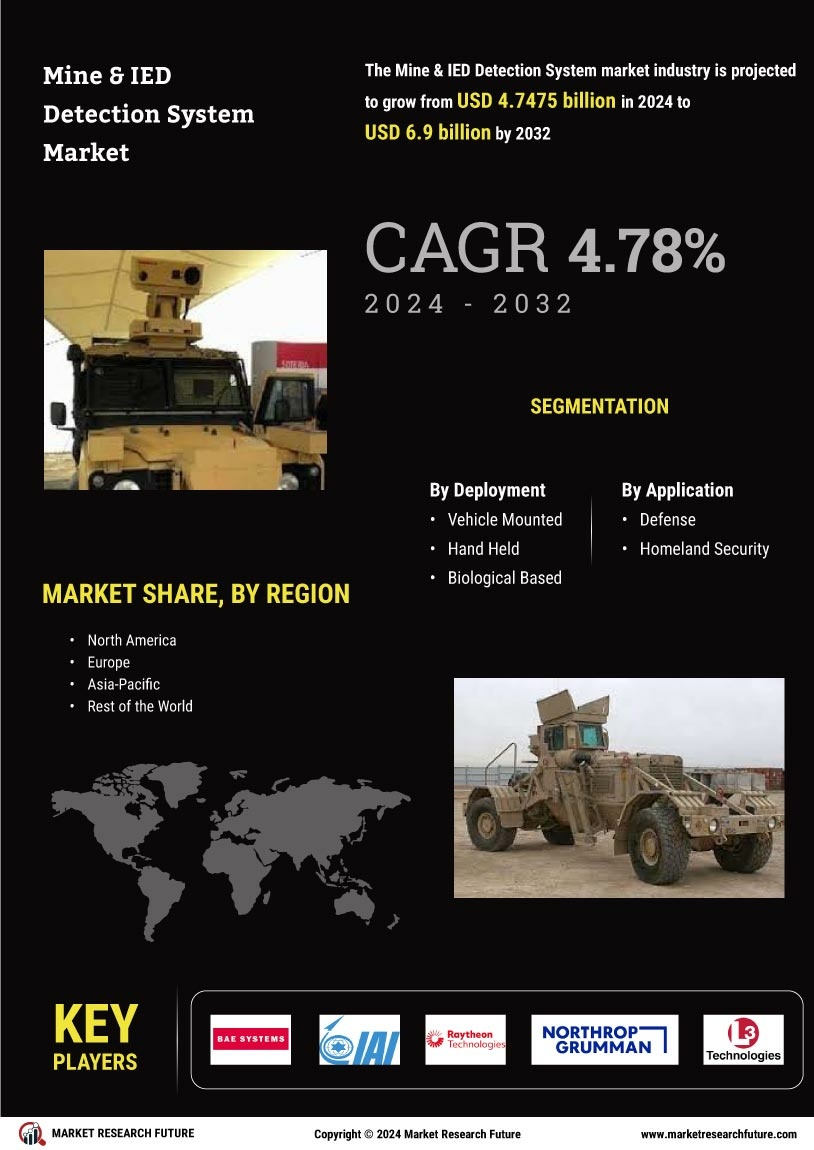
The mine & IED detection system market is expected to grow at a significant pace during the forecast period due to military land clearance operations and advancement in sensor technology in the defense sector. With the rise in security threats and border disputes, there has been increased usage of mine & IED detection system for rapid area clearance and detecting both Improvised Explosive Devices (IEDs) and traditional Anti-Tank (AT) mines. A variety of technologies is used to detect landmines and IEDs, including acoustic sensors, animals and biological detection systems, chemical sensors, electromagnetic sensors, and hyperspectral sensor analysis, radar technology, ground penetrating radar, lidar and electro-optical sensors, magnetic signatures, nuclear sensors, optical sensors, seismic acoustic sensors, and thermal detection. As a result, it is estimated that by the end of the forecast period, usage of mine & IED detection system will rise significantly.
Meanwhile, in 2013, BAE Systems signed a contract with the U.S. Navy to provide critical mine detection sensor prototype, . However, high cost and declining defense expenses are restricting the usage of mine & IED detection system.
The global mine & IED detection system market is segmented into deployment, application, detection capability, equipment, and region. On the basis of deployment, the market has been segmented into vehicle mounted, hand held, and biological based. Since the vehicle mounted detection system is much suited for high-threat search operation, the segment is expected to grow at the highest rate during the forecast period. For instance, in 2012, NIITEK signed a contract with the Australian Army to provide Husky Mounted Detection Systems (HMDS).
By application, the market has been segmented into defense and homeland security. The defense sector in different countries is the major end-user of different types of mine and IED detection equipment and devices as they continuously face threats of IED blasts during cross-country operations.
By detection capability, the market has been segmented into above surface detection system and underground mine & IED detection system. The above surface detection system segment is expected to grow at the highest rate during the forecast period, as there has been a high adoption rate of this technology in mine detection. For instance, in 2016, the U.S. army signed a contract with Israel Aerospace Industries (IAI) to provide a vehicle mounted integrated suite of sensors and above surface detection system technology to detect mines and IEDs. Such developments would further fuel the market growth.
By equipment, the market has been segmented into sensor based, radar based, laser based, and others. The laser based segment of the market is expected to grow at the highest rate during the forecast period.
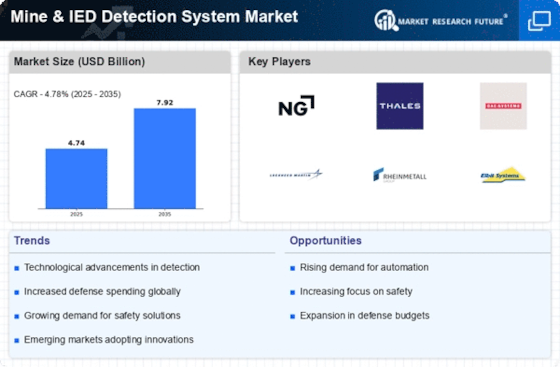
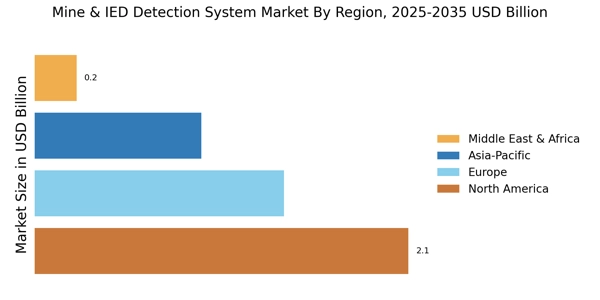
In terms of region, the market in North America is expected to witness the highest growth during the forecast period. The continuous demand for mine and IED detection system and equipment by the U.S. military to tackle conflicts in the Middle East and Asia-Pacific is the major reason for the high growth of this market. Similarly, in Asia-Pacific, the increased investments in the development of mine and IED detection equipment and devices are expected to contribute to the growth of the regional market. Therefore, the global mine & IED detection system market is estimated to witness a CAGR of approximately 4% during the forecast period from 2018 to 2023.
Mine & IED Detection System Market, by Segmentation
Key Players
The key players in the mine & IED detection system market BAE Systems Plc (U.K), Israel Aerospace Industries (Israel), Raytheon (U.S.), Northrop Grumman Corporation (U.S.), L-3 Communications Holdings Inc. (U.S.), Harris Corporation (U.S.), General Dynamics Corporation (U.S.), Schiebel Gmbh (Vienna), DCD Group (South Africa), and Chemring Group Plc (U.K).
The report on the Mine & IED Detection System market by Market Research Future covers extensive primary research. This is accompanied by a detailed analysis of the qualitative and quantitative aspects by various industry experts and key opinion leaders to gain deeper insights into the market and industry performance. The report gives a clear picture of the current market scenario, which includes the historical and forecast market size, in terms of value and volume, and the technological, macroeconomic, and governing factors of the market. The report provides comprehensive information about the strategies of the top companies in the industry, along with a broad study of the different market segments and regions.
Table of Contents
1 Executive Summary
2 Scope of the Report
2.1 Market Definition
2.2 Scope of the Study
2.2.1 Definition
2.2.2 Research Objectives
2.2.3 Assumptions
2.2.4 Limitations
2.3 Research Process
2.3.1 Primary Research
2.3.2 Secondary Research
2.4 Market Size Estimation
2.5 Forecast Model
3 Market Landscape
3.1 Porter’s Five Forces Analysis
3.1.1 Threat of New Entrants
3.1.2 Bargaining Power of Buyers
3.1.3 Threat of Substitutes
3.1.4 Segment Rivalry
3.1.5 Bargaining Power of Buyers
3.2 Value Chain/Supply Chain Analysis
4 Market Dynamics
4.1 Introduction
4.2 Market Drivers
4.3 Market Restraints
4.4 Market Opportunities
4.5 Market Trends
5 Mine & IED Detection System Market, by Deployment
5.1 Introduction
5.2 Vehicle Mounted
5.2.1 Market Estimates & Forecast, 2018–2023
5.2.2 Market Estimates & Forecast, by Region, 2018–2023
5.3 Hand Held
5.3.1 Market Estimates & Forecast, 2018–2023
5.3.2 Market Estimates & Forecast, by Region, 2018–2023
5.3 Biological Based
5.3.1 Market Estimates & Forecast, 3018–3033
5.3.3 Market Estimates & Forecast, by Region, 3018–3033
6 Mine & IED Detection System Market, by Detection Capability
6.1 Introduction
6.2 Above Surface
6.2.1 Market Estimates & Forecast, 2018–2023
6.2.2 Market Estimates & Forecast, by Region, 2018–2023
6.3 Underground
6.3.1 Market Estimates & Forecast, 2018–2023
6.3.2 Market Estimates & Forecast, by Region, 2018–2023
7 Mine & IED Detection System Market, by Application
7.1 Introduction
7.2 Defence
7.2.1 Market Estimates & Forecast, 2018–2023
7.2.2 Market Estimates & Forecast, by Region, 2018–2023
7.3 Homeland Security
7.3.1 Market Estimates & Forecast, 2018–2023
7.3.2 Market Estimates & Forecast, by Region, 2018–2023
8 Mine & IED Detection System Market, by Equipment
8.1 Introduction
8.2 Sensor Based
8.2.1 Market Estimates & Forecast, 2018–2023
8.2.2 Market Estimates & Forecast, by Region, 2018–2023
8.3 Radar Based
8.3.1 Market Estimates & Forecast, 2018–2023
8.3.2 Market Estimates & Forecast, by Region, 2018–2023
8.4 Laser Based
8.4.1 Market Estimates & Forecast, 2018–2023
8.4.2 Market Estimates & Forecast, by Region, 2018–2023
8.5 Others
8.5.1 Market Estimates & Forecast, 2018–2023
8.5.2 Market Estimates & Forecast, by Region, 2018–2023
8 Mine & IED Detection System Market, by Region
8.1 Introduction
8.2 North America
8.2.1 Market Estimates & Forecast, 2018–2023
8.2.2 Market Estimates & Forecast, by Deployment, 2018–2023
8.2.3 Market Estimates & Forecast, by Detection Capability, 2018–2023
8.2.4 Market Estimates & Forecast, by Application, 2018–2023
8.2.5 Market Estimates & Forecast, by Equipment, 2018–2023
8.2.6 US
8.2.6.1 Market Estimates & Forecast, 2018–2023
8.2.6.2 Market Estimates & Forecast, by Deployment, 2018–2023
8.2.6.3 Market Estimates & Forecast, by Detection Capability, 2018–2023
8.2.6.4 Market Estimates & Forecast, by Application, 2018–2023
8.2.6.5 Market Estimates & Forecast, by Equipment, 2018–2023
8.2.6 Canada
8.2.6.1 Market Estimates & Forecast, 2018–2023
8.2.6.2 Market Estimates & Forecast, by Deployment, 2018–2023
8.2.6.3 Market Estimates & Forecast, by Detection Capability, 2018–2023
8.2.6.4 Market Estimates & Forecast, by Application, 2018–2023
8.2.6.5 Market Estimates & Forecast, by Equipment, 2018–2023
8.3 Europe
8.3.1 Market Estimates & Forecast, 2018–2023
8.3.2 Market Estimates & Forecast, by Deployment, 2018–2023
8.3.3 Market Estimates & Forecast, by Detection Capability, 2018–2023
8.3.4 Market Estimates & Forecast, by Application, 2018–2023
8.3.5 Market Estimates & Forecast, by Equipment, 2018–2023
8.3.6 UK
8.3.6.1 Market Estimates & Forecast, 2018–2023
8.3.6.2 Market Estimates & Forecast, by Deployment, 2018–2023
8.3.6.3 Market Estimates & Forecast, by Detection Capability, 2018–2023
8.3.6.4 Market Estimates & Forecast, by Application, 2018–2023
8.3.6.5 Market Estimates & Forecast, by Equipment, 2018–2023
8.3.6 Germany
8.3.6.1 Market Estimates & Forecast, 2015-2023
8.3.6.2 Market Estimates & Forecast, by Deployment, 2015-2023
8.3.6.3 Market Estimates & Forecast, by Detection Capability, 2015-2023
8.3.6.4 Market Estimates & Forecast, by Application, 2018–2023
8.3.6.5 Market Estimates & Forecast, by Equipment, 2018–2023
8.3.7 France
8.3.7.1 Market Estimates & Forecast, 2015-2023
8.3.7.2 Market Estimates & Forecast, by Deployment, 2015-2023
8.3.7.3 Market Estimates & Forecast, by Detection Capability, 2015-2023
8.3.7.4 Market Estimates & Forecast, by Application, 2018–2023
8.3.7.5 Market Estimates & Forecast, by Equipment, 2018–2023
8.3.8 Italy
8.3.8.1 Market Estimates & Forecast, 2018–2023
8.3.8.2 Market Estimates & Forecast, by Deployment, 2018–2023
8.3.8.3 Market Estimates & Forecast, by Detection Capability, 2018–2023
8.3.8.4 Market Estimates & Forecast, by Application, 2018–2023
8.3.8.5 Market Estimates & Forecast, by Equipment, 2018–2023
8.3.9 Rest of Europe
8.3.9.1 Market Estimates & Forecast, 2018–2023
8.3.9.2 Market Estimates & Forecast, by Deployment, 2018–2023
8.3.9.3 Market Estimates & Forecast, by Detection Capability, 2018–2023
8.3.9.4 Market Estimates & Forecast, by Application, 2018–2023
8.3.9.5 Market Estimates & Forecast, by Equipment, 2018–2023
8.4 Asia-Pacific
8.4.1 Market Estimates & Forecast, 2018–2023
8.4.2 Market Estimates & Forecast, by Deployment, 2018–2023
8.4.3 Market Estimates & Forecast, by Detection Capability, 2018–2023
8.4.4 Market Estimates & Forecast, by Application, 2018–2023
8.4.5 Market Estimates & Forecast, by Equipment, 2018–2023
8.4.5 China
8.4.5.1 Market Estimates & Forecast, 2018–2023
8.4.5.2 Market Estimates & Forecast, by Deployment, 2018–2023
8.4.5.3 Market Estimates & Forecast, by Detection Capability, 2018–2023
8.4.5.4 Market Estimates & Forecast, by Application, 2018–2023
8.4.5.5 Market Estimates & Forecast, by Equipment, 2018–2023
8.4.6 Japan
8.4.6.1 Market Estimates & Forecast, 2018–2023
8.4.6.2 Market Estimates & Forecast, by Deployment, 2018–2023
8.4.6.3 Market Estimates & Forecast, by Detection Capability, 2018–2023
8.4.6.4 Market Estimates & Forecast, by Application, 2018–2023
8.4.6.5 Market Estimates & Forecast, by Equipment, 2018–2023
8.4.7 India
8.4.7.1 Market Estimates & Forecast, 2018–2023
8.4.7.2 Market Estimates & Forecast, by Deployment, 2018–2023
8.4.7.3 Market Estimates & Forecast, by Detection Capability, 2018–2023
8.4.7.4 Market Estimates & Forecast, by Application, 2018–2023
8.4.7.5 Market Estimates & Forecast, by Equipment, 2018–2023
8.4.8 Rest of Asia-Pacific
8.4.8.1 Market Estimates & Forecast, 2018–2023
8.4.8.2 Market Estimates & Forecast, by Deployment, 2018–2023
8.4.8.3 Market Estimates & Forecast, by Detection Capability, 2018–2023
8.4.8.4 Market Estimates & Forecast, by Application, 2018–2023
8.4.8.5 Market Estimates & Forecast, by Equipment, 2018–2023
8.5 Middle East & Africa
8.5.1 Market Estimates & Forecast, 2018–2023
8.5.2 Market Estimates & Forecast, by Deployment, 2018–2023
8.5.3 Market Estimates & Forecast, by Detection Capability, 2018–2023
8.5.4 Market Estimates & Forecast, by Application, 2018–2023
8.5.5 Market Estimates & Forecast, by Equipment, 2018–2023
8.6 Latin America
8.6.1 Market Estimates & Forecast, 2018–2023
8.6.2 Market Estimates & Forecast, by Deployment, 2018–2023
8.6.3 Market Estimates & Forecast, by Detection Capability, 2018–2023
8.6.4 Market Estimates & Forecast, by Application, 2018–2023
8.6.5 Market Estimates & Forecast, by Equipment, 2018–2023
9 Competitive Landscape
10 Company Profiles
10.1 BAE Systems Plc
10.1.1 Company Overview
10.1.2 Offering
10.1.3 Financial Overview
10.1.4 Key Developments
10.1.5 Strategy
10.1.6 SWOT Analysis
10.2 Israel Aerospace Industries
10.2.1 Company Overview
10.2.2 Offering
10.2.3 Financial Overview
10.2.4 Key Developments
10.2.5 Strategy
10.2.6 SWOT Analysis
10.3 Raytheon
10.3.1 Company Overview
10.3.2 Offering
10.3.3 Financial Overview
10.3.4 Key Developments
10.3.5 Strategy
10.3.6 SWOT Analysis
10.4 Northrop Grumman Corporation
10.4.1 Company Overview
10.4.2 Offering
10.4.3 Financial Overview
10.4.4 Key Developments
10.4.5 Strategy
10.4.6 SWOT Analysis
10.5 L-3 Communications Holdings Inc.
10.5.1 Company Overview
10.5.2 Offering
10.5.3 Financial Overview
10.5.4 Key Developments
10.5.5 Strategy
10.5.6 SWOT Analysis
10.6 Harris Corporation
10.6.1 Company Overview
10.6.2 Offering
10.6.3 Financial Overview
10.6.4 Key Developments
10.6.6 Strategy
10.6.6 SWOT Analysis
10.7 General Dynamics Corporation
10.7.1 Company Overview
10.7.2 Offering
10.7.3 Financial Overview
10.7.4 Key Developments
10.7.5 Strategy
10.7.7 SWOT Analysis
10.8 Schiebel Gmbh
10.8.1 Company Overview
10.8.2 Offering
10.8.3 Financial Overview
10.8.4 Key Developments
10.8.5 Strategy
10.8.8 SWOT Analysis
10.9 DCD Group
10.9.1 Company Overview
10.9.2 Offering
10.9.3 Financial Overview
10.9.4 Key Developments
10.9.5 Strategy
10.9.9 SWOT Analysis
10.10 Chemring Group Plc
10.10.1 Company Overview
10.10.2 Offering
10.10.3 Financial Overview
10.10.4 Key Developments
10.10.5 Strategy
10.10.6 SWOT Analysis
List of Tables
Table 1 Mine & IED Detection System Market, by Region, 2018–2023
Table 2 North America: Mine & IED Detection System Market, by Country, 2018–2023
Table 3 Europe: Mine & IED Detection System Market, by Country, 2018–2023
Table 4 Asia-Pacific: Mine & IED Detection System Market, by Country, 2018–2023
Table 5 Middle East & Africa: Mine & IED Detection System Market, by Country, 2018–2023
Table 6 Latin America: Mine & IED Detection System Market, by Country, 2018–2023
Table 7 Mine & IED Detection System Market, by Deployment, 2018–2023
Table 8 North America: Mine & IED Detection System Market, by Deployment, 2018–2023
Table 9 Europe: Mine & IED Detection System Market, by Deployment, 2018–2023
Table 10 Asia-Pacific: Mine & IED Detection System Market, by Deployment, 2018–2023
Table 11 Middle East & Africa: Mine & IED Detection System Market, by Deployment, 2018–2023
Table 12 Latin America: Mine & IED Detection System Market, by Deployment, 2018–2023
Table 13 Mine & IED Detection System Market, by Detection Capability, 2018–2023
Table 14 North America: Mine & IED Detection System Market, by Detection Capability, 2018–2023
Table 15 Europe: Mine & IED Detection System Market, by Detection Capability, 2018–2023
Table 16 Asia-Pacific: Mine & IED Detection System Market, by Detection Capability, 2018–2023
Table 17 Middle East & Africa: Mine & IED Detection System Market, by Detection Capability, 2018–2023
Table 18 Latin America: Mine & IED Detection System Market, by Detection Capability, 2018–2023
Table 19 Mine & IED Detection System Market, by Applications, 2018–2023
Table 20 North America: Mine & IED Detection System Market, by Applications, 2018–2023
Table 21 Europe: Mine & IED Detection System Market, by Applications, 2018–2023
Table 22 Asia-Pacific: Mine & IED Detection System Market, by Applications, 2018–2023
Table 23 Middle East & Africa: Mine & IED Detection System Market, by Applications, 2018–2023
Table 24 Latin America: Mine & IED Detection System Market, by Applications, 2018–2023
Table 25 Mine & IED Detection System Market, by Equipment, 2018–2023
Table 26 North America: Mine & IED Detection System Market, by Equipment, 2018–2023
Table 27 Europe: Mine & IED Detection System Market, by Equipment, 2018–2023
Table 28 Asia-Pacific: Mine & IED Detection System Market, by Equipment, 2018–2023
Table 29 Middle East & Africa: Mine & IED Detection System Market, by Equipment, 2018–2023
Table 30 Latin America: Mine & IED Detection System Market, by Equipment, 2018–2023
List of Figures
FIGURE 1 Research Process of MRFR
FIGURE 2 Top-Down & Bottom-Up Approaches
FIGURE 3 Market Dynamics
FIGURE 4 Impact Analysis: Market Drivers
FIGURE 5 Impact Analysis: Market Restraints
FIGURE 6 Porter’s Five Forces Analysis
FIGURE 7 Value Chain Analysis
FIGURE 8 Mine & IED Detection System Market Share, by Deployment, 2018 (%)
FIGURE 9 Mine & IED Detection System Market, by Deployment, 2018–2023 (USD MILLION)
FIGURE 10 Mine & IED Detection System Market Share, by Detection Capability, 2018 (%)
FIGURE 11 Mine & IED Detection System Market, by Detection Capability, 2018–2023 (USD MILLION)
FIGURE 12 Mine & IED Detection System Market Share, by Applications, 2018 (%)
FIGURE 13 Mine & IED Detection System Market, by Applications, 2018–2023 (USD MILLION)
FIGURE 14 Mine & IED Detection System Market Share, by Region, 2018 (%)
FIGURE 15 Mine & IED Detection System Market, by Region, 2018–2023 (USD MILLION)
FIGURE 16 North America: Mine & IED Detection System Market Share, 2018 (%)
FIGURE 17 North America: Mine & IED Detection System Market, by Country, 2018–2023 (USD MILLION)
FIGURE 18 Europe: Mine & IED Detection System Market Share, 2018 (%)
FIGURE 19 Europe: Mine & IED Detection System Market, by Country, 2018–2023 (USD MILLION)
FIGURE 20 Asia-Pacific: Mine & IED Detection System Market Share, 2018 (%)
FIGURE 21 Asia-Pacific: Mine & IED Detection System Market, by Country, 2018–2023 (USD MILLION)
FIGURE 22 Middle East & Africa: Mine & IED Detection System Market Share, 2018 (%)
FIGURE 23 Middle East & Africa: Mine & IED Detection System Market, by Country, 2018–2023 (USD MILLION)
FIGURE 24 Latin America: Mine & IED Detection System Market Share, 2018 (%)
FIGURE 25 Latin America: Mine & IED Detection System Market, by Country, 2018–2023 (USD MILLION)