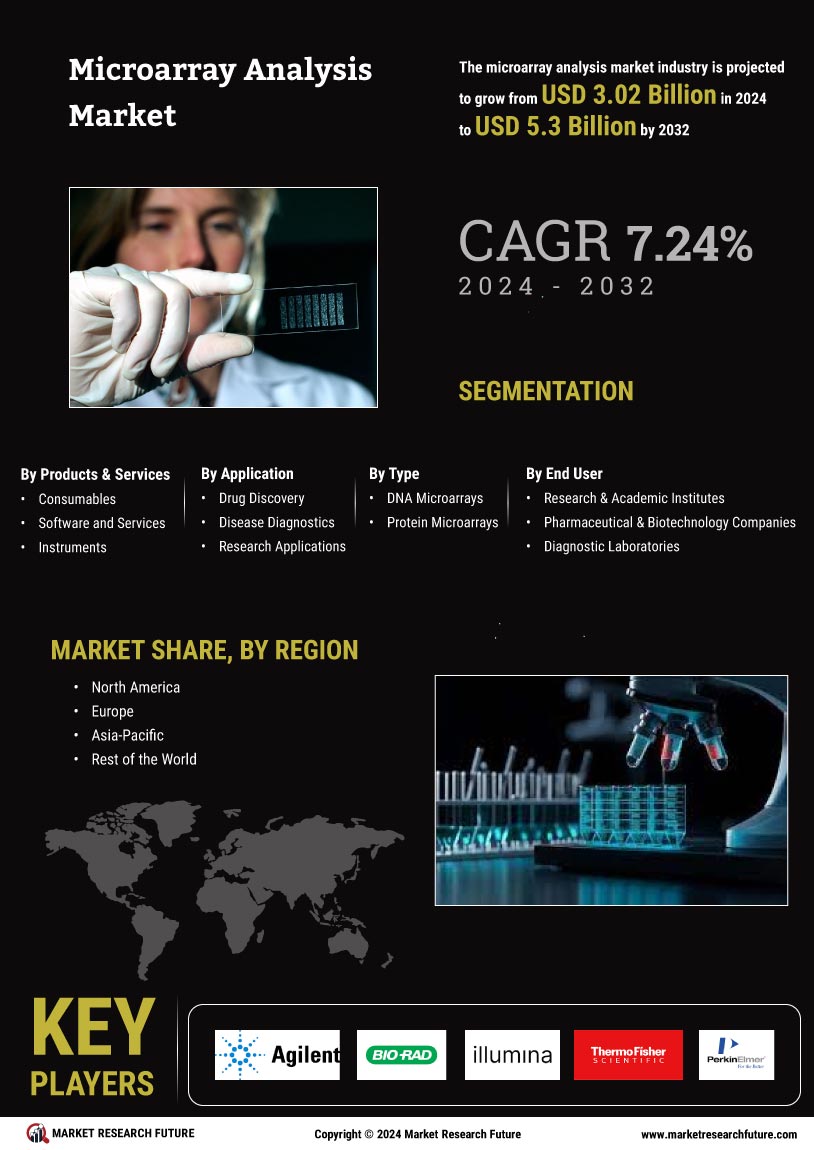
Certified Global Research Member
Isomar fd.webp Wcrc 57.webp
Key Questions Answered
  • Global Market Outlook
  • In-depth analysis of global and regional trends
  • Analyze and identify the major players in the market, their market share, key developments, etc.
  • To understand the capability of the major players based on products offered, financials, and strategies.
  • Identify disrupting products, companies, and trends.
  • To identify opportunities in the market.
  • Analyze the key challenges in the market.
  • Analyze the regional penetration of players, products, and services in the market.
  • Comparison of major players’ financial performance.
  • Evaluate strategies adopted by major players.
  • Recommendations
Why Choose Market Research Future?
  • Vigorous research methodologies for specific market.
  • Knowledge partners across the globe
  • Large network of partner consultants.
  • Ever-increasing/ Escalating data base with quarterly monitoring of various markets
  • Trusted by fortune 500 companies/startups/ universities/organizations
  • Large database of 5000+ markets reports.
  • Effective and prompt pre- and post-sales support.

Microarray Analysis Market Insights and Trends By Types (DNA Microarray, Protein Microarray), Application (Research, Genotyping, Forensic), Product Type (Reagent, Primers, Buffer), End-User (Pharmaceuticals, Biotechnology)-Forecast Till 2030


ID: MRFR/LS/0394-HCR | 115 Pages | Author: Kinjoll Dey| April 2024
Leading companies partner with us for data-driven Insights
client_1 client_2 client_3 client_4 client_5 client_6 client_7 client_8 client_9 client_10
Please fill in Business Email for Quick Response

TABLE OF CONTENT

Chapter 1. Report Prologue

Chapter 2. Market Introduction

2.1 Definition

2.2 Scope of the Study

2.2.1 Research Objective

2.2.2 Assumptions

2.2.3 Limitations

Chapter 3. Research Methodology

3.1 Introduction

3.2 Primary Research

3.3 Secondary Research

3.4 Market Size Estimation

Chapter 4. Market Dynamics

4.1 Drivers

4.2 Restraints

4.3 Opportunities

4.4 Challenges

4.5 Macroeconomic Indicators

4.6 Technology Trends & Assessment

Chapter 5. Market Factor Analysis

5.1 Porter’s Five Forces Analysis

5.1.1 Bargaining Power of Suppliers

5.1.2 Bargaining Power of Buyers

5.1.3 Threat of New Entrants

5.1.4 Threat of Substitutes

5.1.5 Intensity of Rivalry

5.2 Value Chain Analysis

5.3 Investment Feasibility Analysis

5.4 Pricing Analysis

Chapter 6. Global Microarray Analysis Market, by Types

6.1 Introduction

6.2 DNA microarrays

6.3 Protein microarrays

6.4 Tissue microarrays

6.5 Cellular microarrays

6.6 Chemical compound microarrays

6.7 Antibody microarrays

6.8 Glycan arrays

6.9 Phenotype microarrays
Chapter 7. Global Microarray Analysis Market, by Application

7.1 Introduction

7.2 Research

7.3 Genotyping

7.4 Forensic Analysis

7.5 Proteomics

7.6 Genomics

7.7 Disease Diagnosis

7.8 Drug Discovery

7.9 Toxicological Research

Chapter 8. Global Microarray Analysis Market, by Product Type

8.1 Introduction

8.2 Reagents

8.3 Primers

8.4 Buffers

8.5 DNA chips

8.6 Reagent kits

8.7 Instruments

8.7.1 Scanner

8.7.2 Hybridization Oven

8.7.3 Multi-Channel (MC) Instrument

8.7.4 Target Preparation Instrument

8.7.5 Slide Imprinters

8.7.6 Centrifuge

Chapter 8. Global Microarray Analysis Market, by End-User

8.1 Introduction

8.2 Pharmaceuticals

8.3 Biotechnology

8.4 Hospitals & Clinics

8.5 Ambulatory Care Centers

8.6 Diagnostic Centers

8.7 Academic and Research Institutes

Chapter 10. Global Microarray Analysis Market, by Region

10.1 Introduction

10.2 America

10.2.1 North America

10.2.1.1 US

10.2.1.2 Canada

10.2.2 South America

10.3 Europe

10.3.1 Western Europe

10.3.1.1 Germany

10.3.1.2 France

10.3.1.3 Italy

10.3.1.4 Spain

10.3.1.5 UK

10.3.1.6 Rest of Western Europe

10.3.2 Eastern Europe

10.4 Asia-Pacific

10.4.1 Japan

10.4.2 China

10.4.3 India

10.4.4 Australia

10.4.5 Republic of Korea

10.4.6 Rest of Asia-Pacific

10.5 Middle East & Africa

10.5.1 United Arab Emirates

10.5.2 Saudi Arabia

10.5.3 Oman

10.5.4 Kuwait

10.5.5 Qatar

10.5.6 Rest of the Middle East & Africa

Chapter 11. Company Landscape

11.1 Introduction

11.2 Market Share Analysis

11.3 Key Development & Strategies

11.3.1 Key Developments

Chapter 12 Company Profiles

12.1 Affymetrix, Inc

12.1.1 Company Overview

12.1.2 Type Overview

12.1.3 Financials

12.2.4 Key Developments

12.1.5 SWOT Analysis

12.2 Agilent Technologies

12.2.1 Company Overview

12.2.2 Type Overview

12.2.3 Financial Overview

12.2.4 Key Developments

12.2.5 SWOT Analysis

12.3 Sequenom, Inc.

12.3.1 Company Overview

12.3.2 Type Overview

12.3.3 Financial Overview

12.3.4 Key Development

12.3.5 SWOT Analysis

12.4 Roche NimbleGen

12.4.1 Company Overview

12.4.2 Type/Business Segment Overview

12.4.3 Financial Overview

12.4.4 Key Development

12.4.5 SWOT Analysis

12.5 Illumnia, Inc.

12.5.1 Company Overview

12.5.2 Type Overview

12.5.3 Financial overview

12.5.4 Key Developments

12.5.5 SWOT Analysis

12.6 Applied Microarrays

12.6.1 Company Overview

12.6.2 Type Overview

12.6.3 Financial Overview

12.6.4 Key Developments

12.6.5 SWOT Analysis

12.7 Biomerieux SA

12.7.1 Overview

12.7.2 Type Overview

12.7.3 Financials

12.7.4 Key Developments

12.7.5 SWOT Analysis

12.8 Discerna

12.8.1 Overview

12.8.2 Type Overview

12.8.3 Financials

12.8.4 Key Developments

12.8.5 SWOT Analysis

12.9 Gyros AB

12.9.1 Overview

12.9.2 Type Overview

12.9.3 Financials

12.9.4 Key Developments

12.9.5 SWOT Analysis

12.10 Luminex Corporation

12.10.1 Overview

12.10.2 Type Overview

12.10.3 Financials

12.10.4 Key Developments

12.10.5 SWOT Analysis

12.11 NextGen Sciences

12.12.1 Overview

12.12.2 Type Overview

12.12.3 Financials

12.12.4 Key Developments

12.12.5 SWOT Analysis

12.12 ProteoGenix

12.12.1 Overview

12.12.2 Type Overview

12.12.3 Financials

12.12.4 Key Developments

12.12.5 SWOT Analysis

12.13 Thermo Fisher Scientific

12.12.1 Overview

12.12.2 Type Overview

12.12.3 Financials

12.12.4 Key Developments

12.12.5 SWOT Analysis

12.14 Others

Chapter 14 Appendix

LIST OF TABLES

Table 1 Global Microarray Analysis Market Industry Synopsis, 2018–2027

Table 2 Global Microarray Analysis Market Estimates & Forecast, 2018–2027, (USD Million)

Table 3 Global Microarray Analysis Market, by Region, 2018–2027, (USD Million)

Table 4 Global Microarray Analysis Market, by Types, 2018–2027, (USD Million)

Table 5 Global Microarray Analysis Market, by Application, 2018–2027, (USD Million)

Table 6 Global Microarray Analysis Market, by Product Type, 2018–2027, (USD Million)
Table 7 Global Microarray Analysis Market, by End-User, 2018–2027, (USD Million)

Table 8 North America Microarray Analysis Market, by Types, 2018–2027, (USD Million)

Table 9 North America Microarray Analysis Market, by Application, 2018–2027, (USD Million)

Table 10 North America Microarray Analysis Market, by Product Type, 2018–2027, (USD Million)

Table 11 North America Microarray Analysis Market, by End-User, 2018–2027, (USD Million)

Table 12 US Microarray Analysis Market, by Types, 2018–2027, (USD Million)

Table 13 US Microarray Analysis Market, by Application, 2018–2027, (USD Million)

Table 14 US Microarray Analysis Market, by Product Type, 2018–2027, (USD Million)

Table 15 US Microarray Analysis Market, by End-User, 2018–2027, (USD Million)

Table 16 Canada Microarray Analysis Market, by Types, 2018–2027, (USD Million)

Table 17 Canada Microarray Analysis Market, by Application, 2018–2027, (USD Million)

Table 18 Canada Microarray Analysis Market, by Product Type, 2018–2027, (USD Million)

Table 19 Canada Microarray Analysis Market, by End-User, 2018–2027, (USD Million)

Table 20 South America Microarray Analysis Market, by Types, 2018–2027, (USD Million)

Table 21 South America Microarray Analysis Market, by Application, 2018–2027, (USD Million)

Table 22 South America Microarray Analysis Market, by Product Type, 2018–2027, (USD Million)

Table 23 South America Microarray Analysis Market, by End-User, 2018–2027, (USD Million)

Table 24 Europe Microarray Analysis Market, Types, 2018–2027, (USD Million)

Table 25 Europe Microarray Analysis Market, by Application, 2018–2027, (USD Million)

Table 26 Europe Microarray Analysis Market, by Product Type, 2018–2027, (USD Million)

Table 27 Europe Microarray Analysis Market, by End-User, 2018–2027, (USD Million)

Table 28 Western Europe Microarray Analysis Market, by Types, 2018–2027, (USD Million)

Table 29 Western Europe Microarray Analysis Market, by Application, 2018–2027, (USD Million)

Table 30 Western Europe Microarray Analysis Market, by Product Type, 2018–2027, (USD Million)

Table 31 Western Europe Microarray Analysis Market, by End-User, 2018–2027, (USD Million)

Table 32 Eastern Europe Microarray Analysis Market, by Types, 2018–2027, (USD Million)

Table 33 Eastern Europe Microarray Analysis Market, by Application, 2018–2027, (USD Million)

Table 34 Eastern Europe Microarray Analysis Market, by Product Type, 2018–2027, (USD Million)

Table 35 Eastern Europe Microarray Analysis Market, by End-User, 2018–2027, (USD Million)

Table 36 Asia-Pacific Microarray Analysis Market, by Types, 2018–2027, (USD Million)

Table 37 Asia-Pacific Microarray Analysis Market, by Application, 2018–2027, (USD Million)

Table 38 Asia-Pacific Microarray Analysis Market, by Product Type, 2018–2027, (USD Million)
Table 39 Asia-Pacific Microarray Analysis Market, by End-User, 2018–2027, (USD Million)

Table 40 Middle East & Africa Microarray Analysis Market, by Types, 2018–2027, (USD Million)

Table 41 Middle East & Africa Microarray Analysis Market, by Application, 2018–2027, (USD Million)

Table 42 Middle East & Africa Microarray Analysis Market, by Product Type, 2018–2027, (USD Million)
Table 43 Middle East & Africa Microarray Analysis Market, by End-User, 2018–2027, (USD Million)

LIST OF FIGURES

Figure 1 Research Process

Figure 2 Segmentation for Global Microarray Analysis Market

Figure 3 Market Dynamics for Global Microarray Analysis Market

Figure 4 Global Microarray Analysis Market Share, by Type 2017

Figure 5 Global Microarray Analysis Market Share, by Application, 2017

Figure 5 Global Microarray Analysis Market Share, by Product Type, 2017

Figure 6 Global Microarray Analysis Market Share, by End-User, 2017

Figure 7 Global Microarray Analysis Market Share, by Region, 2017

Figure 8 North America Microarray Analysis Market Share, by Country, 2017

Figure 9 Europe Microarray Analysis Share, by Country, 2017

Figure 10 Asia-Pacific Microarray Analysis Market Share, by Country, 2017

Figure 11 Middle East & Africa Microarray Analysis Market Share, by Country, 2017

Figure 12 Global Microarray Analysis Market: Company Share Analysis, 2017 (%)

Figure 13 Affymetrix, Inc: Key Financials

Figure 14 Affymetrix, Inc: Segmental Revenue

Figure 15 Affymetrix, Inc: Geographical Revenue

Figure 16 Agilent Technologies: Key Financials

Figure 17 Agilent Technologies: Segmental Revenue

Figure 18 Agilent Technologies: Geographical Revenue

Figure 19 Sequenom, Inc.: Key Financials

Figure 20 Sequenom, Inc.: Segmental Revenue

Figure 21 Sequenom, Inc.: Geographical Revenue

Figure 22 Roche NimbleGen: Key Financials

Figure 23 Roche NimbleGen: Segmental Revenue

Figure 24 Roche NimbleGen: Geographical Revenue

Figure 25 Illumnia, Inc.: Key Financials

Figure 26 Illumnia, Inc.: Segmental Revenue

Figure 27 Illumnia, Inc.: Geographical Revenue

Figure 28 Applied Microarrays: Key Financials

Figure 29 Applied Microarrays: Segmental Revenue

Figure 30 Applied Microarrays: Geographical Revenue

Figure 31 Biomerieux SA: Key Financials

Figure 32 Biomerieux SA: Segmental Revenue

Figure 33 Biomerieux SA: Geographical Revenue

Figure 34 Discerna: Key Financials

Figure 35 Discerna: Segmental Revenue

Figure 36 Discerna: Geographical Revenue

Figure 37 Gyros AB: Key Financials

Figure 38 Gyros AB: Segmental Revenue

Figure 39 Gyros AB: Geographical Revenue

Figure 40 Luminex Corporation: Key Financials

Figure 41 Luminex Corporation: Segmental Revenue

Figure 42 Luminex Corporation: Geographical Revenue

Figure 43 NextGen Sciences: Key Financials

Figure 44 NextGen Sciences: Segmental Revenue

Figure 45 NextGen Sciences: Geographical Revenue

Figure 46 ProteoGenix: Key Financials

Figure 47 ProteoGenix: Segmental Revenue

Figure 48 ProteoGenix: Geographical Revenue

Figure 49 Thermo Fisher Scientific: Key Financials

Figure 50 Thermo Fisher Scientific: Segmental Revenue

Figure 51 Thermo Fisher Scientific: Geographical Revenue

Purchase Option
Single User $ 4,950
Multiuser License $ 5,950
Enterprise User $ 7,250
Compare Licenses
Tailored for You
  • Dedicated Research on any specifics segment or region.
  • Focused Research on specific players in the market.
  • Custom Report based only on your requirements.
  • Flexibility to add or subtract any chapter in the study.
  • Historic data from 2014 and forecasts outlook till 2040.
  • Flexibility of providing data/insights in formats (PDF, PPT, Excel).
  • Provide cross segmentation in applicable scenario/markets.