Micromobility Market (2026 - 2035)

ID: MRFR/AT/6843-HCR 111 Pages Triveni Bhoyar Last Updated: October 16, 2026
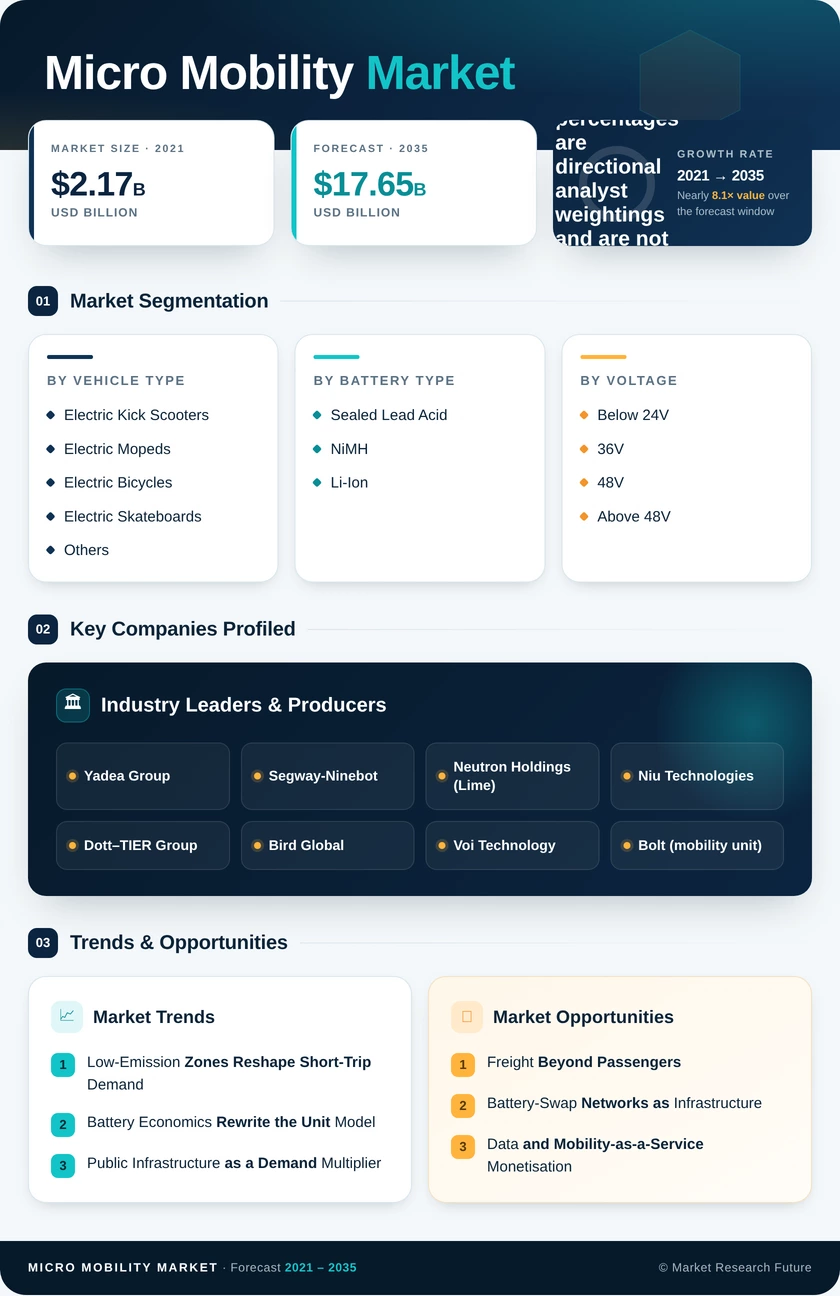
Micromobility Market Research Report By Vehicle Type (Electric Kick Scooters, Electric Mopeds, Electric Bicycles, Electric Skateboards, Others), By Battery Type (Sealed Lead Acid, NiMH, Li-Ion), By Voltage (Below 24V, 36V, 48V, Above 48V), By Sharing Model (Docked, Dockless, Subscription-Based) - Forecast to 2035
Micromobility Market
Market Size
Forecast Period2026-2035
CAGR (2026-2035)15.2%
2025 Market SizeUSD 4.29 Billion
2035 Market SizeUSD 17.65 billion
Key Players
Yadea Group
Segway-Ninebot
Neutron Holdings
Niu Technologies
Dott–TIER Group
Bird Global
Opportunities
  • Freight Beyond Passengers
  • Battery-Swap Networks as Infrastructure
  • Data and Mobility-as-a-Service Monetisation
  1. 1 Market Overview | |
    1. 1.1 Study Assumptions & Market Definition | |
    2. 1.2 Scope of the Study | |
    3. 1.3 Research Methodology | |
  2. 2 Market Summary & Key Takeaways | |
    1. 2.1 Key Takeaways by Vehicle Type | |
    2. 2.2 Key Takeaways by Sharing Model | |
    3. 2.3 Key Takeaways by Region | |
  3. 3 Market Size & Forecast (2021–2035) | |
    1. 3.1 Historical Market Size (2021–2024) | |
    2. 3.2 Base Year Estimate (2025) | |
    3. 3.3 Forecast Market Size (2026–2035) | |
    4. 3.4 Year-over-Year Growth Analysis | |
  4. 4 Market Drivers Analysis | |
    1. 4.1 Low-Emission Zones and Congestion Policy | |
    2. 4.2 Battery Cost Decline and Swappable Architectures | |
    3. 4.3 Public Cycling and Street-Safety Infrastructure | |
    4. 4.4 Commercial and Delivery Fleet Adoption | |
  5. 5 Market Restraints Analysis | |
    1. 5.1 Rider Safety Data and Regulatory Response | |
    2. 5.2 Permit Caps and Public-Space Conflict | |
    3. 5.3 Vehicle Lifespan and Unit Economics | |
  6. 6 Market Opportunity Analysis | |
    1. 6.1 Commercial Freight Applications | |
    2. 6.2 Battery-Swap Network Infrastructure | |
    3. 6.3 Data and Mobility-as-a-Service Monetisation | |
    4. 6.4 Emerging-Market Fleet Expansion | |
    5. 6.5 Retail Ownership Channels | |
  7. 7 Regional Analysis | |
    1. 7.1 North America | | |
      1. 7.1.1 US | | |
      2. 7.1.2 Canada | | |
      3. 7.1.3 Mexico | |
    2. 7.2 Europe | | |
      1. 7.2.1 Germany | | |
      2. 7.2.2 UK | | |
      3. 7.2.3 France | | |
      4. 7.2.4 Italy | | |
      5. 7.2.5 Spain | | |
      6. 7.2.6 Nordic Countries | | |
      7. 7.2.7 Russia | | |
      8. 7.2.8 Rest of Europe | |
    3. 7.3 Asia-Pacific | | |
      1. 7.3.1 China | | |
      2. 7.3.2 India | | |
      3. 7.3.3 Japan | | |
      4. 7.3.4 South Korea | | |
      5. 7.3.5 ASEAN | | |
      6. 7.3.6 Rest of Asia-Pacific | |
    4. 7.4 South America | | |
      1. 7.4.1 Brazil | | |
      2. 7.4.2 Argentina | | |
      3. 7.4.3 Rest of South America | |
    5. 7.5 Middle East & Africa | | |
      1. 7.5.1 Saudi Arabia | | |
      2. 7.5.2 UAE | | |
      3. 7.5.3 South Africa | | |
      4. 7.5.4 Egypt | | |
      5. 7.5.5 Rest of Middle East & Africa | |
  8. 8 Future Outlook (2026–2035) | |
    1. 8.1 Autonomous Repositioning and Fleet Automation | |
    2. 8.2 Platform Economics and Consolidation | |
    3. 8.3 Electrification Supercycle | |
    4. 8.4 Sustainability Reporting and Corporate Demand | |
  9. 9 Segmentation Analysis | |
    1. 9.1 By Vehicle Type | | |
      1. 9.1.1 Electric Kick Scooters | | |
      2. 9.1.2 Electric Mopeds | | |
      3. 9.1.3 Electric Bicycles | | |
      4. 9.1.4 Electric Skateboards | | |
      5. 9.1.5 Others | |
    2. 9.2 By Battery Type | | |
      1. 9.2.1 Sealed Lead Acid | | |
      2. 9.2.2 NiMH | | |
      3. 9.2.3 Li-Ion | |
    3. 9.3 By Voltage | | |
      1. 9.3.1 Below 24V | | |
      2. 9.3.2 36V | | |
      3. 9.3.3 48V | | |
      4. 9.3.4 Above 48V | |
    4. 9.4 By Sharing Model | | |
      1. 9.4.1 Docked | | |
      2. 9.4.2 Dockless | | |
      3. 9.4.3 Subscription-Based | |
  10. 10 Competitive Landscape | |
    1. 10.1 Market Share Analysis (2026) | |
    2. 10.2 Competitive Benchmarking Matrix | |
    3. 10.3 Company Profiles | | |
      1. 10.3.1 Yadea Group | | |
      2. 10.3.2 Segway-Ninebot | | |
      3. 10.3.3 Neutron Holdings (Lime) | | |
      4. 10.3.4 Niu Technologies | | |
      5. 10.3.5 Dott–TIER Group | | |
      6. 10.3.6 Bird Global | | |
      7. 10.3.7 Voi Technology | | |
      8. 10.3.8 Bolt | | |
      9. 10.3.9 Yulu | | |
      10. 10.3.10 Beam Mobility | |
  11. 11 Recent Developments & News | |
  12. 12 Report Scope & Methodology | |
    1. 12.1 Study Period & Base Year | |
    2. 12.2 Data Sources & Citations | |
    3. 12.3 Abbreviations | |
  13. 13 Detailed Sources and Citations | |
  14. 14 Frequently Asked Questions | | LIST OF TABLES | |
  15. TABLE 1 Global Market Size & Forecast, by Revenue (USD Billion), 2021–2035 | |
  16. TABLE 2 Year-over-Year Growth Analysis, 2021–2035 | |
  17. TABLE 3 Driver Impact Matrix, 2026–2035 | |
  18. TABLE 4 Restraint Impact Matrix, 2026–2035 | |
  19. TABLE 5 Market Size, by Region (USD Billion), 2021–2035 | |
  20. TABLE 6 North America Market Size, by Country, 2021–2035 | |
  21. TABLE 7 Europe Market Size, by Country, 2021–2035 | |
  22. TABLE 8 Asia-Pacific Market Size, by Country, 2021–2035 | |
  23. TABLE 9 South America Market Size, by Country, 2021–2035 | |
  24. TABLE 10 Middle East & Africa Market Size, by Country, 2021–2035 | |
  25. TABLE 11 Market Size, by Vehicle Type (USD Billion), 2021–2035 | |
  26. TABLE 12 Market Size, by Battery Type (USD Billion), 2021–2035 | |
  27. TABLE 13 Market Size, by Voltage (USD Billion), 2021–2035 | |
  28. TABLE 14 Market Size, by Sharing Model (USD Billion), 2021–2035 | |
  29. TABLE 15 North America Market Size, by Vehicle Type and Sharing Model, 2021–2035 | |
  30. TABLE 16 Europe Market Size, by Vehicle Type and Sharing Model, 2021–2035 | |
  31. TABLE 17 Asia-Pacific Market Size, by Vehicle Type and Sharing Model, 2021–2035 | |
  32. TABLE 18 South America Market Size, by Vehicle Type and Sharing Model, 2021–2035 | |
  33. TABLE 19 Middle East & Africa Market Size, by Vehicle Type and Sharing Model, 2021–2035 | |
  34. TABLE 20 Competitive Benchmarking Matrix, 2026 | |
  35. TABLE 21 Company Profiles – Key Players | |
  36. TABLE 22 Recent Developments & Strategic Announcements, 2023–2025 | |
  37. TABLE 23 Report Scope & Methodology Summary | |
  38. TABLE 24 Detailed Sources and Citations | | LIST OF FIGURES | |
  39. FIGURE 1 Market Dynamics – Drivers, Restraints and Opportunities | |
  40. FIGURE 2 Industry Value Chain Analysis | |
  41. FIGURE 3 Porter's Five Forces Analysis | |
  42. FIGURE 4 Market Size Trend and Forecast (USD Billion), 2021–2035 | |
  43. FIGURE 5 Year-over-Year Growth Trajectory, 2021–2035 | |
  44. FIGURE 6 Revenue Share by Vehicle Type, 2025 vs 2035 | |
  45. FIGURE 7 Revenue Share by Battery Type, 2025 vs 2035 | |
  46. FIGURE 8 Revenue Share by Voltage Class, 2025 vs 2035 | |
  47. FIGURE 9 Revenue Share by Sharing Model, 2025 vs 2035 | |
  48. FIGURE 10 Regional Revenue Share Distribution, 2025 | |
  49. FIGURE 11 Regional CAGR Comparison, 2026–2035 | |
  50. FIGURE 12 Country-Level Share within Asia-Pacific, 2025 | |
  51. FIGURE 13 Country-Level Share within Europe, 2025 | |
  52. FIGURE 14 Competitive Landscape – Estimated Revenue Share Bands, 2026 | |
  53. FIGURE 15 Strategic Positioning Matrix – Manufacturers vs Fleet Operators

Segmentation Quick Reference

DimensionSub-SegmentsDominant SegmentFastest Growing Segment
By Vehicle TypeElectric Kick Scooters, Electric Mopeds, Electric Bicycles, Electric Skateboards, OthersElectric Kick ScootersElectric Mopeds
By Battery TypeSealed Lead Acid, NiMH, Li-IonLi-IonLi-Ion
By VoltageBelow 24V, 36V, 48V, Above 48V36V48V
By Sharing ModelDocked, Dockless, Subscription-BasedDocklessSubscription-Based
By RegionNorth America, Europe, Asia-Pacific, South America, Middle East & AfricaAsia-PacificEurope


Market Segmentation Overview

By Vehicle Type

Sub-SegmentKey Trend
Electric Kick ScootersRuggedised third-generation frames extending service life beyond 30 months
Electric MopedsFastest adoption among delivery and courier fleets seeking range and payload
Electric BicyclesRetail purchase incentives lifting consumer ownership across Western Europe
Electric SkateboardsNarrow leisure niche with limited shared-fleet penetration
OthersAdaptive and three-wheeled formats gaining municipal accessibility support


Vehicle mix is diverging by buyer. Consumer channels increasingly favour bicycles, while commercial buyers move toward moped-class vehicles with higher voltage systems and serviceable components.

By Battery Type

Sub-SegmentKey Trend
Sealed Lead AcidDeclining share, retained only in cost-sensitive legacy Asian fleets
NiMHResidual industrial use with minimal new design activity
Li-IonStandard architecture, with LFP chemistry gaining ground on safety grounds


Battery selection now drives certification cost as much as performance. Fire-safety scrutiny has pushed manufacturers toward chemistries with better thermal stability, even at a small energy-density penalty.

By Voltage

Sub-SegmentKey Trend
Below 24VEntry-level consumer vehicles under price pressure
36VDefault configuration for shared scooter and bicycle fleets
48VExpanding rapidly with cargo and moped-class demand
Above 48VReserved for heavy-duty commercial and industrial applications


Voltage migration upward tracks the shift from leisure to utility use. Higher-voltage systems support heavier loads, hill performance, and the duty cycles commercial operators require.

By Sharing Model

Sub-SegmentKey Trend
DockedSustained by long-term municipal transit contracts and public funding
DocklessLargest revenue base, increasingly constrained by parking mandates
Subscription-BasedFastest expansion, converting casual riders into contracted monthly revenue


Access models are consolidating around predictability. Operators that shift riders onto recurring plans report materially higher trip frequency and lower customer acquisition cost, which is reshaping how fleets are financed.




Download PDF ×

We do not share your information with anyone. However, we may send you emails based on your report interest from time to time. You may contact us at any time to opt-out.