ID: MRFR/AM/9409-HCR | August 2022 | Region: Global | 100 Pages
TABLE OF CONTENTS
1. EXECUTIVE SUMMARY
2. MARKET INTRODUCTION
2.1. Market Definition
2.2. Scope of the Study
2.2.1. Research Objectives
2.2.2. Assumptions & Limitations
2.3. Market Structure
3. MARKET RESEARCH METHODOLOGY
3.1. Research Process
3.2. Secondary Research
3.3. Primary Research
3.4. Forecast Model
4. MARKET LANDSCAPE
4.1. Supply Chain Analysis
4.2. Porter’s Five Forces Analysis
4.2.1. Threat of New Entrants
4.2.2. Bargaining Power of Buyers
4.2.3. Bargaining Power of Suppliers
4.2.4. Threat of Substitutes
4.2.5. Internal Rivalry
4.3. Impact of COVID-19 on Global Smart Mobility Market
4.3.1. Impact on Production
4.3.2. Impact on Sales
4.3.3. Impact on Pricing
4.3.4. Others
5. MARKET DYNAMICS OF THE GLOBAL SMART MOBILITY MARKET
5.1. Introduction
5.2. Drivers
5.3. Restraints
5.4. Opportunities
5.5. Challenges
6. GLOBAL SMART MOBILITY MARKET, BY ELEMENT
6.1. Introduction
6.2. Bike Commuting
6.2.1. Market Estimates & Forecast, 2019-2030
6.2.2. Market Estimates & Forecast, by region, 2019-2030
6.3. Car Sharing
6.3.1. Market Estimates & Forecast, 2019-2030
6.3.2. Market Estimates & Forecast, by Region, 2019-2030
6.4. Ride Sharing
6.4.1. Market Estimates & Forecast, 2019-2030
6.4.2. Market Estimates & Forecast, by region, 2019-2030
7. GLOBAL SMART MOBILITY MARKET, BY SOLUTION TYPE
7.1. Introduction
7.2. Traffic Management
7.2.1. Market Estimates & Forecast, 2019-2030
7.2.2. Market Estimates & Forecast, by Region, 2019-2030
7.3. Parking Management
7.3.1. Market Estimates & Forecast, 2019-2030
7.3.2. Market Estimates & Forecast, by Region, 2019-2030
7.4. Mobility Management
7.4.1. Market Estimates & Forecast, 2019-2030
7.4.2. Market Estimates & Forecast, by Region, 2019-2030
7.5. Others
7.5.1. Market Estimates & Forecast, 2019-2030
7.5.2. Market Estimates & Forecast, by Region, 2019-2030
8. GLOBAL SMART MOBILITY MARKET, BY TECHNOLOGY
8.1. Introduction
8.2. 3G & 4G
8.2.1. Market Estimates & Forecast, 2019-2030
8.2.2. Market Estimates & Forecast, by Region, 2019-2030
8.3. Wi-Fi
8.3.1. Market Estimates & Forecast, 2019-2030
8.3.2. Market Estimates & Forecast, by Region, 2019-2030
8.4. Global Positioning System (GPS)
8.4.1. Market Estimates & Forecast, 2019-2030
8.4.2. Market Estimates & Forecast, by Region, 2019-2030
8.5. Radiofrequency Identification (RFID)
8.5.1. Market Estimates & Forecast, 2019-2030
8.5.2. Market Estimates & Forecast, by Region, 2019-2030
8.6. Embedded System
8.6.1. Market Estimates & Forecast, 2019-2030
8.6.2. Market Estimates & Forecast, by Region, 2019-2030
8.7. Others
8.7.1. Market Estimates & Forecast, 2019-2030
8.7.2. Market Estimates & Forecast, by Region, 2019-2030
9. GLOBAL SMART MOBILITY MARKET, BY REGION
9.1. Introduction
9.2. North America
9.2.1. Market Estimates & Forecast, 2019-2030
9.2.2. Market Estimates & Forecast, by Element, 2019-2030
9.2.3. Market Estimates & Forecast, by Solution Type, 2019-2030
9.2.4. Market Estimates & Forecast, by Technology, 2019-2030
9.2.5. Market Estimates & Forecast, by Country, 2019-2030
9.2.6. US
9.2.6.1. Market Estimates & Forecast, by Element, 2019-2030
9.2.6.2. Market Estimates & Forecast, by Solution Type, 2019-2030
9.2.6.3. Market Estimates & Forecast, by Technology, 2019-2030
9.2.7. Canada
9.2.7.1. Market Estimates & Forecast, by Element, 2019-2030
9.2.7.2. Market Estimates & Forecast, by Solution Type, 2019-2030
9.2.7.3. Market Estimates & Forecast, by Technology, 2019-2030
9.2.8. Mexico
9.2.8.1. Market Estimates & Forecast, by Element, 2019-2030
9.2.8.2. Merket Estimates & Forecast, by Solution Type, 2019-2030
9.2.8.3. Market Estimates & Forecast, by Technology, 2019-2030
9.3. Europe
9.3.1. Market Estimates & Forecast, 2019-2030
9.3.2. Market Estimates & Forecast, by Element, 2019-2030
9.3.3. Market Estimates & Forecast, by Solution Type, 2019-2030
9.3.4. Market Estimates & Forecast, by Technology, 2019-2030
9.3.5. Market Estimates & Forecast, by Country, 2019-2030
9.3.6. Germany
9.3.6.1. Market Estimates & Forecast, by Element, 2019-2030
9.3.6.2. Market Estimates & Forecast, by Solution Type, 2019-2030
9.3.6.3. Market Estimates & Forecast, by Technology, 2019-2030
9.3.7. UK
9.3.7.1. Market Estimates & Forecast, by Element, 2019-2030
9.3.7.2. Market Estimates & Forecast, by Solution Type, 2019-2030
9.3.7.3. Market Estimates & Forecast, by Technology, 2019-2030
9.3.8. France
9.3.8.1. Market Estimates & Forecast, by Element, 2019-2030
9.3.8.2. Market Estimates & Forecast, by Solution Type, 2019-2030
9.3.8.3. Market Estimates & Forecast, by Technology, 2019-2030
9.3.9. Spain
9.3.9.1. Market Estimates & Forecast, by Element, 2019-2030
9.3.9.2. Market Estimates & Forecast, by Solution Type, 2019-2030
9.3.9.3. Market Estimates & Forecast, by Technology, 2019-2030
9.3.10. Italy
9.3.10.1. Market Estimates & Forecast, by Element, 2019-2030
9.3.10.2. Market Estimates & Forecast, by Solution Type, 2019-2030
9.3.10.3. Market Estimates & Forecast, by Technology, 2019-2030
9.3.11. Rest of Europe
9.3.11.1. Market Estimates & Forecast, by Element, 2019-2030
9.3.11.2. Market Estimates & Forecast, by Solution Type, 2019-2030
9.3.11.3. Market Estimates & Forecast, by Technology, 2019-2030
9.4. Asia-Pacific
9.4.1. Market Estimates & Forecast, 2019-2030
9.4.2. Market Estimates & Forecast, by Element, 2019-2030
9.4.3. Market Estimates & Forecast, by Solution Type, 2019-2030
9.4.4. Market Estimates & Forecast, by Technology, 2019-2030
9.4.5. Market Estimates & Forecast, by Country, 2019-2030
9.4.6. China
9.4.6.1. Market Estimates & Forecast, by Element, 2019-2030
9.4.6.2. Market Estimates & Forecast, by Solution Type, 2019-2030
9.4.6.3. Market Estimates & Forecast, by Technology, 2019-2030
9.4.7. Japan
9.4.7.1. Market Estimates & Forecast, by Element, 2019-2030
9.4.7.2. Market Estimates & Forecast, by Solution Type, 2019-2030
9.4.7.3. Market Estimates & Forecast, by Technology, 2019-2030
9.4.8. India
9.4.8.1. Market Estimates & Forecast, by Element, 2019-2030
9.4.8.2. Market Estimates & Forecast, by Solution Type, 2019-2030
9.4.8.3. Market Estimates & Forecast, by Technology, 2019-2030
9.4.9. Australia & New Zealand
9.4.9.1. Market Estimates & Forecast, by Element, 2019-2030
9.4.9.2. Market Estimates & Forecast, by Solution Type, 2019-2030
9.4.9.3. Market Estimates & Forecast, by Technology, 2019-2030
9.4.10. Rest of Asia-Pacific
9.4.10.1. Market Estimates & Forecast, by Element, 2019-2030
9.4.10.2. Market Estimates & Forecast, by Solution Type, 2019-2030
9.4.10.3. Market Estimates & Forecast, by Technology, 2019-2030
9.5. Rest of the World
9.5.1. Market Estimates & Forecast, 2019-2030
9.5.2. Market Estimates & Forecast, by Element, 2019-2030
9.5.3. Market Estimates & Forecast, by Solution Type, 2019-2030
9.5.4. Market Estimates & Forecast, by Technology, 2019-2030
9.5.5. Market Estimates & Forecast, by Region, 2019-2030
9.5.6. South America
9.5.6.1. Market Estimates & Forecast, by Element, 2019-2030
9.5.6.2. Market Estimates & Forecast, by Solution Type, 2019-2030
9.5.6.3. Market Estimates & Forecast, by Technology, 2019-2030
9.5.7. Middle East
9.5.7.1. Market Estimates & Forecast, by Element, 2019-2030
9.5.7.2. Market Estimates & Forecast, by Solution Type, 2019-2030
9.5.7.3. Market Estimates & Forecast, by Technology, 2019-2030
9.5.8. Africa
9.5.8.1. Market Estimates & Forecast, by Element, 2019-2030
9.5.8.2. Market Estimates & Forecast, by Solution Type, 2019-2030
9.5.8.3. Market Estimates & Forecast, by Technology, 2019-2030
10. COMPETITIVE LANDSCAPE
10.1. Introduction
10.2. Market Strategy
10.3. Key Development Analysis
(Expansions/Mergers & Acquisitions/Joint Ventures/New Service Developments/Agreements/Investments)
11. COMPANY PROFILES
11.1. Cisco
11.1.1. Company Overview
11.1.2. Financial Updates
11.1.3. Business Segment Overview
11.1.4. Strategies
11.1.5. Key Developments
11.1.6. SWOT Analysis
11.2. Excelfore Corporation
11.2.1. Company Overview
11.2.2. Financial Updates
11.2.3. Business Segment Overview
11.2.4. Strategies
11.2.5. Key Developments
11.2.6. SWOT Analysis
11.3. Ford Motor Company
11.3.1. Company Overview
11.3.2. Financial Updates
11.3.3. Business Segment Overview
11.3.4. Strategies
11.3.5. Key Developments
11.3.6. SWOT Analysis
11.4. Innoviz Technologies. Inc
11.4.1. Company Overview
11.4.2. Financial Updates
11.4.3. Business Segment Overview
11.4.4. Strategies
11.4.5. Key Developments
11.4.6. SWOT Analysis
11.5. MAAS Global Oy
11.5.1. Company Overview
11.5.2. Financial Updates
11.5.3. Business Segment Overview
11.5.4. Strategies
11.5.5. Key Developments
11.5.6. SWOT Analysis
11.6. QuaLiX Information System
11.6.1. Company Overview
11.6.2. Financial Updates
11.6.3. Business Segment Overview
11.6.4. Strategies
11.6.5. Key Developments
11.6.6. SWOT Analysis
11.7. Robert Bosch GmbH
11.7.1. Company Overview
11.7.2. Financial Updates
11.7.3. Business Segment Overview
11.7.4. Strategies
11.7.5. Key Developments
11.7.6. SWOT Analysis
11.8. Siemens
11.8.1. Company Overview
11.8.2. Financial Updates
11.8.3. Business Segment Overview
11.8.4. Strategies
11.8.5. Key Developments
11.8.6. SWOT Analysis
11.9. TomTom International
11.9.1. Company Overview
11.9.2. Financial Updates
11.9.3. Business Segment Overview
11.9.4. Strategies
11.9.5. Key Developments
11.9.6. SWOT Analysis
11.10. Toyota Motor Corporation
11.10.1. Company Overview
11.10.2. Financial Updates
11.10.3. Business Segment Overview
11.10.4. Strategies
11.10.5. Key Developments
11.10.6. SWOT Analysis
12. CONCLUSION
LIST OF TABLES
TABLE 1 Global Smart Mobility Market, by Region, 2019-2030 (USD Million)
TABLE 2 Global Smart Mobility Market, by Element, 2019-2030 (USD Million)
TABLE 3 Global Smart Mobility Market, by Solution Type, 2019-2030 (USD Million)
TABLE 4 Global Smart Mobility Market, by Technology, 2019-2030 (USD Million)
TABLE 5 North America: Smart Mobility Market, by Country, 2019-2030 (USD Million)
TABLE 6 North America: Smart Mobility Market, by Element, 2019-2030 (USD Million)
TABLE 7 North America: Smart Mobility Market, by Solution Type, 2019-2030 (USD Million)
TABLE 8 North America: Smart Mobility Market, by Technology, 2019-2030 (USD Million)
TABLE 9 US: Smart Mobility Market, by Element, 2019-2030 (USD Million)
TABLE 10 US: Smart Mobility Market, by Solution Type, 2019-2030 (USD Million)
TABLE 11 US: Smart Mobility Market, by Technology, 2019-2030 (USD Million)
TABLE 12 Canada: Smart Mobility Market, by Element, 2019-2030 (USD Million)
TABLE 13 Canada: Smart Mobility Market, by Solution Type, 2019-2030 (USD Million)
TABLE 14 Canada: Smart Mobility Market, by Technology, 2019-2030 (USD Million)
TABLE 15 Mexico: Smart Mobility Market, by Element, 2019-2030 (USD Million)
TABLE 16 Mexico: Smart Mobility Market, by Solution Type, 2019-2030 (USD Million)
TABLE 17 Mexico: Smart Mobility Market, by Technology, 2019-2030 (USD Million)
TABLE 18 Europe: Smart Mobility Market, by Country, 2019-2030 (USD Million)
TABLE 19 Europe: Smart Mobility Market, by Element, 2019-2030 (USD Million)
TABLE 20 Europe: Smart Mobility Market, by Solution Type, 2019-2030 (USD Million)
TABLE 21 Europe: Smart Mobility Market, by Technology, 2019-2030 (USD Million)
TABLE 22 Germany: Smart Mobility Market, by Element, 2019-2030 (USD Million)
TABLE 23 Germany: Smart Mobility Market, by Solution Type, 2019-2030 (USD Million)
TABLE 24 Germany: Smart Mobility Market, by Technology, 2019-2030 (USD Million)
TABLE 25 France: Smart Mobility Market, by Element, 2019-2030 (USD Million)
TABLE 26 France: Smart Mobility Market, by Solution Type, 2019-2030 (USD Million)
TABLE 27 France: Smart Mobility Market, by Technology, 2019-2030 (USD Million)
TABLE 28 Italy: Smart Mobility Market, by Element, 2019-2030 (USD Million)
TABLE 29 Italy: Smart Mobility Market, by Solution Type, 2019-2030 (USD Million)\
TABLE 30 Italy: Smart Mobility Market, by Technology, 2019-2030 (USD Million)
TABLE 31 Spain: Smart Mobility Market, by Element, 2019-2030 (USD Million)
TABLE 32 Spain: Smart Mobility Market, by Solution Type, 2019-2030 (USD Million)
TABLE 33 Spain: Smart Mobility Market, by Technology, 2019-2030 (USD Million)
TABLE 34 UK: Smart Mobility Market, by Element, 2019-2030 (USD Million)
TABLE 35 UK: Smart Mobility Market, by Solution Type, 2019-2030 (USD Million)
TABLE 36 UK: Smart Mobility Market, by Technology, 2019-2030 (USD Million)
TABLE 37 Rest of Europe: Smart Mobility Market, by Element, 2019-2030 (USD Million)
TABLE 38 Rest of Europe: Smart Mobility Market, by Solution Type, 2019-2030 (USD Million)
TABLE 39 Rest of Europe: Smart Mobility Market, by Technology, 2019-2030 (USD Million)
TABLE 40 Asia-Pacific: Smart Mobility Market, by Country, 2019-2030 (USD Million)
TABLE 41 Asia-Pacific: Smart Mobility Market, by Element, 2019-2030 (USD Million)
TABLE 42 Asia-Pacific: Smart Mobility Market, by Solution Type, 2019-2030 (USD Million)
TABLE 43 Asia-Pacific: Smart Mobility Market, by Technology, 2019-2030 (USD Million)
TABLE 44 China: Smart Mobility Market, by Element, 2019-2030 (USD Million)
TABLE 45 China: Smart Mobility Market, by Solution Type, 2019-2030 (USD Million)
TABLE 46 China: Smart Mobility Market, by Technology, 2019-2030 (USD Million)
TABLE 47 India: Smart Mobility Market, by Element, 2019-2030 (USD Million)
TABLE 48 India: Smart Mobility Market, by Solution Type, 2019-2030 (USD Million)
TABLE 49 India: Smart Mobility Market, by Technology, 2019-2030 (USD Million)
TABLE 50 Japan: Smart Mobility Market, by Element, 2019-2030 (USD Million)
TABLE 51 Japan: Smart Mobility Market, by Solution Type, 2019-2030 (USD Million)
TABLE 52 Japan: Smart Mobility Market, by Technology, 2019-2030 (USD Million)
TABLE 53 Australia & New Zealand: Smart Mobility Market, by Element, 2019-2030 (USD Million)
TABLE 54 Australia & New Zealand: Smart Mobility Market, by Solution Type, 2019-2030 (USD Million)
TABLE 55 Australia & New Zealand: Smart Mobility Market, by Technology, 2019-2030 (USD Million)
TABLE 56 Rest of Asia-Pacific: Smart Mobility Market, by Element, 2019-2030 (USD Million)
TABLE 57 Rest of Asia-Pacific: Smart Mobility Market, by Solution Type, 2019-2030 (USD Million)
TABLE 58 Rest of Asia-Pacific: Smart Mobility Market, by Technology, 2019-2030 (USD Million)
TABLE 59 Rest of the World (RoW): Smart Mobility Market, by Region, 2019-2030 (USD Million)
TABLE 60 Rest of the World (RoW): Smart Mobility Market, by Element, 2019-2030 (USD Million)
TABLE 61 Rest of the World (RoW): Smart Mobility Market, by Solution Type, 2019-2030 (USD Million)
TABLE 62 Rest of the World (RoW): Smart Mobility Market, by Technology, 2019-2030 (USD Million)
TABLE 63 South America: Smart Mobility Market, by Element, 2019-2030 (USD Million)
TABLE 64 South America: Smart Mobility Market, by Solution Type, 2019-2030 (USD Million)
TABLE 65 South America: Smart Mobility Market, by Technology, 2019-2030 (USD Million)
TABLE 66 Middle East: Smart Mobility Market, by Element, 2019-2030 (USD Million)
TABLE 67 Middle East: Smart Mobility Market, by Solution Type, 2019-2030 (USD Million)
TABLE 68 Middle East: Smart Mobility Market, by Technology, 2019-2030 (USD Million)
TABLE 69 Africa: Smart Mobility Market, by Element, 2019-2030 (USD Million)
TABLE 70 Africa: Smart Mobility Market, by Solution Type, 2019-2030 (USD Million)
TABLE 71 Africa: Smart Mobility Market, by Technology, 2019-2030 (USD Million)
LIST OF FIGURES
FIGURE 1 Global Smart Mobility Market Segmentation
FIGURE 2 Forecast Research Methodology
FIGURE 3 Five Forces Analysis of the Global Smart Mobility Market
FIGURE 4 Value Chain of the Global Smart Mobility Market
FIGURE 5 Share of the Global Smart Mobility Market in 2021, by Country (%)
FIGURE 6 Global Smart Mobility Market, by Region, 2019-2030,
FIGURE 7 Global Smart Mobility Market Share, by Element, 2021 (%)
FIGURE 8 Global Smart Mobility Market, by Element, 2019-2030
FIGURE 9 Global Smart Mobility Market Share, by Solution Type, 2021 (%)
FIGURE 10 Global Smart Mobility Market, by Solution Type, 2019-2030
FIGURE 11 Global Smart Mobility Market Share, by Technology, 2021 (%)
FIGURE 12 Global Smart Mobility Market, by Technology, 2019-2030
$~71 Billion
20.5%
Asia Pacific
2020 - 2027
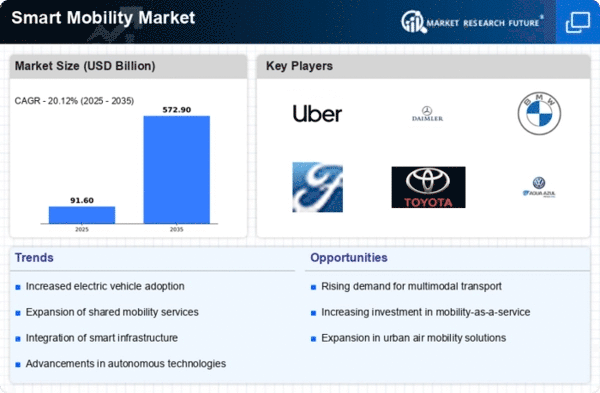
The global smart mobility market size is projected to grow at a CAGR of approximately 20.5% from 2022 to 2030. Smart mobility refers to the transportation solution which is intelligent and safe. It is widely used in electric vehicles (electric cars, electric bikes), the internet of things, and so on. Not only can it be used in the transportation field, but also widely used in other industries, such as logistics, fire control, and electric power.
COVID-19 Impact Analysis
As soon as the COVID started to spread across the world and the number of cases started to increase there were various restrictions imposed. The various government in their countries has stopped various activities and movement of people to reduce the spread of the virus. This has led to the stoppage of transportation services and the demand for smart mobility started to decline.
Smart Mobility Market Dynamics
The smart mobility market has grown substantially due to the improvement in technology. The use of IoT and Big Data as a service has enabled the growth of a brand-new market. The industry has become more sophisticated, and companies are focusing on modernizing their products and services. While smart mobility is already a big market, it is expected to grow even more in the coming years. In the future, there's going to be an increased demand for smart mobility products across the world. There's going to be a huge growth in this industry, which will see a rise in the smart car industry and other similar industries.
Drivers
On-demand services provide customers with large amounts of flexibility, real-time customer feedback, tracking features, and the ability to evaluate their experience with ratings. They are a great way to cut costs and provide a service that is personal to each customer's needs. There are many ways that people can compare a variety of prices without needing to go to the dealership themselves. Mobile apps make it easy to find the best possible deal. For instance, some apps have been coming out to help you find nearby ride services. AI writing services allow customers to use lots of features. These include the ability to find exact locations and match demand with available supply. These factors have a significant impact on the smart mobility market and are driving it forward.
Restraint:
In recent years there has been an upward trend of data hacking over the internet. These days, there are several people out there whose only aim is to hack into the computer and steal valuable data. A lot of companies use data encryption to safeguard their data, but several people can still crack encryption. Awareness of the threat is increasing, and governments are putting stricter laws to protect the data but there are still some questions about whether it's enough to make the companies feel safe.
Opportunity:
The market for smart mobility is growing quickly, as governments and private organizations embrace the use of autonomous vehicles for the greater good. The technology behind autonomous vehicles market includes GPS, computer vision, and a lot more software that allows the vehicle to have a brain of its own. This will not only save a lot of lives, but it will also reduce traffic since the vehicles will be able to communicate with each other and will be able to drive more efficiently by anticipating traffic and road hazards. The better the software in the car, the safer everyone will be while riding in it. High demand for smart mobility products has resulted in increased demand for hardware, software, and services from all industries. Enterprises are looking to acquire technologies that will help them survive in this new industry, and a majority of them will make venture investments to move their business forward.
Smart Mobility Market Segment Overview
By Element
Based on element, the global smart mobility market has been segmented based on bike commuting, car sharing, and ride sharing. The car-sharing segment is the largest in the global smart mobility market.
By Solution Type
Based on solution type, the global smart mobility market has been segmented based on traffic management, parking management, mobility management, and others. The parking management segment is expected to be the fastest-growing in the global smart mobility market during the forecast period.
By Technology
Based on the Technology, the global smart mobility market has been segmented based on 3G & 4G, Wi-Fi, Global Positioning System (GPS), Radiofrequency Identification (RFID), Embedded system, and others. The global positioning system segment is anticipated to be the fastest-growing segment in the global smart mobility market during the period of 2022-2030.
Smart Mobility Market Regional Analysis
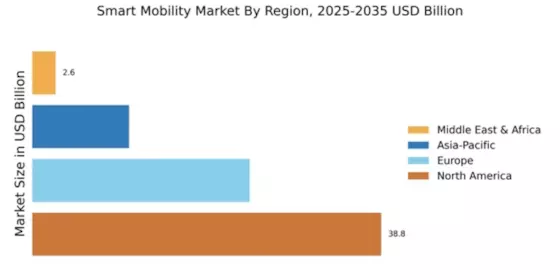
By region, the global smart mobility market has been divided into North America, Europe, Asia-Pacific, and the Rest of the World. The Asia Pacific region is estimated to hold a substantial market share in the global smart mobility business.
Asia-Pacific Market
Asia Pacific region is a vital region for the growth of the global smart mobility market. This is due to a rise in population, a growing middle-class population, and an increasing level of disposable income. Government initiatives coupled with the growing number of start-ups and rising VC investments will aid the growth of this market during the study period.
North America Market
North America is projected to witness a significant growth region in the global smart mobility market. First, the infotainment systems are gaining traction in this region. The market is moving towards the adoption of smart mobility systems, and technological advancements have made automotive systems more sophisticated and innovative.
Smart Mobility Market Competitive Landscape
The market comprises various national and international players. The market players are investing in R&D and also finding new ways to develop and improve product portfolios. Various players are entering into expansion, new product launches, joint ventures, and partnerships, to strengthen their market position and capture a large customer base.
Prominent players in the global smart mobility market include Cisco, Excelfore Corporation, Ford Motor Company, Innoviz Technologies. Inc., MAAS Global Oy, QuaLiX Information System, Robert Bosch GmbH, Siemens, TomTom International, and Toyota Motor Corporation among others.
Scope of the Report
Global Smart Mobility Market, by Element
Global Smart Mobility Market, by Solution Type
Global Smart Mobility Market, by Technology
Global Smart Mobility Market, by Region
Objectives of the Study
The objectives of the study are summarized in 5 stages. They are as mentioned below:
Market Size and Forecast:
To identify and estimate the market size for the global Smart Mobility Market segmented by element, technology, solution type, by value (in US dollars). Also, to understand the consumption/ demand created by consumers of Smart Mobility during the period of 2019-2030
Market Landscape and Trends:
To identify and infer, the drivers, restraints, opportunities, and challenges for the global Smart Mobility Market
Market Influencing Factors:
To find out the factors which are affecting the sales of Smart Mobility among consumers
Impact of COVID-19:
To identify and understand the various factors involved in the global Smart Mobility Market affected by the pandemic
Company Profiling:
To provide a detailed insight into the major companies operating in the market. The profiling will include the financial health of the company past 2-3 years with segmental and regional revenue breakup, product offering, recent developments, SWOT analysis, and key strategies
Intended Audience
Report Attribute/Metric | Details |
---|---|
Market Size | 2030: USD XX Billion |
CAGR | 20.5% |
Base Year | 2021 |
Forecast Period | 2022-2030 |
Historical Data | 2019, 2020 |
Forecast Units | Value (USD Million) |
Report Coverage | Revenue Forecast, Competitive Landscape, Growth Factors, and Trends |
Segments Covered | Element, Solution Type, Technology |
Geographies Covered | North America, Europe, Asia-Pacific, and Rest of the World (RoW) |
Key Vendors | Cisco, Excelfore Corporation, Ford Motor Company, Innoviz Technologies. Inc., MAAS Global Oy, QuaLiX Information System, Robert Bosch GmbH, Siemens, TomTom International, and Toyota Motor Corporation. |
Key Market Opportunities | Improved performance of autonomous vehicles |
Key Market Drivers | Increasing trend of on-demand transportation services |
Frequently Asked Questions (FAQ) :
The study period of the global Smart Mobility Market is 2019 - 2030
The global Smart Mobility Market is growing at a CAGR of ~ 20.5% over the next 9 years
Cisco, Excelfore Corporation, Ford Motor Company, Innoviz Technologies. Inc., MAAS Global Oy, QuaLiX Information System, Robert Bosch GmbH, Siemens, TomTom International, and Toyota Motor Corporation are the major companies operating in the global Smart Mobility Market.