Metal Recycling Market (2026 - 2035)

ID: MRFR/PCM/1633-CR 111 Pages Harshita Gorde Last Updated: October 17, 2026
Metal Recycling Market Research Report Information By Metal Type (Ferrous, Iron, Steel, Non-Ferrous, Copper, Aluminum, Lead, and Other Metal Types), and By End-use Industry (Construction, Automotive, Electrical and Electronics, Manufacturing and Industrial, Consumer Appliances, Aerospace and Defense, and Other End-use Industries) – Forecast Till 2035
Metal Recycling Market
Market Size
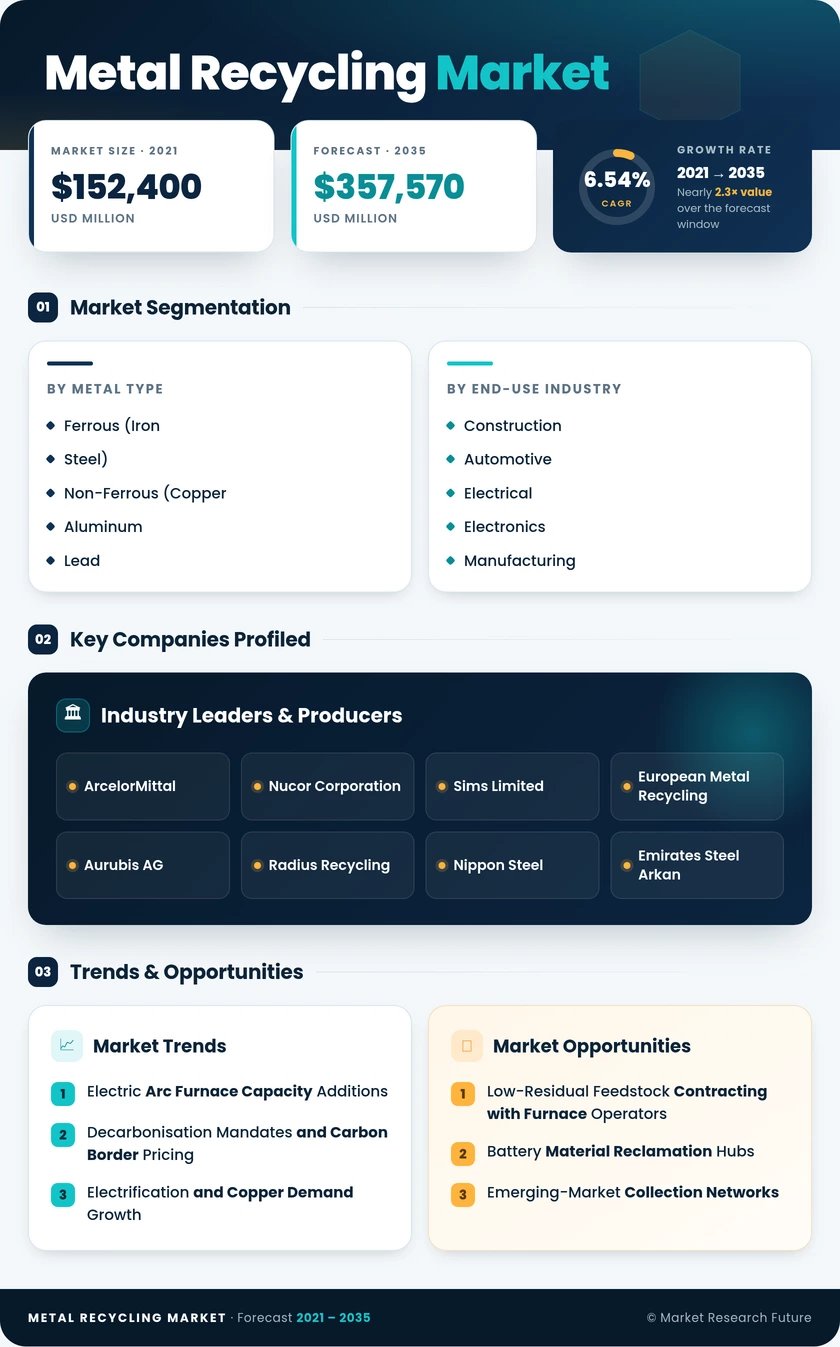
Forecast Period2026-2035
CAGR (2026-2035)6.54%
2025 Market SizeUSD 189,770 Million
2035 Market SizeUSD 357,570 Million
Key Players
ArcelorMittal
Nucor Corporation
Sims Limited
European Metal Recycling
Aurubis AG
Radius Recycling
Opportunities
  • Low-Residual Feedstock Contracting with Furnace Operators
  • Battery Material Reclamation Hubs
  • Emerging-Market Collection Networks
  1. 1 Market Summary | |
    1. 1.1 Study Assumptions and Market Definition | |
    2. 1.2 Scope of the Study | |
    3. 1.3 Research Methodology | |
  2. 2 Key Report Takeaways | |
    1. 2.1 By Metal Type | |
    2. 2.2 By End-use Industry | |
    3. 2.3 By Region | |
  3. 3 Market Size and Forecast (2021–2035) | |
    1. 3.1 Historical Market Size (2021–2024) | |
    2. 3.2 Base Year Assessment (2025) | |
    3. 3.3 Forecast Market Size (2026–2035) | |
    4. 3.4 Year-over-Year Growth Analysis | |
  4. 4 Driver Impact Analysis | |
    1. 4.1 Electric Arc Furnace Capacity Additions | |
    2. 4.2 Decarbonisation Mandates and Carbon Border Pricing | |
    3. 4.3 Electrification and Copper Demand Growth | |
    4. 4.4 Sensor-Based Sorting and AI Grade Detection | |
    5. 4.5 End-of-Life Vehicle and Battery Take-Back Rules | |
    6. 4.6 E-Waste Volume Expansion and Urban Mining | |
    7. 4.7 OEM Low-Residual Feedstock Contracting | |
  5. 5 Restraints Impact Analysis | |
    1. 5.1 Export Restrictions and National Levies | |
    2. 5.2 Contamination in Obsolete Grades | |
    3. 5.3 Collection Infrastructure Gaps | |
    4. 5.4 Price Volatility and Working-Capital Intensity | |
    5. 5.5 Energy Costs and Shredder Permitting Delays | |
  6. 6 Opportunities | |
    1. 6.1 Low-Residual Feedstock Contracting with Furnace Operators | |
    2. 6.2 Battery Material Reclamation Hubs | |
    3. 6.3 Emerging-Market Collection Networks | |
    4. 6.4 Grade Certification and Traceability Data Products | |
    5. 6.5 Selective Demolition and Teardown Services | |
  7. 7 Regional Market Share and Country-Level Analysis | |
    1. 7.1 Asia-Pacific | | |
      1. 7.1.1 China | | |
      2. 7.1.2 India | | |
      3. 7.1.3 Japan | | |
      4. 7.1.4 South Korea | | |
      5. 7.1.5 Malaysia | | |
      6. 7.1.6 Thailand | | |
      7. 7.1.7 Indonesia | | |
      8. 7.1.8 Vietnam | | |
      9. 7.1.9 Rest of Asia-Pacific | |
    2. 7.2 North America | | |
      1. 7.2.1 United States | | |
      2. 7.2.2 Canada | | |
      3. 7.2.3 Mexico | |
    3. 7.3 Europe | | |
      1. 7.3.1 Germany | | |
      2. 7.3.2 United Kingdom | | |
      3. 7.3.3 France | | |
      4. 7.3.4 Italy | | |
      5. 7.3.5 Spain | | |
      6. 7.3.6 Turkey | | |
      7. 7.3.7 NORDIC Countries | | |
      8. 7.3.8 Russia | | |
      9. 7.3.9 Rest of Europe | |
    4. 7.4 South America | | |
      1. 7.4.1 Brazil | | |
      2. 7.4.2 Argentina | | |
      3. 7.4.3 Rest of South America | |
    5. 7.5 Middle-East and Africa | | |
      1. 7.5.1 Saudi Arabia | | |
      2. 7.5.2 Qatar | | |
      3. 7.5.3 United Arab Emirates | | |
      4. 7.5.4 Egypt | | |
      5. 7.5.5 South Africa | | |
      6. 7.5.6 Rest of Middle-East and Africa | |
  8. 8 Future Outlook (2026–2035) | |
    1. 8.1 Autonomous Sorting and Yard Operations | |
    2. 8.2 Green Steel Premiums and Carbon-Accounted Feedstock | |
    3. 8.3 Electrification Supercycle and Non-Ferrous Tightness | |
    4. 8.4 Traceability, ESG Disclosure and Capital Access | |
  9. 9 Segmentation Analysis | |
    1. 9.1 By Metal Type | | |
      1. 9.1.1 Ferrous | | |
      2. 9.1.2 Non-Ferrous | |
    2. 9.2 By End-use Industry | | |
      1. 9.2.1 Construction | | |
      2. 9.2.2 Automotive | | |
      3. 9.2.3 Electrical and Electronics | | |
      4. 9.2.4 Manufacturing and Industrial | | |
      5. 9.2.5 Consumer Appliances | | |
      6. 9.2.6 Aerospace and Defense | | |
      7. 9.2.7 Other End-use Industries | |
  10. 10 Competitive Landscape | |
    1. 10.1 Market Concentration Analysis | |
    2. 10.2 Competitive Benchmarking Matrix | |
    3. 10.3 Company Profiles | |
  11. 11 Recent News and Developments | |
  12. 12 Report Scope and Methodology | |
  13. 13 Detailed Sources and Citations | |
  14. 14 Frequently Asked Questions | | LIST OF TABLES | |
  15. TABLE 1 Global Metal Recycling Market Size and Forecast (USD Million), 2021–2035 | |
  16. TABLE 2 Global Market Year-over-Year Growth Analysis, 2021–2035 | |
  17. TABLE 3 Driver Impact Analysis Matrix, 2026–2035 | |
  18. TABLE 4 Restraint Impact Analysis Matrix, 2026–2035 | |
  19. TABLE 5 Global Market Size, by Metal Type (USD Million), 2021–2035 | |
  20. TABLE 6 Global Market Size, by End-use Industry (USD Million), 2021–2035 | |
  21. TABLE 7 Global Market Size, by Region (USD Million), 2021–2035 | |
  22. TABLE 8 Asia-Pacific Market Size, by Country (USD Million), 2021–2035 | |
  23. TABLE 9 North America Market Size, by Country (USD Million), 2021–2035 | |
  24. TABLE 10 Europe Market Size, by Country (USD Million), 2021–2035 | |
  25. TABLE 11 South America Market Size, by Country (USD Million), 2021–2035 | |
  26. TABLE 12 Middle-East and Africa Market Size, by Country (USD Million), 2021–2035 | |
  27. TABLE 13 Asia-Pacific Market Size, by Metal Type (USD Million), 2021–2035 | |
  28. TABLE 14 Asia-Pacific Market Size, by End-use Industry (USD Million), 2021–2035 | |
  29. TABLE 15 North America Market Size, by Metal Type (USD Million), 2021–2035 | |
  30. TABLE 16 North America Market Size, by End-use Industry (USD Million), 2021–2035 | |
  31. TABLE 17 Europe Market Size, by Metal Type (USD Million), 2021–2035 | |
  32. TABLE 18 Europe Market Size, by End-use Industry (USD Million), 2021–2035 | |
  33. TABLE 19 South America Market Size, by Metal Type (USD Million), 2021–2035 | |
  34. TABLE 20 Middle-East and Africa Market Size, by End-use Industry (USD Million), 2021–2035 | |
  35. TABLE 21 Competitive Benchmarking Matrix, 2026 | |
  36. TABLE 22 Company Profiles — Key Players | |
  37. TABLE 23 Recent Developments and Strategic Announcements, 2023–2025 | |
  38. TABLE 24 Report Scope and Methodology Summary | |
  39. TABLE 25 Detailed Sources and Citations | | LIST OF FIGURES | |
  40. FIGURE 1 Market Dynamics — Drivers, Restraints and Opportunities | |
  41. FIGURE 2 Industry Value Chain Analysis | |
  42. FIGURE 3 Porter's Five Forces Analysis | |
  43. FIGURE 4 Global Market Size Trend (USD Million), 2021–2035 | |
  44. FIGURE 5 Year-over-Year Growth Curve, 2021–2035 | |
  45. FIGURE 6 Market Share by Metal Type, 2025 vs 2035 | |
  46. FIGURE 7 Market Share by End-use Industry, 2025 vs 2035 | |
  47. FIGURE 8 Regional Market Share, 2025 | |
  48. FIGURE 9 Regional CAGR Comparison, 2026–2035 | |
  49. FIGURE 10 Asia-Pacific Country-Level Share Distribution, 2025 | |
  50. FIGURE 11 Europe Country-Level Share Distribution, 2025 | |
  51. FIGURE 12 Competitive Landscape — Estimated Revenue Share Bands, 2026 | |
  52. FIGURE 13 Strategic Positioning Matrix — Leading Processors

Segmentation Quick Reference

DimensionSub-SegmentsDominant SegmentFastest Growing Segment
By Metal TypeFerrous (Iron, Steel); Non-Ferrous (Copper, Aluminum, Lead, Other Metal Types)Ferrous — 65.9% share (2025)Non-Ferrous — 6.65% CAGR (2026–2035)
By End-use IndustryConstruction; Automotive; Electrical and Electronics; Manufacturing and Industrial; Consumer Appliances; Aerospace and Defense; Other End-use IndustriesConstruction — 35.4% share (2025)Electrical and Electronics — 6.78% CAGR (2026–2035)


Market Segmentation Overview

By Metal Type

Sub-SegmentKey Trend
FerrousFurnace charge standardisation and low-residual certification
IronFoundry casting demand stabilises volumes
SteelLargest single flow; tied to rebar and flat-product output
Non-FerrousFastest expansion on electrification and lightweighting
CopperPersistent refined deficit sustains premium realisations
AluminumTake-back laws secure volume; lacquer limits alloy yield
LeadClosed-loop battery collection near universal in mature markets
Other Metal TypesTitanium and nickel superalloy returns in narrow channels


Ferrous leads this dimension at 65.9% of 2025 value because Steel and Iron flows dwarf every other stream and furnace buyers specify them against long-established grade conventions. Non-Ferrous grows fastest at a 6.65% CAGR, pulled by Copper, where grid and data-centre cabling demand has outrun mine supply, and supported by Aluminum volumes secured under beverage-can take-back legislation. The commercial divide inside the dimension is analytical capability: yards that can certify residual copper below 0.15% sell Steel at contract premiums, while those relying on visual grading are pushed into discounted mixed loads. Lead and Other Metal Types remain small but strategically useful, since both trade through closed-loop arrangements insulated from spot volatility.

By End-use Industry

Sub-SegmentKey Trend
ConstructionDemolition mandates favour selective teardown over crushing
AutomotiveEnd-of-life directives push mass recovery above 95%
Electrical and ElectronicsE-waste concentrates rival mined ore in contained value
Manufacturing and IndustrialPrompt returns offer the cleanest, most predictable feed
Consumer AppliancesReplacement cycles shorten, lifting white-goods returns
Aerospace and DefenseSuperalloy returns move through closed mill contracts
Other End-use IndustriesPackaging, marine and agricultural retirement streams


Construction holds 35.4% of 2025 consumption, reflecting bridge replacement, metro expansion, and urban renewal programmes that generate structural beams and plate in volumes no other end use matches. Electrical and Electronics advances fastest at a 6.78% CAGR because circuit-board concentrates carry high contained value and data-centre construction consumes copper busbar at record rates, which favours refiners with multi-element separation capability. Automotive sits between the two: volumes are predictable and dismantler yields exceed 95% under end-of-life vehicle rules, but growth tracks fleet retirement curves rather than policy shifts. Manufacturing and Industrial returns remain the preferred feed for buyers chasing consistency, since prompt material arrives with known composition and requires minimal sorting before charge.




Download PDF ×

We do not share your information with anyone. However, we may send you emails based on your report interest from time to time. You may contact us at any time to opt-out.