• Cat-intel
  • MedIntelliX
  • Resources
  • About Us
  • Hero Background
    English
    Chinese
    French
    Japanese
    Korean
    German
    Spanish

    Metal Carboxylates Market Size

    ID: MRFR/CnM/6953-CR
    203 Pages
    Anshula Mandaokar
    March 2023

    Metal Carboxylates Market Research Report Information By product Type (Primary Drier Metals, Through Drier Metals, Auxiliary Drier Metals, Cobalt, Manganese, Iron and others), By Application (Catalysts, Lubricant Additives, Driers, Plastic Stabilizers, Polyester Accelerators, Fuel Additives, and Others) And By Region (North America, Europe, Asia-Pacific, Latin America And Middle East & Afri...

    Share:
    Download PDF ×

    We do not share your information with anyone. However, we may send you emails based on your report interest from time to time. You may contact us at any time to opt-out.

    Metal Carboxylates Market Infographic
    $ 4,950.0
    $ 5,950.0
    $ 7,250.0

    Metal Carboxylates Size

    Metal Carboxylates Market Growth Projections and Opportunities

    Various factors influence the growth and dynamics of the Metal Carboxylates Market. The fact that metal carboxylates are used widely as catalysts and stabilizers in the production of polymers, resins and coatings is a key driver. These compounds, known as metal soaps, have excellent catalytic as well as stabilizing properties which are essential in the manufacturing processes of many industrial products. On the other hand, the demand for metal carboxylates is influenced by the growth in end-use industries such as paints and coatings, plastics and adhesives which has led to market expansion. In 2021, Metal Carboxylates Market Size was valued at USD 5,271 million. The Metal Carboxylates market size will grow from USD 5,271.6 million in 2022 to USD 7,964.2 million in 2030 at a CAGR of 5.28%. Additionally, construction industry especially contributes to shaping of this market of metal carboxylates. This results into coatings with long lasting attributes that enhance durability and aesthetic appeal on architectural structures since these agents are extensively employed as driers alongside paints or varnishes [8]. Worldwide increase in construction activities caused by urbanization coupled with infrastructural development and rehabilitation projects drives up demand for metal carboxylates based corrosion resistant coatings with improved drying times. Moreover, automotive sector is one of themajor consumer areas for metal carboxylates since they find wide usage within automobiles’ coating industry . These substances act like cross linkers or stabilizers that help enhance performance properties including adhesion strength resistance against rusting or weathering resistance [8]. Automobile manufacturers increasingly put emphasis on excellence finishings together with durability thereby raising demand for metallic salt catalysts applicable to automobile paints. The overall growth of chemical industry is also contributing factor for metal carboxylates due to its application in different chemical processes. Metal carboxylates function as catalysts and reaction accelerators during the synthesis of polymers, polyesters and other chemicals. The vast range of applications for metal carboxylates make them vital components in chemical manufacturing which determines the overall market dynamics. Moreover, the global shift towards environmentally friendly solutions and regulatory considerations also impact on the metal carboxylates market. The demand for metal carboxylates that are eco-friendly is rising due to tightening environmental regulations. Manufacturers are developing formulations that contain no heavy metals and are low in volatile organic compounds (VOC) to comply with environment regulations as well as cater for the preference of industries and consumers who prefer sustainable products. Consequently, some challenges may be faced by the metal carboxylate market due to some factors such as fluctuation in prices of raw materials notably metals along with economic uncertainties that might occur. This can also affect production costs of these substances[3]. On the other hand, general economic instability may cause changes within industry thereby influencing overall consumption levels for all types of these compounds.
    Metal Carboxylates Market Size Graph

    Market Summary

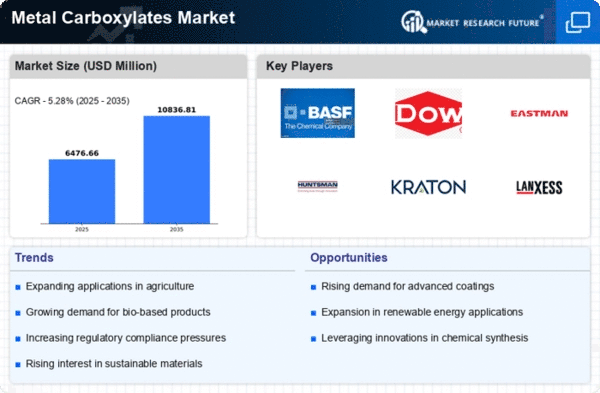
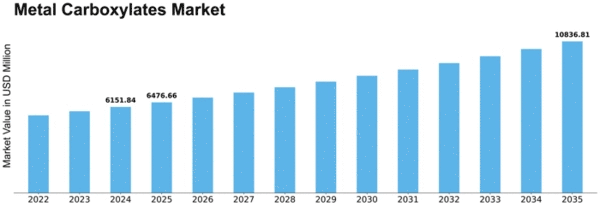
    As per Market Research Future Analysis, the Global Metal Carboxylates Market was valued at USD 6151.84 million in 2024 and is projected to reach USD 10836.81 million by 2035, growing at a CAGR of 5.28% from 2025 to 2035. The market is primarily driven by the building and construction industry, where metal carboxylates are used for structural protection. The demand for coatings in China and India, along with the rising need for fuel and lubricant additives, significantly influences market growth. Cobalt carboxylates dominate the market, although increasing regulations are pushing for cobalt-free alternatives. The Asia-Pacific region holds the largest market share, accounting for 44.0% in 2021.

    Key Market Trends & Highlights

    The Metal Carboxylates market is witnessing significant trends driven by environmental regulations and industrial demand.

    • Asia-Pacific accounted for USD 2,320.5 million in 2021, with a projected CAGR of 5.3% from 2022 to 2030. Cobalt segment held the largest market share in 2021, but demand for cobalt-free alternatives is increasing. Growing demand for fuel additives is driven by rising hydrocarbon fuel needs for transportation and power generation. The construction industry is a major application area, utilizing metal carboxylates for protective coatings.

    Market Size & Forecast

    2024 Market Size USD 6151.84 million
    2035 Market Size USD 10836.81 million
    CAGR (2025-2035) 5.28%
    Largest Regional Market Share in 2021 Asia-Pacific (44.0%).

    Major Players

    <p>Key players include Organometals, DIC CORPORATION, DURA Chemicals, Inc., NICHIA CORPORATION, Comar Chemicals, EGE KIMYA, The Shepherd Chemical Company, Borchers Inc., Baerlocher, Patcham, and Nihon Kagayu Sangyo.</p>

    Market Trends

    GROWING DEMAND FOR ADDITIVES IN LUBRICATING OILS AND GREASES

    According to the U.S. EPA, the typical passenger vehicle emits about 4.6 metric tons of carbon dioxide per year. With passenger vehicles composing 93% of the estimated 1.2 billion vehicles globally, the amount of carbon emissions from passenger vehicles alone climbs to a concerning total. With carbon emissions rising rapidly since the Industrial Revolution, stringent environmental regulations are being enforced. Fuel additives demand is driven by increasing demand of hydrocarbon fuels for heat and power generation from transportation and power generation. Additives are used to enhance performance and correct the deficiencies of fuels or lubricants used in several applications.

    In addition, with the widespread inclusion of biodiesel as part of the diesel fuel blend due to the rising environmental concerns will also necessitate the use of fuel additives. Similarly, with the increase in use of marine and aviation transport, lubricant additives are also gaining an upsurge demand. moreover, with the aging transportation fleet, its demand will rise subsequently in the future. Thus, with growing demand for fuel and lubricant additives, the market for metal carboxylates such as iron and manganese carboxylates are likely to grow as metal carboxylate are vital functional additives.

    Thus, increasing demand in the lubricating oils and greases industry is a factor driving the growth of the metal carboxylates market revenue.

    <p>The increasing demand for eco-friendly and sustainable materials in various industries appears to drive the growth of the metal carboxylates market, as these compounds are recognized for their versatility and effectiveness in applications ranging from agriculture to coatings.</p>

    U.S. Environmental Protection Agency

    Metal Carboxylates Market Market Drivers

    Rising Demand in Agriculture

    The Global Metal Carboxylates Market Industry is experiencing a surge in demand due to the increasing utilization of metal carboxylates as effective agricultural additives. These compounds serve as essential components in fertilizers and pesticides, enhancing nutrient absorption and crop yield. As global food production needs escalate, driven by population growth and changing dietary patterns, the market for metal carboxylates is projected to grow. This trend is particularly evident in regions with intensive agricultural practices, where the market is expected to contribute significantly to the overall growth of the industry.

    Growth in Coatings and Paints Sector

    The Global Metal Carboxylates Market Industry benefits from the expanding coatings and paints sector, where metal carboxylates are utilized as drying agents and catalysts. The increasing demand for high-performance coatings in automotive, construction, and industrial applications drives this growth. As environmental regulations become more stringent, the shift towards eco-friendly and low-VOC formulations further propels the adoption of metal carboxylates. This sector is anticipated to play a crucial role in the market's expansion, with projections indicating a market value of 6.15 USD Billion in 2024, reflecting the growing significance of these compounds in modern coatings.

    Market Trends and Growth Projections

    Emerging Markets and Global Expansion

    The Global Metal Carboxylates Market Industry is poised for growth as emerging markets, particularly in Asia-Pacific and Latin America, continue to expand their industrial bases. Increased urbanization and economic development in these regions are driving demand for metal carboxylates across various applications, including agriculture, coatings, and pharmaceuticals. As these markets mature, the adoption of advanced chemical products is likely to rise, further fueling the industry's growth. This trend suggests a promising outlook for metal carboxylates, as they become integral to the evolving industrial landscape in these regions.

    Advancements in Chemical Manufacturing

    Technological advancements in chemical manufacturing processes are poised to enhance the production efficiency of metal carboxylates, thereby impacting the Global Metal Carboxylates Market Industry positively. Innovations such as green chemistry and sustainable production methods are likely to reduce costs and improve yield. This evolution in manufacturing practices aligns with global sustainability goals, making metal carboxylates more appealing to manufacturers and consumers alike. As these advancements continue, the market is expected to witness a compound annual growth rate of 5.28% from 2025 to 2035, indicating a robust future for the industry.

    Increasing Applications in Pharmaceuticals

    The Global Metal Carboxylates Market Industry is witnessing growth due to the expanding applications of metal carboxylates in the pharmaceutical sector. These compounds are utilized as intermediates in drug synthesis and as stabilizers in formulations. The rising demand for innovative drug delivery systems and the development of new therapeutics are driving this trend. As pharmaceutical companies seek to enhance the efficacy and stability of their products, the role of metal carboxylates becomes increasingly critical. This sector's growth is expected to contribute significantly to the overall market, particularly as the industry anticipates reaching a value of 10.8 USD Billion by 2035.

    Market Segment Insights

    Metal Carboxylates Product Type Insights

    <p>The Metal Carboxylates Market segmentation, based on product type, includes Primary Drier Metals, Through Drier Metals, Auxiliary Drier Metals, Cobalt, Manganese, Iron and others. The cobalt segment accounted for the largest market share in 2021, in the Metal Carboxylates Market revenue. As demand for cobalt-free alternatives has continued to accelerate across the industry due to Increasing regulations and rising cost of cobalt, the growth of the metal carboxylates market will be hampered to a large extent as cobalt carboxylates make up majority of the metal carboxylates market.</p>

    <p>Nevertheless, with the increasing research and development activities surrounding carboxylates, companies will see new opportunities for emerging applications.</p>

    Metal Carboxylates Application Insights

    <p>The Metal Carboxylates Market segmentation, based on application, includes into catalysts, lubricant additives, driers, plastic stabilizers, polyester accelerators, fuel additives, and others. The metal carboxylates are used in various applications. They occupy the largest share among the drier applications and are used to accelerate the drying process, resist loss-of-dry, and improve the film properties as for instance gloss and film hardness. High-end coatings are widely used in the construction, automotive &amp; transportation, and wood industries. They have a major application in the building and construction industry, where they are used to protect structures from any external damage.</p>

    <p>Figure 2 Metal Carboxylates Market, by Application, 2021 &amp; 2030 (USD Million)Source Secondary Research, Primary Research, Market Research Future Database and Analyst Review</p>

    <p>Fuel additives demand is driven by increasing demand of hydrocarbon fuels for heat and power generation from transportation and power generation. Additives are used to enhance performance and correct the deficiencies of fuels or lubricants used in several applications. In addition, with the widespread inclusion of biodiesel as part of the diesel fuel blend due to the rising environmental concerns will also necessitate the use of fuel additives.</p>

    Get more detailed insights about Metal Carboxylates Market Global Research Report - Forecast till 2034

    Regional Insights

    By Region, the study segments the market into North America, Europe, Asia-Pacific and Rest of the World.  Among these, Asia-Pacific dominated the market with a share of 44.0%, accounting for USD 2,320.5 million in 2021; it is expected to register the highest CAGR of 5.3% from 2022 to 2030. North America was the second largest with a share in 2021. The North American market is mainly driven by the availability of raw materials and increasing demand for Metal Carboxylates across the region for various applications.

    Further, the major countries studied are The U.S, Canada, Germany, France, UK, Italy, Spain, China, Japan, India, Australia, South Korea, and Brazil.

    Figure 3 METAL CARBOXYLATES MARKET SHARE BY REGION 2021 (%)METAL CARBOXYLATES MARKET SHARE BY REGION 2021Source Secondary Research, Primary Research, Market Research Future Database and Analyst Review

    Key Players and Competitive Insights

    Major market players have large production bases and advanced manufacturing facilities at the domestic and international levels. This helps them supply the product to various end users across the globe within less time as compared to the small-scale manufacturers, providing a competitive edge in the global market. The leading producers of merchant Metal Carboxylates are US, and Canada. According to MRFR analysis, the Metal Carboxylates Market has a huge revenue base in European countries.

    One of the primary business strategies adopted by manufacturers in the Metal Carboxylates Market to benefit clients and expand the metal carboxylates market sector is to manufacture locally to reduce operating costs. Intense competition, rapid advances in technology, frequent changes in government policies, and environmental regulations are key factors that confront market growth.

    Organometals, DIC CORPORATION, DURA Chemicals, Inc., NICHIA CORPORATION, Comar Chemicals, EGE KIMYA, The Shepherd Chemical Company, Borchers Inc., Baerlocher, Patcham, and Nihon Kagayu Sangyo among others are the prominent players operating in the Metal Carboxylates Market. These players account for a significant share of the global market owing to their large production capabilities, global revenue base, and global distribution network.

    Also, DIC was one of the first Japanese printing ink manufacturers to establish a presence in other parts of Asia. In 1986, Sun Chemical Corp., a leading manufacturer of printing inks, joined the DIC Group. Since then, additional acquisition-including the Coates Group in 1999- have reinforced DIC's position as one of the world's preeminent fine chemicals companies. The company has 189 group companies in 63 countries and territories worldwide. The Group also has operating sites all over the world including the PRC, Asia Pacific, Europe, and the Americas besides Japan where the DIC HQ is located.

    At present, DIC is focusing its expansion efforts on promising growth markets in Asia to strengthen core businesses, and is also establishing a presence in such emerging markets as Central and Eastern Europe, South America and the Middle East.   

    Key Companies in the Metal Carboxylates Market market include

    Industry Developments

    February 2021 DIC Corporation has commenced a partnership with Good Chemistry Company—a Canadian start-up based in Vancouver, British Columbia. Good Chemistry is building a platform that integrates quantum computing, artificial intelligence (AI) and cloud computing, to perform quantum chemistry simulations, with the goal of leveraging quantum technology to expand its materials development business.

    April 2021 Arxada, a leading global specialty chemicals business, has combined with Troy Corporation, a global leader in microbial control solutions and performance additives. The combination creates a comprehensive and innovative offering in Arxada’s Microbial Control Solutions (‘MCS’) business, enabling the delivery of new solutions and value-added services to customers. Arxada will benefit from Troy’s technical expertise, trusted customer relationships and broad portfolio of performance products as well as its long history of innovation, including the invention of 3-iodo propynyl butyl carbamate (IPBC).

    Troy brings five new production sites across the world, four Research and Development centers, and approximately 650 employees, enhancing Arxada’s commercial presence across the globe to further accelerate the Company’s innovation capabilities and better serve customer needs.

    March 2021 Baerlocher is expanding its production site in Dewas in the Indian state of Madhya Pradesh. After the last expansion at the beginning of the year 2020, this new expansion is a strong commitment for the engagement of the Baerlocher Group in India.

    Future Outlook

    Metal Carboxylates Market Future Outlook

    <p>The Metal Carboxylates Market is projected to grow at a 5.28% CAGR from 2025 to 2035, driven by increasing demand in agriculture, coatings, and pharmaceuticals.</p>

    New opportunities lie in:

    • <p>Develop eco-friendly metal carboxylates for sustainable agriculture solutions. Innovate applications in advanced coatings for enhanced durability and performance. Expand into emerging markets with tailored formulations for local industries.</p>

    <p>By 2035, the Metal Carboxylates Market is expected to achieve robust growth, reflecting evolving industry needs.</p>

    Market Segmentation

    Metal Carboxylates Regional Outlook

    • {"North America"=>["US"
    • "Canada"]}
    • {"Europe"=>["Germany"
    • "France"
    • "UK"
    • "Italy"
    • "Spain"
    • "Rest of Europe"]}
    • {"Asia-Pacific"=>["China"
    • "Japan"
    • "India"
    • "Australia"
    • "South Korea"
    • "Rest of Asia-Pacific"]}
    • {"Latin America"=>["Mexico"
    • "Argentina"
    • "Brazil"
    • "Rest of Latin America"]}
    • {"Middle East & Africa"=>["GCC Countries"
    • "South Africa"
    • "Rest of Middle East & Africa"]}

    Metal Carboxylates Application Outlook

    • Catalysts
    • Lubricant Additives
    • Driers
    • Plastic Stabilizers
    • Polyester Accelerators
    • Fuel Additives
    • Others

    Metal Carboxylates Product Type Outlook

    • Primary Drier Metals
    • Through Drier Metals
    • Auxiliary Drier Metals
    • Cobalt
    • Manganese
    • Iron
    • Others

    Report Scope

    Report Attribute/MetricDetails
    Market Size 2024USD 6,151.84 million
    Market Size 2025USD 6,476.78 million
    Market Size 203510836.81
    Compound Annual Growth Rate (CAGR)5.28% (2025 - 2035)
    Base Year2024
    Forecast Period2025 - 2035
    Historical Data2020 & 2024
    Forecast UnitsValue (USD Billion)
    Report CoverageRevenue Forecast, Competitive Landscape, Growth Factors, and Trends
    Segments CoveredProduct Type, Application, and Region
    Geographies CoveredNorth America, Europe, Asia Pacific, Latin America and Middle East & Africa
    Countries CoveredThe U.S, Canada, Germany, France, UK, Italy, Spain, China, Japan, India, Australia, South Korea, and Brazil
    Key Companies ProfiledOrganometals, DIC CORPORATION, DURA Chemicals, Inc.,  NICHIA CORPORATION, Comar Chemicals, EGE KIMYA,        The Shepherd Chemical Company, Borchers Inc., Baerlocher, Patcham, Nihon Kagayu Sangyo, and Others
    Key Market OpportunitiesResearch & development related to metal carboxylates
    Key Market DynamicsGrowing demand for additives in lubricating oils and greases Increasing demand of high-end coatings across various end-use industries

    Market Highlights

    Author

    Anshula Mandaokar
    Team Lead - Research

    She holds an experience of about 6+ years in market research and business consulting, working under the spectrum of information communication technology, telecommunications and semiconductor domains. aarti conceptualizes and implements a scalable business strategy and provides strategic leadership to the clients. her expertise lies in market estimation, competitive intelligence, pipeline analysis, customer assessment, etc.

    Leave a Comment

    Latest Comments

    John Doe
    john@example.com

    This is a great article! Really helped me understand the topic better.

    Posted on July 23, 2025, 10:15 AM
    Jane Smith
    jane@domain.com

    Thanks for sharing this. I’ve bookmarked it for later reference.

    Posted on July 22, 2025, 7:45 PM

    FAQs

    How much is the Metal Carboxylates market?

    USD 6,151.84 million in 2024

    How Big is the U.S Metal Carboxylates market?

    USD 1074 million

    What is the growth rate of the Metal Carboxylates market?

    5.3%

    Which region held the largest market share in the Metal Carboxylates market?

    Asia-Pacific

    Who are the key players in the Metal Carboxylates market?

    Organometals, DIC CORPORATION, DURA Chemicals, Inc., NICHIA CORPORATION, Comar Chemicals, EGE KIMYA, The Shepherd Chemical Company, Borchers Inc., Baerlocher, Patcham, Nihon Kagayu Sangyo, and Others

    1. Table of Contents
    2. Executive Summary 18
      1. MARKET ATTRACTIVENESS ANALYSIS 20
        1. GLOBAL METAL CARBOXYLATES MARKET, BY PRODUCT TYPE 21
        2. GLOBAL METAL CARBOXYLATES MARKET, BY APPLICATION 22
    3. Market Introduction 23
      1. DEFINITION 23
      2. Scope of the Study 23
      3. MARKET STRUCTURE 23
    4. Research Methodology 24
      1. RESEARCH PROCESS 24
      2. PRIMARY RESEARCH 25
      3. SECONDARY RESEARCH 26
      4. MARKET SIZE ESTIMATION 27
      5. FORECAST MODEL 28
      6. LIST OF ASSUMPTIONS 29
    5. MARKET INSIGHTS 30
    6. MARKET DYNAMICS 33
      1. INTRODUCTION 33
      2. DRIVERS 34
        1. 1.2.1. GROWING DEMAND FOR ADDITIVES IN LUBRICATING OILS AND GREASES 34
        2. NCREASING DEMAND OF HIGH-END COATINGS ACROSS VARIOUS END-USE INDUSTRIES 34
        3. DRIVERS IMPACT ANALYSIS 34
      3. RESTRAINTS 35
        1. 1.2.3. INCREASING REGULATIONS AND RISING COST OF COBALT 35
        2. RESTRAINTS IMPACT ANALYSIS 35
      4. OPPORTUNITIES 35
        1. 1.3.1. RESEARCH & DEVELOPMENT RELATED TO METAL CARBOXYLATES 35
      5. CHALLENGES 36
        1. DEVELOPMENT OF METAL CARBOXYLATES PRODUCTS WITH LOW TOXIC CONTENT 36
      6. COVID-19 IMPACT ANALYSIS 36
        1. IMPACT ON METAL CARBOXYLATES MARKET 36
        2. IMPACT ON SUPPLY CHAIN OF METAL CARBOXYLATES MARKET 36
        3. PRICE VARIATION OF KEY RAW MATERIALS 36
        4. IMPACT ON END-USERS OF METAL CARBOXYLATES MARKET 37
    7. MARKET FACTOR ANALYSIS 38
      1. SUPPLY/VALUE CHAIN ANALYSIS 38
        1. DEVELOPMENT 39
        2. RAW MATERIAL SUPPLY 39
        3. MANUFACTURING 39
        4. SALES & DISTRIBUTION 39
        5. END CONSUMERS 39
      2. PORTER’S FIVE FORCES MODEL 40
        1. THREAT OF NEW ENTRANTS 40
        2. BARGAINING POWER OF SUPPLIERS 40
        3. BARGAINING POWER OF BUYERS 41
        4. THREAT OF SUBSTITUTES 41
        5. INTENSITY OF RIVALRY 41
    8. GLOBAL METAL CARBOXYLATES MARKET, BY PRODUCT TYPE 42
      1. OVERVIEW 42
      2. PRIMARY DRIER METALS 43
        1. PRIMARY DRIER METALS: MARKET ESTIMATES & FORECAST BY TYPE, 2019-2030 43
      3. THROUGH DRIER METALS 44
        1. THROUGH DRIER METALS: MARKET ESTIMATES & FORECAST BY TYPE, 2019-2030 44
      4. AUXILIARY DRIER METALS 46
        1. AUXILIARY DRIER METALS: MARKET ESTIMATES & FORECAST BY REGION/COUNTRY, 2019-2030 46
      5. COBALT 47
        1. COBALT: MARKET ESTIMATES & FORECAST BY REGION/COUNTRY, 2019-2030 47
      6. MANGANESE 48
        1. MANGANESE: MARKET ESTIMATES & FORECAST BY REGION/COUNTRY, 2019-2030 48
      7. IRON 48
        1. IRON: MARKET ESTIMATES & FORECAST BY REGION/COUNTRY, 2019-2030 48
      8. OTHERS 49
        1. OTHERS: MARKET ESTIMATES & FORECAST BY REGION/COUNTRY, 2019-2030 49
    9. GLOBAL METAL CARBOXYLATES MARKET, BY APPLICATION 50
      1. OVERVIEW 50
      2. CATALYSTS 51
        1. CATALYSTS: MARKET ESTIMATES & FORECAST BY REGION/COUNTRY, 2019-2030 51
      3. LUBRICANT ADDITIVES 51
        1. LUBRICANT ADDITIVES: MARKET ESTIMATES & FORECAST BY REGION/COUNTRY, 2019-2030 51
      4. DRIERS 52
        1. DRIERS: MARKET ESTIMATES & FORECAST BY REGION/COUNTRY, 2019-2030 52
      5. PLASTIC STABILIZERS 53
        1. PLASTIC STABILIZERS: MARKET ESTIMATES & FORECAST BY REGION/COUNTRY, 2019-2030 53
      6. POLYESTER ACCELERATORS 54
        1. POLYESTER ACCELERATORS: MARKET ESTIMATES & FORECAST BY REGION/COUNTRY, 2019-2030 54
      7. FUEL ADDITIVES 54
        1. FUEL ADDITIVES: MARKET ESTIMATES & FORECAST BY REGION/COUNTRY, 2019-2030 54
      8. OTHER APPLICATIONS 55
        1. OTHER APPLICATIONS: MARKET ESTIMATES & FORECAST BY REGION/COUNTRY, 2019-2030 55
    10. GLOBAL METAL CARBOXYLATES MARKET, BY REGION 56
      1. OVERVIEW 56
      2. NORTH AMERICA 57
        1. U.S. 59
        2. CANADA 61
      3. EUROPE 63
        1. GERMANY 65
        2. U.K. 67
        3. FRANCE 68
        4. SPAIN 70
        5. ITALY 71
        6. RUSSIA 73
        7. BELGIUM 74
        8. POLAND 76
        9. REST OF EUROPE 77
      4. ASIA PACIFIC 79
        1. CHINA 82
        2. JAPAN 83
        3. INDIA 85
        4. SOUTH KOREA 86
        5. THAILAND 88
        6. AUSTRALIA & NEW ZEALAND 89
        7. REST OF ASIA-PACIFIC 91
      5. LATIN AMERICA 93
        1. BRAZIL 95
        2. MEXICO 96
        3. ARGENTINA 98
        4. REST OF LATIN AMERICA 99
      6. MIDDLE EAST & AFRICA 102
        1. GCC COUNTRIES 104
        2. SOUTH AFRICA 105
        3. REST OF MEA 107
    11. Competitive Landscape 109
      1. COMPETITIVEOVERVIEW 109
      2. KEY DEVELOPMENTS & GROWTH STRATEGIES 109
        1. COLLABORATIONS /ACQUISTIONS /PRODUCT LAUNCHES 109
    12. COMPANY PROFILES 111
      1. ORGANOMETAL S.A. 111
        1. COMPANY OVERVIEW 111
        2. PRODUCTS OFFERED 111
        3. SWOT ANALYSIS 112
      2. DIC CORPORATION 113
        1. COMPANY OVERVIEW 113
        2. FINANCIAL OVERVIEW 113
        3. PRODUCTS/SERVICES OFFERED 114
        4. SWOT ANALYSIS 115
        5. KEY DEVELOPMENTS 115
      3. DURA CHEMICALS, INC. 116
        1. COMPANY OVERVIEW 116
        2. PRODUCTS/SERVICES OFFERED 116
        3. SWOT ANALYSIS 120
        4. KEY DEVELOPMENTS 120
      4. MATSUO SANGYO CO LTD 121
        1. COMPANY OVERVIEW 121
        2. PRODUCTS OFFERED 121
        3. SWOT ANALYSIS 122
      5. NICHIA CORPORATION 123
        1. COMPANY OVERVIEW 123
        2. FINANCIAL OVERVIEW 123
        3. PRODUCTS/SERVICES OFFERED 124
        4. SWOT ANALYSIS 124
      6. COMAR CHEMICALS 125
        1. COMPANY OVERVIEW 125
        2. PRODUCTS/SERVICES OFFERED 125
        3. SWOT ANALYSIS 126
      7. EGE KIMYA 127
        1. COMPANY OVERVIEW 127
        2. PRODUCTS/SERVICES OFFERED 127
        3. SWOT ANALYSIS 128
      8. THE SHEPHERD CHEMICAL COMPANY 129
        1. COMPANY OVERVIEW 129
        2. PRODUCTS/SERVICES OFFERED 129
        3. SWOT ANALYSIS 130
      9. BORCHERS INC. 131
        1. COMPANY OVERVIEW 131
        2. PRODUCTS OFFERINGS 131
        3. SWOT ANALYSIS 132
        4. KEY DEVELOPMENTS 133
      10. BAERLOCHER 134
        1. COMPANY OVERVIEW 134
        2. PRODUCTS OFFERINGS 134
        3. SWOT ANALYSIS 135
        4. KEY DEVELOPMENTS 135
      11. PATCHAM 136
        1. COMPANY OVERVIEW 136
        2. PRODUCTS OFFERINGS 136
        3. SWOT ANALYSIS 138
      12. NIHON KAGAYU SANGYO 139
        1. COMPANY OVERVIEW 139
        2. PRODUCTS OFFERINGS 139
        3. SWOT ANALYSIS 140
        4. FINACIAL INFORMATION 140
        5. KEY DEVELOPMENTS 141
      13. CHEMELYNE SPPECIALITIES 142
        1. COMPANY OVERVIEW 142
        2. PRODUCTS OFFERED 142
        3. SWOT ANALYSIS 143
      14. OPTICHEM 144
        1. COMPANY OVERVIEW 144
        2. PRODUCTS OFFERINGS 144
        3. SWOT ANALYSIS 145
        4. KEY DEVELOPMENTS 145
      15. JUSTUS KIMIARAYA 146
        1. COMPANY OVERVIEW 146
        2. PRODUCTS OFFERINGS 146
        3. SWOT ANALYSIS 147
      16. PAU THAI 148
        1. COMPANY OVERVIEW 148
        2. PRODUCTS OFFERED 148
        3. SWOT ANALYSIS 150
      17. TROY 151
        1. COMPANY OVERVIEW 151
        2. PRODUCTS/SERVICES OFFERED 151
        3. SWOT ANALYSIS 153
        4. KEY DEVELOPMENTS 153
      18. DALIAN FIRST ORGANIC CHEMICAL CO.,LTD 154
        1. COMPANY OVERVIEW 154
        2. PRODUCTS/SERVICES OFFERED 154
        3. SWOT ANALYSIS 155
      19. TAEKWANG FINE CHEMICAL CO., LTD 156
        1. COMPANY OVERVIEW 156
        2. FINANCIAL OVERVIEW 156
        3. PRODUCTS OFFERED 157
        4. SWOT ANALYSIS 157
      20. MIRACEMA-NUODEX 158
        1. COMPANY OVERVIEW 158
        2. PRODUCTS/SERVICES OFFERED 158
        3. SWOT ANALYSIS 159
      21. VENATOR 160
        1. COMPANY OVERVIEW 160
        2. FINANCIAL OVERVIEW 160
        3. PRODUCTS/SERVICES OFFERED 161
        4. SWOT ANALYSIS 161
    13. List of Tables and Figures
      1. LIST OF TABLES
      2. TABLE 1 LIST OF ASSUMPTIONS 29
      3. TABLE 2 PRIMARY DRIER METALS MARKET ESTIMATES & FORECAST, BY TYPE, 2019-2030 (USD MILLION) 43
      4. TABLE 3 COBALT MARKET ESTIMATES & FORECAST, BY TYPE, 2019-2030 (USD MILLION) 43
      5. TABLE 4 MANGANESE MARKET ESTIMATES & FORECAST, BY REGION, 2019-2030 (USD MILLION) 43
      6. TABLE 5 IRON MARKET ESTIMATES & FORECAST, BY REGION, 2019-2030 (USD MILLION) 44
      7. TABLE 6 OTHER PRIMARY DRIER METALS MARKET ESTIMATES & FORECAST, BY TYPE, 2019-2030 (USD MILLION) 44
      8. TABLE 7 THROUGH DRIER METALS MARKET ESTIMATES & FORECAST, BY TYPE, 2019-2030 (USD MILLION) 44
      9. TABLE 8 LEAD MARKET ESTIMATES & FORECAST, BY REGION, 2019-2030 (USD MILLION) 45
      10. TABLE 9 ZIRCONIUM MARKET ESTIMATES & FORECAST, BY REGION, 2019-2030 (USD MILLION) 45
      11. TABLE 10 LITHIUM MARKET ESTIMATES & FORECAST, BY REGION, 2019-2030 (USD MILLION) 45
      12. TABLE 11 OTHER THROUGH DRIER METALS MARKET ESTIMATES & FORECAST, BY REGION, 2019-2030 (USD MILLION) 46
      13. TABLE 12 AUXILIARY DRIER METALS: MARKET ESTIMATES & FORECAST, BY REGION, 2019-2030 (USD MILLION) 46
      14. TABLE 13 CALCIUM: MARKET ESTIMATES & FORECAST, BY REGION, 2019-2030 (USD MILLION) 46
      15. TABLE 14 ZINC: MARKET ESTIMATES & FORECAST, BY REGION, 2019-2030 (USD MILLION) 47
      16. TABLE 15 BARIUM: MARKET ESTIMATES & FORECAST, BY REGION, 2019-2030 (USD MILLION) 47
      17. TABLE 16 COBALT: MARKET ESTIMATES & FORECAST, BY REGION, 2019-2030 (USD MILLION) 47
      18. TABLE 17 COBALT: MARKET ESTIMATES & FORECAST, BY REGION, 2019-2030 (USD MILLION) 48
      19. TABLE 18 IRON: MARKET ESTIMATES & FORECAST, BY REGION, 2019-2030 (USD MILLION) 48
      20. TABLE 19 OTHERS: MARKET ESTIMATES & FORECAST, BY REGION, 2019-2030 (USD MILLION) 49
      21. TABLE 20 CATALYSTS:MARKET ESTIMATES & FORECAST, BY REGION, 2019-2030 (USD MILLION) 51
      22. TABLE 21 LUBRICANT ADDITIVES: MARKET ESTIMATES & FORECAST, BY REGION, 2019-2030 (USD MILLION) 51
      23. TABLE 22 DRIERS: MARKET ESTIMATES & FORECAST, BY REGION, 2019-2030 (USD MILLION) 52
      24. TABLE 23 HIGH-SOLIDS COATINGS: MARKET ESTIMATES & FORECAST, BY REGION, 2019-2030 (USD MILLION) 52
      25. TABLE 24 WATER-BORNE COATINGS: MARKET ESTIMATES & FORECAST, BY REGION, 2019-2030 (USD MILLION) 52
      26. TABLE 25 OTHERS: MARKET ESTIMATES & FORECAST, BY REGION, 2019-2030 (USD MILLION) 53
      27. TABLE 26 PLASTIC STABILIZERS: MARKET ESTIMATES & FORECAST, BY REGION, 2019-2030 (USD MILLION) 53
      28. TABLE 27 POLYESTER ACCELERATORS: MARKET ESTIMATES & FORECAST, BY REGION, 2019-2030 (USD MILLION) 54
      29. TABLE 28 FUEL ADDITIVES: MARKET ESTIMATES & FORECAST, BY REGION, 2019-2030 (USD MILLION) 54
      30. TABLE 29 OTHER APPLICATIONS: MARKET ESTIMATES & FORECAST, BY REGION, 2019-2030 (USD MILLION) 55
      31. TABLE 30 GLOBAL METAL CARBOXYLATES MARKET, BY REGION, 2019-2030 (USD MILLION) 56
      32. TABLE 31 NORTH AMERICA: METAL CARBOXYLATES MARKET, BY COUNTRY, 2019-2030 (USD MILLION) 57
      33. TABLE 32 NORTH AMERICA: METAL CARBOXYLATES MARKET, BY PRODUCT TYPE, 2019-2030 (USD MILLION) 58
      34. TABLE 33 NORTH AMERICA: PRIMARY DRIER METALS MARKET, BY TYPE, 2019-2030 (USD MILLION) 58
      35. TABLE 34 NORTH AMERICA: THROUGH DRIER METALS MARKET, BY TYPE, 2019-2030 (USD MILLION) 58
      36. TABLE 35 NORTH AMERICA: AUXILIARY DRIER METALS MARKET, BY TYPE, 2019-2030 (USD MILLION) 58
      37. TABLE 36 NORTH AMERICA: METAL CARBOXYLATES MARKET, BY APPLICATION, 2019-2030 (USD MILLION) 59
      38. TABLE 37 NORTH AMERICA: DRIERS MARKET, BY TYPE, 2019-2030 (USD MILLION) 59
      39. TABLE 38 US: METAL CARBOXYLATES MARKET, BY PRODUCT TYPE, 2019-2030 (USD MILLION) 59
      40. TABLE 39 US: PRIMARY DRIER METALS MARKET, BY TYPE, 2019-2030 (USD MILLION) 59
      41. TABLE 40 US: THROUGH DRIER METALS MARKET, BY TYPE, 2019-2030 (USD MILLION) 60
      42. TABLE 41 US: AUXILIARY DRIER METALS MARKET, BY TYPE, 2019-2030 (USD MILLION) 60
      43. TABLE 42 US: METAL CARBOXYLATES MARKET, BY APPLICATION, 2019-2030 (USD MILLION) 60
      44. TABLE 43 US: DRIERS MARKET, BY TYPE, 2019-2030 (USD MILLION) 60
      45. TABLE 44 CANADA: METAL CARBOXYLATES MARKET, BY PRODUCT TYPE, 2019-2030 (USD MILLION) 61
      46. TABLE 45 CANADA: PRIMARY DRIER METALS MARKET, BY TYPE, 2019-2030 (USD MILLION) 61
      47. TABLE 46 CANADA: THROUGH DRIER METALS MARKET, BY TYPE, 2019-2030 (USD MILLION) 61
      48. TABLE 47 CANADA: AUXILIARY DRIER METALS MARKET, BY TYPE, 2019-2030 (USD MILLION) 61
      49. TABLE 48 CANADA: METAL CARBOXYLATES MARKET, BY APPLICATION, 2019-2030 (USD MILLION) 62
      50. TABLE 49 CANADA: DRIERS MARKET, BY TYPE, 2019-2030 (USD MILLION) 62
      51. TABLE 50 EUROPE: METAL CARBOXYLATES MARKET, BY COUNTRY, 2019-2030 (USD MILLION) 63
      52. TABLE 51 EUROPE: METAL CARBOXYLATES MARKET, BY PRODUCT TYPE, 2019-2030 (USD MILLION) 64
      53. TABLE 52 EUROPE: PRIMARY DRIER METALS MARKET, BY TYPE, 2019-2030 (USD MILLION) 64
      54. TABLE 53 EUROPE: THROUGH DRIER METALS MARKET, BY TYPE, 2019-2030 (USD MILLION) 64
      55. TABLE 54 EUROPE: AUXILIARY DRIER METALS MARKET, BY TYPE, 2019-2030 (USD MILLION) 64
      56. TABLE 55 EUROPE: METAL CARBOXYLATES MARKET, BY APPLICATION, 2019-2030 (USD MILLION) 65
      57. TABLE 56 EUROPE: DRIERS MARKET, BY TYPE, 2019-2030 (USD MILLION) 65
      58. TABLE 57 GERMANY: METAL CARBOXYLATES MARKET, BY PRODUCT TYPE, 2019-2030 (USD MILLION) 65
      59. TABLE 58 GERMANY: PRIMARY DRIER METALS MARKET, BY TYPE, 2019-2030 (USD MILLION) 65
      60. TABLE 59 GERMANY: THROUGH DRIER METALS MARKET, BY TYPE, 2019-2030 (USD MILLION) 66
      61. TABLE 60 GERMANY: AUXILIARY DRIER METALS MARKET, BY TYPE, 2019-2030 (USD MILLION) 66
      62. TABLE 61 GERMANY: METAL CARBOXYLATES MARKET, BY APPLICATION, 2019-2030 (USD MILLION) 66
      63. TABLE 62 GERMANY: DRIERS MARKET, BY TYPE, 2019-2030 (USD MILLION) 66
      64. TABLE 63 UK: METAL CARBOXYLATES MARKET, BY PRODUCT TYPE, 2019-2030 (USD MILLION) 67
      65. TABLE 64 UK: PRIMARY DRIER METALS MARKET, BY TYPE, 2019-2030 (USD MILLION) 67
      66. TABLE 65 UK: THROUGH DRIER METALS MARKET, BY TYPE, 2019-2030 (USD MILLION) 67
      67. TABLE 66 UK: AUXILIARY DRIER METALS MARKET, BY TYPE, 2019-2030 (USD MILLION) 67
      68. TABLE 67 UK: METAL CARBOXYLATES MARKET, BY APPLICATION, 2019-2030 (USD MILLION) 68
      69. TABLE 68 UK: DRIERS MARKET, BY TYPE, 2019-2030 (USD MILLION) 68
      70. TABLE 69 FRANCE: METAL CARBOXYLATES MARKET, BY PRODUCT TYPE, 2019-2030 (USD MILLION) 68
      71. TABLE 70 FRANCE: PRIMARY DRIER METALS MARKET, BY TYPE, 2019-2030 (USD MILLION) 68
      72. TABLE 71 FRANCE: THROUGH DRIER METALS MARKET, BY TYPE, 2019-2030 (USD MILLION) 69
      73. TABLE 72 FRANCE: AUXILIARY DRIER METALS MARKET, BY TYPE, 2019-2030 (USD MILLION) 69
      74. TABLE 73 FRANCE: METAL CARBOXYLATES MARKET, BY APPLICATION, 2019-2030 (USD MILLION) 69
      75. TABLE 74 FRANCE: DRIERS MARKET, BY TYPE, 2019-2030 (USD MILLION) 69
      76. TABLE 75 SPAIN: METAL CARBOXYLATES MARKET, BY PRODUCT TYPE, 2019-2030 (USD MILLION) 70
      77. TABLE 76 SPAIN: PRIMARY DRIER METALS MARKET, BY TYPE, 2019-2030 (USD MILLION) 70
      78. TABLE 77 SPAIN: THROUGH DRIER METALS MARKET, BY TYPE, 2019-2030 (USD MILLION) 70
      79. TABLE 78 SPAIN: AUXILIARY DRIER METALS MARKET, BY TYPE, 2019-2030 (USD MILLION) 70
      80. TABLE 79 SPAIN: METAL CARBOXYLATES MARKET, BY APPLICATION, 2019-2030 (USD MILLION) 71
      81. TABLE 80 SPAIN: DRIERS MARKET, BY TYPE, 2019-2030 (USD MILLION) 71
      82. TABLE 81 ITALY: METAL CARBOXYLATES MARKET, BY PRODUCT TYPE, 2019-2030 (USD MILLION) 71
      83. TABLE 82 ITALY: PRIMARY DRIER METALS MARKET, BY TYPE, 2019-2030 (USD MILLION) 71
      84. TABLE 83 ITALY: THROUGH DRIER METALS MARKET, BY TYPE, 2019-2030 (USD MILLION) 72
      85. TABLE 84 ITALY: AUXILIARY DRIER METALS MARKET, BY TYPE, 2019-2030 (USD MILLION) 72
      86. TABLE 85 ITALY: METAL CARBOXYLATES MARKET, BY APPLICATION, 2019-2030 (USD MILLION) 72
      87. TABLE 86 ITALY: DRIERS MARKET, BY TYPE, 2019-2030 (USD MILLION) 72
      88. TABLE 87 RUSSIA: METAL CARBOXYLATES MARKET, BY PRODUCT TYPE, 2019-2030 (USD MILLION) 73
      89. TABLE 88 RUSSIA: PRIMARY DRIER METALS MARKET, BY TYPE, 2019-2030 (USD MILLION) 73
      90. TABLE 89 RUSSIA: THROUGH DRIER METALS MARKET, BY TYPE, 2019-2030 (USD MILLION) 73
      91. TABLE 90 RUSSIA: AUXILIARY DRIER METALS MARKET, BY TYPE, 2019-2030 (USD MILLION) 73
      92. TABLE 91 RUSSIA: METAL CARBOXYLATES MARKET, BY APPLICATION, 2019-2030 (USD MILLION) 74
      93. TABLE 92 RUSSIA: DRIERS MARKET, BY TYPE, 2019-2030 (USD MILLION) 74
      94. TABLE 93 BELGIUM: METAL CARBOXYLATES MARKET, BY PRODUCT TYPE, 2019-2030 (USD MILLION) 74
      95. TABLE 94 BELGIUM: PRIMARY DRIER METALS MARKET, BY TYPE, 2019-2030 (USD MILLION) 74
      96. TABLE 95 BELGIUM: THROUGH DRIER METALS MARKET, BY TYPE, 2019-2030 (USD MILLION) 75
      97. TABLE 96 BELGIUM: AUXILIARY DRIER METALS MARKET, BY TYPE, 2019-2030 (USD MILLION) 75
      98. TABLE 97 BELGIUM: METAL CARBOXYLATES MARKET, BY APPLICATION, 2019-2030 (USD MILLION) 75
      99. TABLE 98 BELGIUM: DRIERS MARKET, BY TYPE, 2019-2030 (USD MILLION) 75
      100. TABLE 99 POLAND: METAL CARBOXYLATES MARKET, BY PRODUCT TYPE, 2019-2030 (USD MILLION) 76
      101. TABLE 100 POLAND: PRIMARY DRIER METALS MARKET, BY TYPE, 2019-2030 (USD MILLION) 76
      102. TABLE 101 POLAND: THROUGH DRIER METALS MARKET, BY TYPE, 2019-2030 (USD MILLION) 76
      103. TABLE 102 POLAND: AUXILIARY DRIER METALS MARKET, BY TYPE, 2019-2030 (USD MILLION) 76
      104. TABLE 103 POLAND: METAL CARBOXYLATES MARKET, BY APPLICATION, 2019-2030 (USD MILLION) 77
      105. TABLE 104 POLAND: DRIERS MARKET, BY TYPE, 2019-2030 (USD MILLION) 77
      106. TABLE 105 REST OF EUROPE: METAL CARBOXYLATES MARKET, BY PRODUCT TYPE, 2019-2030 (USD MILLION) 77
      107. TABLE 106 REST OF EUROPE: PRIMARY DRIER METALS MARKET, BY TYPE, 2019-2030 (USD MILLION) 77
      108. TABLE 107 REST OF EUROPE: THROUGH DRIER METALS MARKET, BY TYPE, 2019-2030 (USD MILLION) 78
      109. TABLE 108 REST OF EUROPE: AUXILIARY DRIER METALS MARKET, BY TYPE, 2019-2030 (USD MILLION) 78
      110. TABLE 109 REST OF EUROPE: METAL CARBOXYLATES MARKET, BY APPLICATION, 2019-2030 (USD MILLION) 78
      111. TABLE 110 REST OF EUROPE: DRIERS MARKET, BY TYPE, 2019-2030 (USD MILLION) 78
      112. TABLE 111 ASIA PACIFIC: METAL CARBOXYLATES MARKET, BY COUNTRY, 2019-2030 (USD MILLION) 80
      113. TABLE 112 ASIA PACIFIC: METAL CARBOXYLATES MARKET, BY PRODUCT TYPE, 2019-2030 (USD MILLION) 80
      114. TABLE 113 ASIA PACIFIC: PRIMARY DRIER METALS MARKET, BY TYPE, 2019-2030 (USD MILLION) 80
      115. TABLE 114 ASIA PACIFIC: THROUGH DRIER METALS MARKET, BY TYPE, 2019-2030 (USD MILLION) 80
      116. TABLE 115 ASIA PACIFIC: AUXILIARY DRIER METALS MARKET, BY TYPE, 2019-2030 (USD MILLION) 81
      117. TABLE 116 ASIA PACIFIC: METAL CARBOXYLATES MARKET, BY APPLICATION, 2019-2030 (USD MILLION) 81
      118. TABLE 117 ASIA PACIFIC: DRIERS MARKET, BY TYPE, 2019-2030 (USD MILLION) 81
      119. TABLE 118 CHINA: METAL CARBOXYLATES MARKET, BY PRODUCT TYPE, 2019-2030 (USD MILLION) 82
      120. TABLE 119 CHINA: PRIMARY DRIER METALS MARKET, BY TYPE, 2019-2030 (USD MILLION) 82
      121. TABLE 120 CHINA: THROUGH DRIER METALS MARKET, BY TYPE, 2019-2030 (USD MILLION) 82
      122. TABLE 121 CHINA: AUXILIARY DRIER METALS MARKET, BY TYPE, 2019-2030 (USD MILLION) 82
      123. TABLE 122 CHINA: METAL CARBOXYLATES MARKET, BY APPLICATION, 2019-2030 (USD MILLION) 83
      124. TABLE 123 CHINA: DRIERS MARKET, BY TYPE, 2019-2030 (USD MILLION) 83
      125. TABLE 124 JAPAN: METAL CARBOXYLATES MARKET, BY PRODUCT TYPE, 2019-2030 (USD MILLION) 83
      126. TABLE 125 JAPAN: PRIMARY DRIER METALS MARKET, BY TYPE, 2019-2030 (USD MILLION) 83
      127. TABLE 126 JAPAN: THROUGH DRIER METALS MARKET, BY TYPE, 2019-2030 (USD MILLION) 84
      128. TABLE 127 JAPAN: AUXILIARY DRIER METALS MARKET, BY TYPE, 2019-2030 (USD MILLION) 84
      129. TABLE 128 JAPAN: METAL CARBOXYLATES MARKET, BY APPLICATION, 2019-2030 (USD MILLION) 84
      130. TABLE 129 JAPAN: DRIERS MARKET, BY TYPE, 2019-2030 (USD MILLION) 84
      131. TABLE 130 INDIA: METAL CARBOXYLATES MARKET, BY PRODUCT TYPE, 2019-2030 (USD MILLION) 85
      132. TABLE 131 INDIA: PRIMARY DRIER METALS MARKET, BY TYPE, 2019-2030 (USD MILLION) 85
      133. TABLE 132 INDIA: THROUGH DRIER METALS MARKET, BY TYPE, 2019-2030 (USD MILLION) 85
      134. TABLE 133 INDIA: AUXILIARY DRIER METALS MARKET, BY TYPE, 2019-2030 (USD MILLION) 85
      135. TABLE 134 INDIA: METAL CARBOXYLATES MARKET, BY APPLICATION, 2019-2030 (USD MILLION) 86
      136. TABLE 135 INDIA: DRIERS MARKET, BY TYPE, 2019-2030 (USD MILLION) 86
      137. TABLE 136 SOUTH KOREA: METAL CARBOXYLATES MARKET, BY PRODUCT TYPE, 2019-2030 (USD MILLION) 86
      138. TABLE 137 SOUTH KOREA: PRIMARY DRIER METALS MARKET, BY TYPE, 2019-2030 (USD MILLION) 86
      139. TABLE 138 SOUTH KOREA: THROUGH DRIER METALS MARKET, BY TYPE, 2019-2030 (USD MILLION) 87
      140. TABLE 139 SOUTH KOREA: AUXILIARY DRIER METALS MARKET, BY TYPE, 2019-2030 (USD MILLION) 87
      141. TABLE 140 SOUTH KOREA: METAL CARBOXYLATES MARKET, BY APPLICATION, 2019-2030 (USD MILLION) 87
      142. TABLE 141 SOUTH KOREA: DRIERS MARKET, BY TYPE, 2019-2030 (USD MILLION) 87
      143. TABLE 142 THAILAND: METAL CARBOXYLATES MARKET, BY PRODUCT TYPE, 2019-2030 (USD MILLION) 88
      144. TABLE 143 THAILAND: PRIMARY DRIER METALS MARKET, BY TYPE, 2019-2030 (USD MILLION) 88
      145. TABLE 144 THAILAND: THROUGH DRIER METALS MARKET, BY TYPE, 2019-2030 (USD MILLION) 88
      146. TABLE 145 THAILAND: AUXILIARY DRIER METALS MARKET, BY TYPE, 2019-2030 (USD MILLION) 88
      147. TABLE 146 THAILAND: METAL CARBOXYLATES MARKET, BY APPLICATION, 2019-2030 (USD MILLION) 89
      148. TABLE 147 THAILAND: DRIERS MARKET, BY TYPE, 2019-2030 (USD MILLION) 89
      149. TABLE 148 AUSTRALIA & NEW ZEALAND: METAL CARBOXYLATES MARKET, BY PRODUCT TYPE, 2019-2030 (USD MILLION) 89
      150. TABLE 149 AUSTRALIA & NEW ZEALAND: PRIMARY DRIER METALS MARKET, BY TYPE, 2019-2030 (USD MILLION) 89
      151. TABLE 150 AUSTRALIA & NEW ZEALAND: THROUGH DRIER METALS MARKET, BY TYPE, 2019-2030 (USD MILLION) 90
      152. TABLE 151 AUSTRALIA & NEW ZEALAND: AUXILIARY DRIER METALS MARKET, BY TYPE, 2019-2030 (USD MILLION) 90
      153. TABLE 152 AUSTRALIA & NEW ZEALAND: METAL CARBOXYLATES MARKET, BY APPLICATION, 2019-2030 (USD MILLION) 90
      154. TABLE 153 AUSTRALIA & NEW ZEALAND: DRIERS MARKET, BY TYPE, 2019-2030 (USD MILLION) 90
      155. TABLE 154 REST OF ASIA-PACIFIC: METAL CARBOXYLATES MARKET, BY PRODUCT TYPE, 2019-2030 (USD MILLION) 91
      156. TABLE 155 REST OF ASIA-PACIFIC: PRIMARY DRIER METALS MARKET, BY TYPE, 2019-2030 (USD MILLION) 91
      157. TABLE 156 REST OF ASIA-PACIFIC: THROUGH DRIER METALS MARKET, BY TYPE, 2019-2030 (USD MILLION) 91
      158. TABLE 157 REST OF ASIA-PACIFIC: AUXILIARY DRIER METALS MARKET, BY TYPE, 2019-2030 (USD MILLION) 91
      159. TABLE 158 REST OF ASIA-PACIFIC: METAL CARBOXYLATES MARKET, BY APPLICATION, 2019-2030 (USD MILLION) 92
      160. TABLE 159 REST OF ASIA-PACIFIC: DRIERS MARKET, BY TYPE, 2019-2030 (USD MILLION) 92
      161. TABLE 160 LATIN AMERICA: METAL CARBOXYLATES MARKET, BY REGION, 2019-2030 (USD MILLION) 93
      162. TABLE 161 LATIN AMERICA: METAL CARBOXYLATES MARKET, BY PRODUCT TYPE, 2019-2030 (USD MILLION) 93
      163. TABLE 162 LATIN AMERICA: PRIMARY DRIER METALS MARKET, BY TYPE, 2019-2030 (USD MILLION) 94
      164. TABLE 163 LATIN AMERICA: THROUGH DRIER METALS MARKET, BY TYPE, 2019-2030 (USD MILLION) 94
      165. TABLE 164 LATIN AMERICA: AUXILIARY DRIER METALS MARKET, BY TYPE, 2019-2030 (USD MILLION) 94
      166. TABLE 165 LATIN AMERICA: METAL CARBOXYLATES MARKET, BY APPLICATION, 2019-2030 (USD MILLION) 94
      167. TABLE 166 LATIN AMERICA: DRIERS MARKET, BY TYPE, 2019-2030 (USD MILLION) 95
      168. TABLE 167 BRAZIL: METAL CARBOXYLATES MARKET, BY PRODUCT TYPE, 2019-2030 (USD MILLION) 95
      169. TABLE 168 BRAZIL: PRIMARY DRIER METALS MARKET, BY TYPE, 2019-2030 (USD MILLION) 95
      170. TABLE 169 BRAZIL: THROUGH DRIER METALS MARKET, BY TYPE, 2019-2030 (USD MILLION) 95
      171. TABLE 170 BRAZIL: AUXILIARY DRIER METALS MARKET, BY TYPE, 2019-2030 (USD MILLION) 96
      172. TABLE 171 BRAZIL: METAL CARBOXYLATES MARKET, BY APPLICATION, 2019-2030 (USD MILLION) 96
      173. TABLE 172 BRAZIL: DRIERS MARKET, BY TYPE, 2019-2030 (USD MILLION) 96
      174. TABLE 173 MEXICO: METAL CARBOXYLATES MARKET, BY PRODUCT TYPE, 2019-2030 (USD MILLION) 96
      175. TABLE 174 MEXICO: PRIMARY DRIER METALS MARKET, BY TYPE, 2019-2030 (USD MILLION) 97
      176. TABLE 175 MEXICO: THROUGH DRIER METALS MARKET, BY TYPE, 2019-2030 (USD MILLION) 97
      177. TABLE 176 MEXICO: AUXILIARY DRIER METALS MARKET, BY TYPE, 2019-2030 (USD MILLION) 97
      178. TABLE 177 MEXICO: METAL CARBOXYLATES MARKET, BY APPLICATION, 2019-2030 (USD MILLION) 97
      179. TABLE 178 MEXICO: DRIERS MARKET, BY TYPE, 2019-2030 (USD MILLION) 98
      180. TABLE 179 ARGENTINA: METAL CARBOXYLATES MARKET, BY PRODUCT TYPE, 2019-2030 (USD MILLION) 98
      181. TABLE 180 ARGENTINA: PRIMARY DRIER METALS MARKET, BY TYPE, 2019-2030 (USD MILLION) 98
      182. TABLE 181 ARGENTINA: THROUGH DRIER METALS MARKET, BY TYPE, 2019-2030 (USD MILLION) 98
      183. TABLE 182 ARGENTINA: AUXILIARY DRIER METALS MARKET, BY TYPE, 2019-2030 (USD MILLION) 99
      184. TABLE 183 ARGENTINA: METAL CARBOXYLATES MARKET, BY APPLICATION, 2019-2030 (USD MILLION) 99
      185. TABLE 184 ARGENTINA: DRIERS MARKET, BY TYPE, 2019-2030 (USD MILLION) 99
      186. TABLE 185 REST OF LATIN AMERICA: METAL CARBOXYLATES MARKET, BY PRODUCT TYPE, 2019-2030 (USD MILLION) 99
      187. TABLE 186 REST OF LATIN AMERICA: PRIMARY DRIER METALS MARKET, BY TYPE, 2019-2030 (USD MILLION) 100
      188. TABLE 187 REST OF LATIN AMERICA: THROUGH DRIER METALS MARKET, BY TYPE, 2019-2030 (USD MILLION) 100
      189. TABLE 188 REST OF LATIN AMERICA: AUXILIARY DRIER METALS MARKET, BY TYPE, 2019-2030 (USD MILLION) 100
      190. TABLE 189 REST OF LATIN AMERICA: METAL CARBOXYLATES MARKET, BY APPLICATION, 2019-2030 (USD MILLION) 100
      191. TABLE 190 REST OF LATIN AMERICA: DRIERS MARKET, BY TYPE, 2019-2030 (USD MILLION) 101
      192. TABLE 191 MIDDLE EAST & AFRICA: METAL CARBOXYLATES MARKET, BY REGION, 2019-2030 (USD MILLION) 102
      193. TABLE 192 MIDDLE EAST & AFRICA: METAL CARBOXYLATES MARKET, BY PRODUCT TYPE, 2019-2030 (USD MILLION) 102
      194. TABLE 193 MIDDLE EAST & AFRICA: PRIMARY DRIER METALS MARKET, BY TYPE, 2019-2030 (USD MILLION) 103
      195. TABLE 194 MIDDLE EAST & AFRICA: THROUGH DRIER METALS MARKET, BY TYPE, 2019-2030 (USD MILLION) 103
      196. TABLE 195 MIDDLE EAST & AFRICA: AUXILIARY DRIER METALS MARKET, BY TYPE, 2019-2030 (USD MILLION) 103
      197. TABLE 196 MIDDLE EAST & AFRICA: METAL CARBOXYLATES MARKET, BY APPLICATION, 2019-2030 (USD MILLION) 103
      198. TABLE 197 MIDDLE EAST & AFRICA: DRIERS MARKET, BY TYPE, 2019-2030 (USD MILLION) 103
      199. TABLE 198 GCC COUNTRIES: METAL CARBOXYLATES MARKET, BY PRODUCT TYPE, 2019-2030 (USD MILLION) 104
      200. TABLE 199 GCC COUNTRIES: PRIMARY DRIER METALS MARKET, BY TYPE, 2019-2030 (USD MILLION) 104
      201. TABLE 200 GCC COUNTRIES: THROUGH DRIER METALS MARKET, BY TYPE, 2019-2030 (USD MILLION) 104
      202. TABLE 201 GCC COUNTRIES: AUXILIARY DRIER METALS MARKET, BY TYPE, 2019-2030 (USD MILLION) 104
      203. TABLE 202 GCC COUNTRIES: METAL CARBOXYLATES MARKET, BY APPLICATION, 2019-2030 (USD MILLION) 105
      204. TABLE 203 GCC COUNTRIES: DRIERS MARKET, BY TYPE, 2019-2030 (USD MILLION) 105
      205. TABLE 204 SOUTH AFRICA: METAL CARBOXYLATES MARKET, BY PRODUCT TYPE, 2019-2030 (USD MILLION) 105
      206. TABLE 205 SOUTH AFRICA: PRIMARY DRIER METALS MARKET, BY TYPE, 2019-2030 (USD MILLION) 105
      207. TABLE 206 SOUTH AFRICA: THROUGH DRIER METALS MARKET, BY TYPE, 2019-2030 (USD MILLION) 106
      208. TABLE 207 SOUTH AFRICA: AUXILIARY DRIER METALS MARKET, BY TYPE, 2019-2030 (USD MILLION) 106
      209. TABLE 208 SOUTH AFRICA: METAL CARBOXYLATES MARKET, BY APPLICATION, 2019-2030 (USD MILLION) 106
      210. TABLE 209 SOUTH AFRICA: DRIERS MARKET, BY TYPE, 2019-2030 (USD MILLION) 106
      211. TABLE 210 REST OF MEA: METAL CARBOXYLATES MARKET, BY PRODUCT TYPE, 2019-2030 (USD MILLION) 107
      212. TABLE 211 REST OF MEA: PRIMARY DRIER METALS MARKET, BY TYPE, 2019-2030 (USD MILLION) 107
      213. TABLE 212 REST OF MEA: THROUGH DRIER METALS MARKET, BY TYPE, 2019-2030 (USD MILLION) 107
      214. TABLE 213 REST OF MEA: AUXILIARY DRIER METALS MARKET, BY TYPE, 2019-2030 (USD MILLION) 107
      215. TABLE 214 REST OF MEA: METAL CARBOXYLATES MARKET, BY APPLICATION, 2019-2030 (USD MILLION) 108
      216. TABLE 215 REST OF MEA: DRIERS MARKET, BY TYPE, 2019-2030 (USD MILLION) 108
      217. TABLE 216 COLLABORATIONS /ACQUISTIONS /PRODUCT LAUNCHES 109
      218. TABLE 217 ORGANOMETAL S.A.: PRODUCTS OFFERED 111
      219. TABLE 218 DIC CORPORATION: PRODUCTS/SERVICES OFFERED 114
      220. TABLE 219 DIC CORPORATION: KEY DEVELOPMENTS 115
      221. TABLE 220 DURA CHEMICALS, INC.: PRODUCTS/SERVICES OFFERED 116
      222. TABLE 221 DURA CHEMICALS: KEY DEVELOPMENTS 120
      223. TABLE 222 MATSUO SANGYO CO LTD: PRODUCTS OFFERED 121
      224. TABLE 223 NICHIA CORPORATION: PRODUCTS/SERVICES OFFERED 124
      225. TABLE 224 COMAR CHEMICALS: PRODUCTS OFFERED 125
      226. TABLE 225 EGE KIMYA: PRODUCTS/SERVICES OFFERED 127
      227. TABLE 226 THE SHEPHERD CHEMICAL COMPANY: PRODUCTS/SERVICES OFFERED 129
      228. TABLE 227 BORCHERS INC.: PRODUCTS OFFERINGS 131
      229. TABLE 228 BORCHERS INC.: KEY DEVELOPMENTS 133
      230. TABLE 229 BAERLOCHER: PRODUCTS OFFERINGS 134
      231. TABLE 230 BAERLOCHER: KEY DEVELOPMENTS 135
      232. TABLE 231 PATCHAM: PRODUCTS OFFERINGS 136
      233. TABLE 232 NIHON KAGAYU SANGYO: PRODUCTS OFFERINGS 139
      234. TABLE 233 NIHON KAGAYU SANGYO: KEY DEVELOPMENTS 141
      235. TABLE 234 CHEMELYNE SPPECIALITIES: PRODUCTS OFFERED 142
      236. TABLE 235 OPTICHEM: PRODUCTS OFFERINGS 144
      237. TABLE 236 OPTICHEM: KEY DEVELOPMENTS 145
      238. TABLE 237 JUSTUS KIMIARAYA: PRODUCTS OFFERINGS 146
      239. TABLE 238 PAU THAI: PRODUCTS OFFERED 148
      240. TABLE 239 TROY: PRODUCTS/SERVICES OFFERED 151
      241. TABLE 240 TROY CORP: KEY DEVELOPMENTS 153
      242. TABLE 241 DALIAN: PRODUCTS/SERVICES OFFERED 154
      243. TABLE 242 TAEKWANG: PRODUCTS OFFERED 157
      244. TABLE 243 MIRACEMA: PRODUCTS/SERVICES OFFERED 158
      245. TABLE 244 VENATOR: PRODUCTS/SERVICES OFFERED 161   LIST OF FIGURES
      246. FIGURE 1 MARKET SYNOPSIS 19
      247. FIGURE 2 MARKET ATTRACTIVENESS ANALYSIS: GLOBAL METAL CARBOXYLATES MARKET 20
      248. FIGURE 3 GLOBAL METAL CARBOXYLATES MARKETANALYSIS BY PRODUCT TYPE 21
      249. FIGURE 4 GLOBAL METAL CARBOXYLATES MARKETANALYSIS BY APPLICATION 22
      250. FIGURE 5 GLOBAL METAL CARBOXYLATES MARKET: MARKET STRUCTURE 23
      251. FIGURE 6 RESEARCH PROCESS OF MRFR 24
      252. FIGURE 7 TOP DOWN &Bottom-up Approach 27
      253. FIGURE 8 NORTH AMERICA MARKET SIZE & MARKET SHARE BY COUNTRY (2021 VS 2030) 30
      254. FIGURE 9 EUROPE MARKET SIZE & MARKET SHARE BY COUNTRY (2021 VS 2030) 30
      255. FIGURE 10 ASIA-PACIFIC & MARKET SHARE BY COUNTRY (2021 VS 2030) 31
      256. FIGURE 11 LATIN AMERICA MARKET SIZE & MARKET SHARE BY COUNTRY (2021 VS 2030) 31
      257. FIGURE 12 MIDDLE EAST & AFRICA MARKET SIZE & MARKET SHARE BY COUNTRY (2021 VS 2030) 32
      258. FIGURE 13 DRO ANALYSIS OF GLOBAL METAL CARBOXYLATES MARKET 33
      259. FIGURE 14 DRIVERS IMPACT ANALYSIS: METAL CARBOXYLATES MARKET 34
      260. FIGURE 15 RESTRAINTS IMPACT ANALYSIS: METAL CARBOXYLATES MARKET 35
      261. FIGURE 16 SUPPLY / VALUE CHAIN: GLOBAL METAL CARBOXYLATES MARKET 38
      262. FIGURE 17 PORTER''S FIVE FORCES ANALYSIS OF THE GLOBAL METAL CARBOXYLATES MARKET 40
      263. FIGURE 18 GLOBAL METAL CARBOXYLATES MARKETSIZE, BY PRODUCT TYPE, 2021 (% SHARE) 42
      264. FIGURE 19 GLOBAL METAL CARBOXYLATES MARKETSIZE, BY PRODUCT TYPE, 2021 TO 2030 (USD MILLION) 42
      265. FIGURE 20 GLOBAL METAL CARBOXYLATES MARKETSIZE, BY APPLICATION, 2021 (% SHARE) 50
      266. FIGURE 21 GLOBAL METAL CARBOXYLATES MARKETSIZE, BY APPLICATION, 2021 TO 2030 (USD MILLION) 50
      267. FIGURE 22 GLOBAL METAL CARBOXYLATES MARKET, BY REGION, 2021(% SHARE) 56
      268. FIGURE 23 NORTH AMERICA: METAL CARBOXYLATES MARKETSHARE, BY COUNTRY, 2021 (% SHARE) 57
      269. FIGURE 24 EUROPE: METAL CARBOXYLATES MARKETSHARE, BY COUNTRY, 2021 (% SHARE) 63
      270. FIGURE 25 ASIA PACIFIC: METAL CARBOXYLATES MARKETSHARE, BY COUNTRY, 2021 (% SHARE) 79
      271. FIGURE 26 LATIN AMERICA: METAL CARBOXYLATES MARKETSHARE, BY COUNTRY, 2021 (% SHARE) 93
      272. FIGURE 27 MIDDLE EAST & AFRICA: METAL CARBOXYLATES MARKETSHARE, BY COUNTRY, 2021 (% SHARE) 102

    Metal Carboxylates Market Segmentation

    Market Segmentation Overview

    • Detailed segmentation data will be available in the full report
    • Comprehensive analysis by multiple parameters
    • Regional and country-level breakdowns
    • Market size forecasts by segment
    Infographic

    Free Sample Request

    Kindly complete the form below to receive a free sample of this Report

    Get Free Sample

    Customer Strories

    “I am very pleased with how market segments have been defined in a relevant way for my purposes (such as "Portable Freezers & refrigerators" and "last-mile"). In general the report is well structured. Thanks very much for your efforts.”

    Victoria Milne

    Founder
    Case Study
    Chemicals and Materials