Request Free Sample ×

Kindly complete the form below to receive a free sample of this Report

* Please use a valid business email

Leading companies partner with us for data-driven Insights

clients tt-cursor
Hero Background
English
Chinese
French
Japanese
Korean
German
Spanish

Medical Devices Market Share

ID: MRFR/MED/2123-CR
200 Pages
Satyendra Maurya
March 2026

Medical Devices Market Research Report Information by Device Type (Drug Delivery Systems, Diagnostic Devices, Invasive Devices, Respiratory Therapeutic Devices, Electronic Medical Devices, and Others), By Application (Cardiovascular Diseases, Diagnostic Imaging, Orthopedics, Oncology, General Surgery, Respiratory, ENT, Neurology, Nephrology & Urology, and Others), By End User (Hospitals & Clinics, Ambulatory Surgical Centers, Homecare Settings, and Others) By Region (North America, Europe, Asia Pacific, South America, Middle East & Africa) - Forecast to 2035

Share:
Download PDF ×

We do not share your information with anyone. However, we may send you emails based on your report interest from time to time. You may contact us at any time to opt-out.

Medical Devices Market Infographic
Purchase Options

Market Share

Medical Devices Market Share Analysis

Investing more in R&D allows companies to create more advanced medical devices. These devices are designed to provide better diagnostics, treatments, and overall healthcare solutions. However, the introduction of new devices requires approval from regulatory authorities, such as the US Food and Drug Administration (FDA). The fact that the FDA's Center for Devices and Radiological Health (CDRH) approved or authorized 13 devices in 2021 emphasizes the industry's commitment to innovation. Quick approvals mean that these advanced devices can reach the market sooner, benefiting both healthcare providers and patients. Pharmaceutical and Biopharmaceutical Contribution The increase in R&D spending is not limited to medical device companies alone. Pharmaceutical and biopharmaceutical companies are also channeling more resources into research. This collaboration across sectors is significant because it brings a holistic approach to healthcare solutions. In addition to medical devices, pharmaceutical and biopharmaceutical companies contribute to the development of new drugs and therapies. The synergy between these sectors enhances the overall healthcare landscape. As the prevalence of chronic diseases continues to rise, there is a growing demand for innovative therapies. Traditional treatments may not always be sufficient, and this is where R&D becomes a driving force for change. It allows the creation of new and more effective therapies to address the unique challenges posed by chronic conditions. Overcoming Unmet Healthcare Needs One of the primary objectives of investing in R&D is to overcome unmet needs in the healthcare sector. Unmet needs refer to areas where current medical solutions fall short or do not exist. This could include gaps in treatment options, diagnostic tools, or preventive measures. R&D activities aim to bridge these gaps and provide comprehensive solutions to healthcare challenges. Outsourcing Services and Global Market Growth The growth in R&D investments doesn't only impact the companies conducting the research; it also influences outsourcing services. Companies often seek external expertise and services to complement their internal capabilities. This outsourcing trend is expected to witness growth as R&D activities intensify. Outsourcing services can range from specialized research support to the development and testing of medical devices. This collaborative approach allows companies to tap into a diverse range of skills and knowledge, fostering innovation and efficiency.

Author
Author Profile
Satyendra Maurya
Research Analyst

An accomplished research analyst with high proficiency in market forecasting, data visualization, competitive benchmarking, and others. He holds a pronounced track record in research and consulting projects for sectors such as life sciences, medical devices, and healthcare IT. His capabilities in qualitative and quantitative analysis have resulted in positive client outcomes. Working on niche market trends, opportunities, sales, and forecasted value is part of his skill set.

Leave a Comment

FAQs

What is the current valuation of the medical device devices market as of 2024?

<p>The medical device devices market was valued at 590.0 USD Billion in 2024.</p>

What is the projected market valuation for the medical device devices market in 2035?

<p>The market is projected to reach 850.0 USD Billion by 2035.</p>

What is the expected CAGR for the medical device devices market during the forecast period 2025 - 2035?

<p>The expected CAGR for the medical device devices market during 2025 - 2035 is 3.37%.</p>

Which companies are considered key players in the medical device devices market?

Key players include Medtronic, Abbott Laboratories, Boston Scientific, Johnson &amp; Johnson, Siemens Healthineers, Philips, Stryker Corporation, Baxter International, and GE Healthcare.

What are the major segments of the medical device devices market by application?

<p>Major segments by application include Diagnostic Devices, Therapeutic Devices, Monitoring Devices, Surgical Devices, and Rehabilitation Devices.</p>

How much was the market size for surgical devices in 2024?

<p>The market size for surgical devices was 150.0 USD Billion in 2024.</p>

What is the projected market size for monitoring devices by 2035?

<p>The market size for monitoring devices is projected to reach 140.0 USD Billion by 2035.</p>

What are the end-use segments in the medical device devices market?

<p>End-use segments include Hospitals, Clinics, Home Care, Research Laboratories, and Ambulatory Surgical Centers.</p>

What is the market size for implantable devices in 2024?

<p>The market size for implantable devices was 150.0 USD Billion in 2024.</p>

What technological advancements are influencing the medical device devices market?

<p>Technological advancements include Digital Technology, Biotechnology, Nanotechnology, Robotics, and Telemedicine.</p>

Market Summary

According to Market Research Future analysis, the Medical Devices Market size was valued at USD 641,899 Million in 2024. The market is projected to grow from USD 688,180 Million in 2025 to USD 1,377,540 Million by 2035, exhibiting a CAGR of 7.21% during the forecast period 2025-2035. North America led the market with over 40% share, generating around USD 256759.60 million in revenue.
 
The Medical Devices Market is driven by rising chronic disease prevalence, aging populations, and increasing demand for minimally invasive procedures. Continuous technological advancements, expanding healthcare infrastructure, and higher healthcare spending are accelerating adoption of innovative diagnostic, monitoring, and therapeutic medical devices globally.
 
According to WHO, noncommunicable diseases cause 41 million deaths annually (71% globally), while IHME reports rising disease burden. CDC highlights 6 in 10 adults have chronic diseases. PAHO notes increasing aging population, collectively supporting strong demand growth for advanced medical devices globally.

Key Market Trends & Highlights

The Medical Devices Market is a rapidly expanding sector driven by aging populations, chronic disease prevalence, and technological innovations like AI and minimally invasive tools.

  • AI is revolutionizing diagnostics and predictive analytics in medical devices. Algorithms now power imaging tools for faster cancer detection and real-time monitoring in wearables. Demand for less invasive devices is booming, with procedures like endoscopy and laparoscopy expanding due to shorter recovery times and lower costs. North America leads with 40% share, with United States alone contributing 32%, driven by advanced healthcare infrastructure investments. Hospitals account for 55% market share, supported by high patient volume and increasing demand for complex medical procedures globally. Patient monitoring equipment growing fastest, capturing 22% share, fueled by telehealth expansion and rising demand for remote healthcare solutions. Diagnostic devices dominate with 42% share, reflecting strong demand for early disease detection and advanced diagnostic technologies globally.

Market Size & Forecast

2024 Market Size 6,41,899 (USD Million)
2035 Market Size 13,77,540 (USD Million)
CAGR (2025 - 2035) 7.21%

Major Players

Companies such as Johnson &amp; Johnson, GE Healthcare, Stryker, Beckton Dickinson and Company, <a href="https://www.bostonscientific.com/en-US/healthcare-professionals/products/medical-specialty.html">Boston Scientific</a> Corporation, <a href="https://www.abbott.com/en-us/products-solutions/product-list">Abbott</a> are some of the major participants in the global market.

Market Trends

The medical devices market is a rapidly growing sector within healthcare which is driven by technological innovation, demographic changes and increasing healthcare expenditure. Increasing prevalence of chronic diseases, an aging global population and increasing demand for minimally invasive procedures are fueling the adoption of advanced medical devices.

Technological advancements such as robotics, AI-assisted diagnostics, wearable devices and smart implants are continuously expanding the portfolios of the product where regulatory frameworks like FDA approvals and ISO standards ensure safety, quality and reliability. The market also benefits from expanding healthcare infrastructure which emerges in the economies and creates new growth opportunities. 

WHO reports over 65% of countries have national digital health strategies supporting connected devices. ECDC highlights increased adoption of AI-driven diagnostics across Europe. CDC confirms telehealth usage surged over 38 times post-pandemic, reinforcing strong integration of smart medical devices globally.

However, the challenges such as high R&D costs, stringent regulatory requirements and intense competition persist. Overall, the medical devices market thrives on innovation. The world medical equipment market is undergoing robust growth due to the high rate of technological advancement, rising rates of chronic and lifestyle diseases, and the growing rates of healthcare spending in the developed and emerging markets.

Medical devices encompass the wide variety of products like drug delivery systems, diagnostic equipment, invasive and implantable devices, respiratory therapeutic equipment, and electronic medical equipment intended to help patients and better the quality of their diagnosis and treatment delivery.

IHME estimates chronic diseases contribute to over 80% of global disease burden. WHO projects the global population aged 60+ will reach 2.1 billion by 2050. PAHO reports significant increases in cardiovascular and diabetes prevalence, driving sustained demand for medical devices.

The shift to value-based healthcare and the increasing interest in preventive health monitoring alongside the introduction of digital solutions is changing the situation with the usage of medical devices in the world. The industry is also on a promising path, but it is not without its challenges, including the fact that the strong approval procedures are expensive to comply with, prices are under pressure, and the supply chain is easily disturbed.

Nevertheless, the increased adoption of artificial intelligence (AI), Internet of Things (IoT), robotics, and telemedicine solutions is transforming the market to smarter, more connected, and patient-centric care delivery. In general, the medical devices market in the world is anticipated to experience long-term growth due to the innovation, the growing global medical needs and the ongoing transformation into digital, personalized, and affordable medical services.

UNICEF reports major investments in healthcare access across low- and middle-income countries. UNFPA highlights rapid urbanization and healthcare expansion. Global Fund investments exceeded USD 5 billion annually, strengthening healthcare systems and boosting adoption of medical technologies worldwide.

Medical Devices Market Market Drivers

Growing Geriatric Population and Chronic Disease Burden

The global increase in the geriatric population is a significant driver of the medical devices market. As people get aged, they are more susceptible to chronic and age-related health conditions such as cardiovascular diseases, diabetes, cancer, arthritis and stroke.
 
These conditions require continuous monitoring with timely diagnosis and effective management where all of which create increasing demand for advanced medical devices which include diagnostic tools, monitoring systems, surgical instruments and rehabilitation equipment.

Technological Advancements and Integration of Ai in Devices

Rapid technological advancements are transforming the medical devices market by increasing the precision, efficiency and effectiveness of healthcare delivery. Innovations in imaging, robotics, wearable sensors, and minimally invasive surgical tools are enabling more accurate diagnostics and improved patient outcomes. These developments reduce procedural risks, shorten recovery times, and streamline workflows which make the healthcare systems more efficient and reliable.
 
As a result, healthcare providers are increasingly adopting advanced devices which drive the growth of the overall market. Overall, the convergence of technological innovations and AI integration is a significant growth driver for the medical devices industry. Manufacturers are investing in research and development to introduce intelligent, connected and automated devices that meets the evolving clinical needs. This trend is creating opportunities for next-generation medical devices that support precision medicine, personalized care and data-driven healthcare solutions thereby expanding the market globally.

Rising Adoption of Ophthalmic Viscoelastic Devices in Cataract and Refractive Surgeries

Ophthalmic viscoelastic devices (OVDs) play an important role in modern eye surgeries, particularly cataract and refractive procedures. These viscoelastic solutions help maintain intraocular space to protect delicate ocular tissues and facilitate precise manipulation during surgery. As cataract and refractive surgeries continue to rise globally due to aging populations and increasing vision-related health awareness, the demand for OVDs has grown significantly which makes them an essential component of ophthalmic surgical procedures.
 
Overall, the increasing prevalence of cataract and refractive surgeries are combined with the critical role of viscoelastic solutions in improving surgical precision and safety is a strong growth driver for the ophthalmic medical devices market. Continuous product innovation, including next-generation biocompatible formulations which is expected to further accelerate adoption and expand opportunities in this niche but rapidly growing segment.

Market Segment Insights

By Application: Diagnostic Devices (Largest) vs. Therapeutic Devices (Fastest-Growing)

In the medical device market, the application segment is critical, revealing distinct dynamics among its various categories. Diagnostic devices maintain the largest share, serving as essential tools for early disease detection and patient assessment. They are preferred not only for their efficacy but also for their increasing integration into personalized medicine. Conversely, therapeutic devices are emerging rapidly, reflecting a growing trend towards patient-centric care approaches and advanced treatment modalities.

Diagnostic Devices (Dominant) vs. Therapeutic Devices (Emerging)

Diagnostic devices are positioned as the dominant segment, paving the way for innovations in imaging and laboratory testing. Their established utility in clinical workflows makes them indispensable in hospitals and other healthcare settings. Conversely, therapeutic devices represent an emerging segment, incorporating cutting-edge technologies that enhance treatment delivery and effectiveness. Their rapid adoption is driven by technological advancements and an increasing focus on minimally invasive techniques. Together, these segments exemplify the dual focus of the medical device market on both diagnostic precision and therapeutic innovation.

By End Use: Hospitals (Largest) vs. Home Care (Fastest-Growing)

In the medical device market, hospitals are currently the largest end-use segment, accounting for a substantial share due to the high demand for advanced medical technologies and extensive procedures performed in these facilities. Clinics also contribute significantly, but their share is steadily declining as more patients prefer outpatient treatments. Home care is gaining momentum, showing a shift towards personalized healthcare and remote monitoring, which has been further accelerated by the pandemic's emphasis on reducing hospital visits.

Home Care (Dominant) vs. Research Laboratories (Emerging)

Hospitals remain the dominant players in the medical device market, driven by their need for complex and diverse medical equipment for various treatments and surgeries. However, home care is emerging as a formidable segment, fueled by innovations in telehealth and <a title="remote patient monitoring" href="https://www.marketresearchfuture.com/reports/remote-patient-monitoring-market-10905" target="_blank" rel="noopener">remote patient monitoring</a> that cater to consumers’ desire for convenience and independence. Research laboratories focus on developing cutting-edge technology and testing new devices, but their market share is relatively smaller as they primarily depend on funding and partnerships with larger medical entities. Thus, while hospitals and home care dominate, research laboratories play a crucial supporting role by pushing the boundaries of medical advancements.

By Device Type: Electromechanical Devices (Largest) vs. Implantable Devices (Fastest-Growing)

In the medical device market, Electromechanical Devices hold the largest market share among the various device types, reflecting their integral role in diagnostic and therapeutic applications. Surgical Instruments and In Vitro Diagnostic Devices follow closely, serving specialized medical procedures and laboratory environments. Wearable Devices are gaining traction, but they still share a smaller portion of the market compared to the established electromechanical and implantable categories.

Electromechanical Devices (Dominant) vs. Wearable Devices (Emerging)

Electromechanical Devices remain a cornerstone of the medical device market, known for their reliability and versatility in various clinical settings. They encompass a wide range of products, from diagnostic machines to therapeutic devices. Meanwhile, Wearable Devices are emerging as a significant market player, fueled by advancements in technology and increasing consumer interest in health monitoring. They are characterized by their user-friendliness and real-time data collection capabilities, which make them particularly appealing in preventive healthcare. As the market evolves, these two segments are likely to innovate in tandem, redefining patient care.

By Technology: Digital Technology (Largest) vs. Telemedicine (Fastest-Growing)

The medical device market is increasingly being shaped by various technological advancements, with Digital Technology holding the largest share among the different sub-segments. Digital Technology, which includes software-driven devices, remote monitoring, and data analytics tools, plays a crucial role in improving patient outcomes and operational efficiencies within healthcare settings. Telemedicine, while currently a smaller segment, is rapidly expanding its presence as healthcare providers embrace virtual consultations and remote patient management solutions.

Technology: Digital Technology (Dominant) vs. Telemedicine (Emerging)

Digital Technology is characterized by its integration with information technology systems, allowing for real-time monitoring and management of patients. This segment enables healthcare providers to make data-driven decisions and enhances the overall patient experience. On the other hand, Telemedicine has emerged as a vital service in the medical device market, driven by its ability to reach patients in remote areas and reduce costs associated with traditional healthcare delivery. As patients increasingly favor convenient access to healthcare, the telemedicine segment is poised for significant growth, transforming patient care paradigms.

By Regulatory Classification: Class II Devices (Largest) vs. Class III Devices (Fastest-Growing)

The market showcases a distinct distribution across various regulatory classifications, with Class II devices holding the largest Medical Devices Market share at 50%. These devices, which include essential items like infusion pumps and surgical lasers, account for a significant portion of the overall market due to their moderate-risk classification. In contrast, Class III devices, which necessitate more rigorous regulatory scrutiny, represent the fastest-growing segment, with a 30% share. This includes high-risk devices such as implantable pacemakers and coronary stents, reflecting the increasing focus on advanced medical technology and patient care.

Class II Devices (Dominant) vs. Class III Devices (Emerging)

Class II Devices dominate the market share due to their widespread applications and established regulatory pathways. They cater to a broad range of needs, balancing safety with accessibility in patient care. While Class III Devices represent an emerging sector with substantial growth potential, they are marked by higher regulatory requirements and innovation. This segment is becoming increasingly critical as advancements in technology allow for more complex solutions, such as bioengineered implants and advanced diagnostic equipment, indicating a shift toward more sophisticated healthcare solutions.

Get more detailed insights about Medical Devices Market Research Report — Forecast Till 2035

Regional Insights

North America: Fastest growing healthcare system

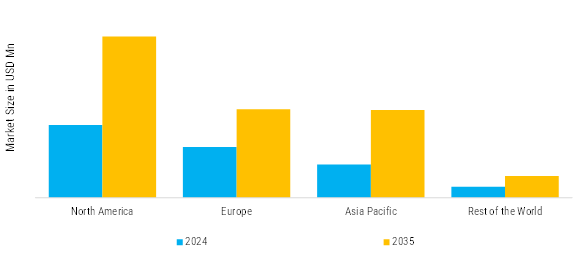
North America leads in the Medical Devices Market Size, accounting for over 40% of the global revenue in 2024. The United States leads with 32% share, driven by advanced healthcare infrastructure and high adoption of innovative technologies, while Canada holds 8% supported by strong public healthcare investments.

The United States holds the leadership position in the region market because of the presence of the major global vendors like Medtronic, Abbott, and Boston Scientific, as well as the developed ecosystem of innovation and clinical research. The market is growing at a high rate due to new investments in R&D and the speedy adoption of digital health technologies, including AI-based diagnostic tools, robotic-assisted surgery, and connected medical devices.

The increasing number of chronic illnesses such as cardiovascular diseases, diabetes and cancer is still generating the need of sophisticated diagnostic and treatment devices. Also, a growing trend toward home healthcare, distance monitoring and wearable medical equipment is transforming the way patients are served. Canada also makes some contribution, as there are favorable government policies regarding medical technology innovation and digitization of healthcare.

The U.S. Food and Drug Administration (FDA) regulatory control guarantees the quality, safety, and reliability of products, which results in a high level of consumer confidence. All in all, the technological leadership, patient awareness, and positive reimbursement structures in the region remain the key factors to its further dominance in the world medical devices market.

Medical Devices Market Regional Insights

Europe: Emerging Medical Devices

Europe Medical Devices Market size was valued at USD 192569.70 million in 2024, making it the second-largest regional market with a 30% share. The aging population, chronic diseases, and high demand of early disease detection and minimal invasive curative measures contribute to the growth of the region. Germany, United Kingdom and France are the significant contributors, which are backed with strong healthcare facilities and extensive government spending on national health.

Germany dominates with 9% due to strong medical technology manufacturing, while the United Kingdom holds 7% driven by increasing digital health adoption.

The EU Medical Device Regulation (MDR) has increased the level of transparency and patient safety in the market, though it has amplified the compliance costs on manufacturers. European companies lead in innovation of imaging systems, orthopedic implants and heart devices.

In addition, the trend of digital transformation in all healthcare systems is promoting the use of artificial intelligence-based diagnostic technologies, wearable health gadgets, and e-health applications. Sustainability and environmentally friendly manufacture processes are also on the agenda of the region, which is in line with the Green Deal policies of the EU.

Asia-Pacific: Development of healthcare system

Asia-Pacific region is also the fastest-growing market with the medical devices due to the growth of healthcare infrastructures, urbanization and growing healthcare awareness. Some of the top contributors include China, Japan, India and South Korea, with the benefits of increased disposable incomes and government policies to streamline healthcare systems. The high number of patients and the increasing incidence of chronic illnesses such as diabetes and cardiovascular diseases in the region are increasing the demand of the inexpensive diagnostic and therapeutic equipment.

China leads with 9% with market value at USD 57,771 Million supported by rapid healthcare expansion, while India accounts for 5% driven by rising healthcare investments and patient population growth.

China and Japan are international manufacturing and innovation centers, and their domestic production is high, and they have substantial investment in AI-based healthcare technologies. In the meantime, the emerging medical device manufacturing ecosystem in India with the assistance of the Make in India program and healthcare policy reform is becoming a source of foreign investment. There is an upsurge in the adoption of portable and home-care medical devices because of affordability and enhanced accessibility.

Moreover, the emergence of online healthcare startups and telemedicine portals is improving the provision of healthcare in the rural and underserved regions. Medical tourism also helps in growing the market in the region, especially in Thailand, Singapore and India. The Asia-Pacific market is likely to be a major source of medical device innovation and volume production on the planet in the next few years as regulatory frameworks continue to mature and the spending on healthcare increases.

Rest of the World: Emerging good medical devices

Rest of the World (RoW) segment - Latin America, Middle East and Africa - are emerging as a good area to grow medical devices. The growth of the market is influenced by the advancement of the healthcare infrastructure, the increase in the level of awareness about the disease and the growth of investment in the modernization of the hospitals. The main markets include Brazil, Mexico, Saudi Arabia, the UAE, and South Africa because of the current healthcare reforms and governmental promotion of the use of medical technologies.

The growing rate of infectious diseases, chronic diseases, and surgery is generating high demand of diagnostic, respiratory, and general surgery equipment. Nevertheless, regulatory systems, lack of uniform reimbursement systems and reliance on imported devices hinder growth in some regions. These barriers notwithstanding, multinational medical device firms are increasing their regional presence by partnering, manufacturing locally and training.

Middle East is especially making aggressive investments in new hospital facilities and electronic health care, Africa and Latin America are enjoying the fruits of international assistance and government-business initiatives in healthcare. The development of medical tourism and the rise in the involvement of the private sector is likely to make the RoW market one of the most important growth horizons of the world medical devices industry in the coming decade.

Key Players and Competitive Insights

Many global, regional, and local vendors characterize the Medical Devices Market. The market is highly competitive, with all the players competing to gain market share. Intense competition, rapid advances in technology, frequent changes in government policies, and environmental regulations are key factors that confront market growth. The vendors compete based on cost, product quality, reliability, and government regulations.
 
Vendors must provide cost-efficient, high-quality products to survive and succeed in an intensely competitive market. The major players in the market Include Johnson & Johnson, GE Healthcare, Stryker, Beckton Dickinson and Company, Boston Scientific Corporation, Abbott strategic market developments and decisions to improve operational effectiveness.

Key Companies in the Medical Devices Market include

Industry Developments

October 2025: Johnson & Johnson announced the Company’s intent to separate its Orthopaedics business to enhance the strategic and operational focus of each company and drive value for stakeholders. The intended separation would further strengthen the focus of Johnson & Johnson as an innovation powerhouse, serving areas of high unmet needs across Innovative Medicine and MedTech, accelerating the ongoing shift of the Company’s MedTech portfolio toward higher-growth and higher-margin markets.

July 2025: GE HealthCare has topped a U.S. Food and Drug Administration (FDA) list of AI-enabled medical device authorizations for the fourth year in a row with 100 listed authorizations to date in the U.S. This milestone reflects GE HealthCare’s continued research and development (R&D) investment and focus on developing AI solutions to advance precision care by enhancing medical devices across the care journey.

March 2025: Siemens Healthineers and Philips signed a strategic partnership to jointly develop and market advanced imaging technologies. This collaboration aims to combine Siemens Healthineers' expertise in imaging technology with Philips' strengths in data analytics and connected care solutions, creating more comprehensive healthcare solutions for hospitals and clinics.

Future Outlook

Medical Devices Market Future Outlook

The Medical Devices Market size is projected to reach USD 1,377,540 Million by 2035, growing at a CAGR of 7.21%

New opportunities lie in:

  • <p>Expansion Of Home Healthcare and Remote Patient Monitoring</p>
  • <p>R&amp;D Advancements in Next-Generation Biocompatible Viscoelastic Solutions.</p>

By 2035, the healthcare equipments market is expected to achieve substantial growth and innovation.

Market Segmentation

Medical Devices Market by End User Outlook

  • Hospitals & Clinics
  • Ambulatory Surgical Centers
  • Homecare Settings
  • Others

Medical Devices Market by Application Outlook

  • Cardiovascular Diseases
  • Diagnostic Imaging
  • Orthopedics
  • Oncology
  • General Surgery
  • Respiratory
  • ENT
  • Neurology
  • Nephrology & Urology
  • Others

Medical Devices Market Protection by Device Type Outlook

  • Drug Delivery Systems
  • Diagnostic Devices
  • Invasive Devices
  • Respiratory Therapeutic Devices
  • Electronic Medical Devices
  • Others

Report Scope

Market Size 2024

6,41,899(USD Million)

Market Size 2025

6,88,180 (USD Million)

Market Size 2035

13,77,540 (USD Million)

Compound Annual Growth Rate (CAGR)

7.21% (2025 - 2035)

Report Coverage

Revenue Forecast, Competitive Landscape, Growth Factors, and Trends

Base Year

2024

Market Forecast Period

2025 - 2035

Historical Data

2019 - 2023

Market Forecast Units

USD Million

Key Companies Profiled

Johnson & Johnson, GE Healthcare, Stryker, Beckton Dickinson and Company, Boston Scientific Corporation, Abbott

Segments Covered

By Device Type, By Application, By End User

Key Market Opportunities

Expansion Of Home Healthcare and Remote Patient Monitoring.

R&D Advancements in Next-Generation Biocompatible Viscoelastic Solutions.

Key Market Dynamics

Growing Geriatric Population and Chronic Disease Burden.

Technological Advancements and Integration of Ai in Devices.

Rising Adoption of Ophthalmic Viscoelastic Devices In Cataract and Refractive Surgeries.

Region Covered

North America, Europe, APAC, Rest of the world.


FAQs

What is the current valuation of the medical device devices market as of 2024?

<p>The medical device devices market was valued at 590.0 USD Billion in 2024.</p>

What is the projected market valuation for the medical device devices market in 2035?

<p>The market is projected to reach 850.0 USD Billion by 2035.</p>

What is the expected CAGR for the medical device devices market during the forecast period 2025 - 2035?

<p>The expected CAGR for the medical device devices market during 2025 - 2035 is 3.37%.</p>

Which companies are considered key players in the medical device devices market?

Key players include Medtronic, Abbott Laboratories, Boston Scientific, Johnson &amp; Johnson, Siemens Healthineers, Philips, Stryker Corporation, Baxter International, and GE Healthcare.

What are the major segments of the medical device devices market by application?

<p>Major segments by application include Diagnostic Devices, Therapeutic Devices, Monitoring Devices, Surgical Devices, and Rehabilitation Devices.</p>

How much was the market size for surgical devices in 2024?

<p>The market size for surgical devices was 150.0 USD Billion in 2024.</p>

What is the projected market size for monitoring devices by 2035?

<p>The market size for monitoring devices is projected to reach 140.0 USD Billion by 2035.</p>

What are the end-use segments in the medical device devices market?

<p>End-use segments include Hospitals, Clinics, Home Care, Research Laboratories, and Ambulatory Surgical Centers.</p>

What is the market size for implantable devices in 2024?

<p>The market size for implantable devices was 150.0 USD Billion in 2024.</p>

What technological advancements are influencing the medical device devices market?

<p>Technological advancements include Digital Technology, Biotechnology, Nanotechnology, Robotics, and Telemedicine.</p>

  1. SECTION I: EXECUTIVE SUMMARY AND KEY HIGHLIGHTS |
    1. EXECUTIVE SUMMARY | |
      1. Market Overview | |
      2. Key Findings | |
      3. Market Segmentation | |
      4. Competitive Landscape | |
      5. Challenges and Opportunities | |
      6. Future Outlook 2
  2. SECTION II: SCOPING, METHODOLOGY AND MARKET STRUCTURE |
    1. MARKET INTRODUCTION | |
      1. Definition | |
      2. Scope of the study | | |
    2. RESEARCH METHODOLOGY | |
      1. Overview | |
      2. Data Mining | |
      3. Secondary Research | |
      4. Primary Research | | |
      5. Forecasting Model | |
      6. Market Size Estimation | | |
      7. Data Triangulation | |
      8. Validation 3
  3. SECTION III: QUALITATIVE ANALYSIS |
    1. MARKET DYNAMICS | |
      1. Overview | |
      2. Drivers | |
      3. Restraints | |
      4. Opportunities |
    2. MARKET FACTOR ANALYSIS | |
      1. Value chain Analysis | |
      2. Porter's Five Forces Analysis | | |
      3. COVID-19 Impact Analysis | | |
  4. SECTION IV: QUANTITATIVE ANALYSIS |
    1. Healthcare, BY Application (USD Billion) | |
      1. Diagnostic Devices | |
      2. Therapeutic Devices | |
      3. Monitoring Devices | |
      4. Surgical Devices | |
      5. Rehabilitation Devices |
    2. Healthcare, BY End Use (USD Billion) | |
      1. Hospitals | |
      2. Clinics | |
      3. Home Care | |
      4. Research Laboratories | |
      5. Ambulatory Surgical Centers |
    3. Healthcare, BY Device Type (USD Billion) | |
      1. Electromechanical Devices | |
      2. Implantable Devices | |
      3. In Vitro Diagnostic Devices | |
      4. Wearable Devices | |
      5. Surgical Instruments |
    4. Healthcare, BY Technology (USD Billion) | |
      1. Digital Technology | |
      2. Biotechnology | |
      3. Nanotechnology | |
      4. Robotics | |
      5. Telemedicine |
    5. Healthcare, BY Regulatory Classification (USD Billion) | |
      1. Class I Devices | |
      2. Class II Devices | |
      3. Class III Devices | |
      4. Combination Devices | |
      5. Exempt Devices |
    6. Healthcare, BY Region (USD Billion) | |
      1. North America | | |
      2. Europe | | |
      3. APAC | | |
      4. South America | | |
      5. MEA | | |
  5. SECTION V: COMPETITIVE ANALYSIS |
    1. Competitive Landscape | |
      1. Overview | |
      2. Competitive Analysis | |
      3. Market share Analysis | |
      4. Major Growth Strategy in the Healthcare | |
      5. Competitive Benchmarking | |
      6. Leading Players in Terms of Number of Developments in the Healthcare | |
      7. Key developments and growth strategies | | |
      8. Major Players Financial Matrix | | |
    2. Company Profiles | |
      1. Medtronic (US) | | |
      2. Abbott Laboratories (US) | | |
      3. Boston Scientific (US) | | |
      4. Johnson & Johnson (US) | | |
      5. Siemens Healthineers (DE) | | |
      6. Philips (NL) | | |
      7. Stryker Corporation (US) | | |
      8. Baxter International (US) | | |
      9. GE Healthcare (US) | | |
    3. Appendix | |
      1. References | |
      2. Related Reports 6 LIST OF FIGURES |
    4. MARKET SYNOPSIS |
    5. NORTH AMERICA MARKET ANALYSIS |
    6. US MARKET ANALYSIS BY APPLICATION |
    7. US MARKET ANALYSIS BY END USE |
    8. US MARKET ANALYSIS BY DEVICE TYPE |
    9. US MARKET ANALYSIS BY TECHNOLOGY |
    10. US MARKET ANALYSIS BY REGULATORY CLASSIFICATION |
    11. CANADA MARKET ANALYSIS BY APPLICATION |
    12. CANADA MARKET ANALYSIS BY END USE |
    13. CANADA MARKET ANALYSIS BY DEVICE TYPE |
    14. CANADA MARKET ANALYSIS BY TECHNOLOGY |
    15. CANADA MARKET ANALYSIS BY REGULATORY CLASSIFICATION |
    16. EUROPE MARKET ANALYSIS |
    17. GERMANY MARKET ANALYSIS BY APPLICATION |
    18. GERMANY MARKET ANALYSIS BY END USE |
    19. GERMANY MARKET ANALYSIS BY DEVICE TYPE |
    20. GERMANY MARKET ANALYSIS BY TECHNOLOGY |
    21. GERMANY MARKET ANALYSIS BY REGULATORY CLASSIFICATION |
    22. UK MARKET ANALYSIS BY APPLICATION |
    23. UK MARKET ANALYSIS BY END USE |
    24. UK MARKET ANALYSIS BY DEVICE TYPE |
    25. UK MARKET ANALYSIS BY TECHNOLOGY |
    26. UK MARKET ANALYSIS BY REGULATORY CLASSIFICATION |
    27. FRANCE MARKET ANALYSIS BY APPLICATION |
    28. FRANCE MARKET ANALYSIS BY END USE |
    29. FRANCE MARKET ANALYSIS BY DEVICE TYPE |
    30. FRANCE MARKET ANALYSIS BY TECHNOLOGY |
    31. FRANCE MARKET ANALYSIS BY REGULATORY CLASSIFICATION |
    32. RUSSIA MARKET ANALYSIS BY APPLICATION |
    33. RUSSIA MARKET ANALYSIS BY END USE |
    34. RUSSIA MARKET ANALYSIS BY DEVICE TYPE |
    35. RUSSIA MARKET ANALYSIS BY TECHNOLOGY |
    36. RUSSIA MARKET ANALYSIS BY REGULATORY CLASSIFICATION |
    37. ITALY MARKET ANALYSIS BY APPLICATION |
    38. ITALY MARKET ANALYSIS BY END USE |
    39. ITALY MARKET ANALYSIS BY DEVICE TYPE |
    40. ITALY MARKET ANALYSIS BY TECHNOLOGY |
    41. ITALY MARKET ANALYSIS BY REGULATORY CLASSIFICATION |
    42. SPAIN MARKET ANALYSIS BY APPLICATION |
    43. SPAIN MARKET ANALYSIS BY END USE |
    44. SPAIN MARKET ANALYSIS BY DEVICE TYPE |
    45. SPAIN MARKET ANALYSIS BY TECHNOLOGY |
    46. SPAIN MARKET ANALYSIS BY REGULATORY CLASSIFICATION |
    47. REST OF EUROPE MARKET ANALYSIS BY APPLICATION |
    48. REST OF EUROPE MARKET ANALYSIS BY END USE |
    49. REST OF EUROPE MARKET ANALYSIS BY DEVICE TYPE |
    50. REST OF EUROPE MARKET ANALYSIS BY TECHNOLOGY |
    51. REST OF EUROPE MARKET ANALYSIS BY REGULATORY CLASSIFICATION |
    52. APAC MARKET ANALYSIS |
    53. CHINA MARKET ANALYSIS BY APPLICATION |
    54. CHINA MARKET ANALYSIS BY END USE |
    55. CHINA MARKET ANALYSIS BY DEVICE TYPE |
    56. CHINA MARKET ANALYSIS BY TECHNOLOGY |
    57. CHINA MARKET ANALYSIS BY REGULATORY CLASSIFICATION |
    58. INDIA MARKET ANALYSIS BY APPLICATION |
    59. INDIA MARKET ANALYSIS BY END USE |
    60. INDIA MARKET ANALYSIS BY DEVICE TYPE |
    61. INDIA MARKET ANALYSIS BY TECHNOLOGY |
    62. INDIA MARKET ANALYSIS BY REGULATORY CLASSIFICATION |
    63. JAPAN MARKET ANALYSIS BY APPLICATION |
    64. JAPAN MARKET ANALYSIS BY END USE |
    65. JAPAN MARKET ANALYSIS BY DEVICE TYPE |
    66. JAPAN MARKET ANALYSIS BY TECHNOLOGY |
    67. JAPAN MARKET ANALYSIS BY REGULATORY CLASSIFICATION |
    68. SOUTH KOREA MARKET ANALYSIS BY APPLICATION |
    69. SOUTH KOREA MARKET ANALYSIS BY END USE |
    70. SOUTH KOREA MARKET ANALYSIS BY DEVICE TYPE |
    71. SOUTH KOREA MARKET ANALYSIS BY TECHNOLOGY |
    72. SOUTH KOREA MARKET ANALYSIS BY REGULATORY CLASSIFICATION |
    73. MALAYSIA MARKET ANALYSIS BY APPLICATION |
    74. MALAYSIA MARKET ANALYSIS BY END USE |
    75. MALAYSIA MARKET ANALYSIS BY DEVICE TYPE |
    76. MALAYSIA MARKET ANALYSIS BY TECHNOLOGY |
    77. MALAYSIA MARKET ANALYSIS BY REGULATORY CLASSIFICATION |
    78. THAILAND MARKET ANALYSIS BY APPLICATION |
    79. THAILAND MARKET ANALYSIS BY END USE |
    80. THAILAND MARKET ANALYSIS BY DEVICE TYPE |
    81. THAILAND MARKET ANALYSIS BY TECHNOLOGY |
    82. THAILAND MARKET ANALYSIS BY REGULATORY CLASSIFICATION |
    83. INDONESIA MARKET ANALYSIS BY APPLICATION |
    84. INDONESIA MARKET ANALYSIS BY END USE |
    85. INDONESIA MARKET ANALYSIS BY DEVICE TYPE |
    86. INDONESIA MARKET ANALYSIS BY TECHNOLOGY |
    87. INDONESIA MARKET ANALYSIS BY REGULATORY CLASSIFICATION |
    88. REST OF APAC MARKET ANALYSIS BY APPLICATION |
    89. REST OF APAC MARKET ANALYSIS BY END USE |
    90. REST OF APAC MARKET ANALYSIS BY DEVICE TYPE |
    91. REST OF APAC MARKET ANALYSIS BY TECHNOLOGY |
    92. REST OF APAC MARKET ANALYSIS BY REGULATORY CLASSIFICATION |
    93. SOUTH AMERICA MARKET ANALYSIS |
    94. BRAZIL MARKET ANALYSIS BY APPLICATION |
    95. BRAZIL MARKET ANALYSIS BY END USE |
    96. BRAZIL MARKET ANALYSIS BY DEVICE TYPE |
    97. BRAZIL MARKET ANALYSIS BY TECHNOLOGY |
    98. BRAZIL MARKET ANALYSIS BY REGULATORY CLASSIFICATION |
    99. MEXICO MARKET ANALYSIS BY APPLICATION |
    100. MEXICO MARKET ANALYSIS BY END USE |
    101. MEXICO MARKET ANALYSIS BY DEVICE TYPE |
    102. MEXICO MARKET ANALYSIS BY TECHNOLOGY |
    103. MEXICO MARKET ANALYSIS BY REGULATORY CLASSIFICATION |
    104. ARGENTINA MARKET ANALYSIS BY APPLICATION |
    105. ARGENTINA MARKET ANALYSIS BY END USE |
    106. ARGENTINA MARKET ANALYSIS BY DEVICE TYPE |
    107. ARGENTINA MARKET ANALYSIS BY TECHNOLOGY |
    108. ARGENTINA MARKET ANALYSIS BY REGULATORY CLASSIFICATION |
    109. REST OF SOUTH AMERICA MARKET ANALYSIS BY APPLICATION |
    110. REST OF SOUTH AMERICA MARKET ANALYSIS BY END USE |
    111. REST OF SOUTH AMERICA MARKET ANALYSIS BY DEVICE TYPE |
    112. REST OF SOUTH AMERICA MARKET ANALYSIS BY TECHNOLOGY |
    113. REST OF SOUTH AMERICA MARKET ANALYSIS BY REGULATORY CLASSIFICATION |
    114. MEA MARKET ANALYSIS |
    115. GCC COUNTRIES MARKET ANALYSIS BY APPLICATION |
    116. GCC COUNTRIES MARKET ANALYSIS BY END USE |
    117. GCC COUNTRIES MARKET ANALYSIS BY DEVICE TYPE |
    118. GCC COUNTRIES MARKET ANALYSIS BY TECHNOLOGY |
    119. GCC COUNTRIES MARKET ANALYSIS BY REGULATORY CLASSIFICATION |
    120. SOUTH AFRICA MARKET ANALYSIS BY APPLICATION |
    121. SOUTH AFRICA MARKET ANALYSIS BY END USE |
    122. SOUTH AFRICA MARKET ANALYSIS BY DEVICE TYPE |
    123. SOUTH AFRICA MARKET ANALYSIS BY TECHNOLOGY |
    124. SOUTH AFRICA MARKET ANALYSIS BY REGULATORY CLASSIFICATION |
    125. REST OF MEA MARKET ANALYSIS BY APPLICATION |
    126. REST OF MEA MARKET ANALYSIS BY END USE |
    127. REST OF MEA MARKET ANALYSIS BY DEVICE TYPE |
    128. REST OF MEA MARKET ANALYSIS BY TECHNOLOGY |
    129. REST OF MEA MARKET ANALYSIS BY REGULATORY CLASSIFICATION |
    130. KEY BUYING CRITERIA OF HEALTHCARE |
    131. RESEARCH PROCESS OF MRFR |
    132. DRO ANALYSIS OF HEALTHCARE |
    133. DRIVERS IMPACT ANALYSIS: HEALTHCARE |
    134. RESTRAINTS IMPACT ANALYSIS: HEALTHCARE |
    135. SUPPLY / VALUE CHAIN: HEALTHCARE |
    136. HEALTHCARE, BY APPLICATION, 2024 (% SHARE) |
    137. HEALTHCARE, BY APPLICATION, 2024 TO 2035 (USD Billion) |
    138. HEALTHCARE, BY END USE, 2024 (% SHARE) |
    139. HEALTHCARE, BY END USE, 2024 TO 2035 (USD Billion) |
    140. HEALTHCARE, BY DEVICE TYPE, 2024 (% SHARE) |
    141. HEALTHCARE, BY DEVICE TYPE, 2024 TO 2035 (USD Billion) |
    142. HEALTHCARE, BY TECHNOLOGY, 2024 (% SHARE) |
    143. HEALTHCARE, BY TECHNOLOGY, 2024 TO 2035 (USD Billion) |
    144. HEALTHCARE, BY REGULATORY CLASSIFICATION, 2024 (% SHARE) |
    145. HEALTHCARE, BY REGULATORY CLASSIFICATION, 2024 TO 2035 (USD Billion) |
    146. BENCHMARKING OF MAJOR COMPETITORS 7 LIST OF TABLES |
    147. LIST OF ASSUMPTIONS | |
      1. |
    148. North America MARKET SIZE ESTIMATES; FORECAST | |
      1. BY APPLICATION, 2025-2035 (USD Billion) | |
      2. BY END USE, 2025-2035 (USD Billion) | |
      3. BY DEVICE TYPE, 2025-2035 (USD Billion) | |
      4. BY TECHNOLOGY, 2025-2035 (USD Billion) | |
      5. BY REGULATORY CLASSIFICATION, 2025-2035 (USD Billion) |
    149. US MARKET SIZE ESTIMATES; FORECAST | |
      1. BY APPLICATION, 2025-2035 (USD Billion) | |
      2. BY END USE, 2025-2035 (USD Billion) | |
      3. BY DEVICE TYPE, 2025-2035 (USD Billion) | |
      4. BY TECHNOLOGY, 2025-2035 (USD Billion) | |
      5. BY REGULATORY CLASSIFICATION, 2025-2035 (USD Billion) |
    150. Canada MARKET SIZE ESTIMATES; FORECAST | |
      1. BY APPLICATION, 2025-2035 (USD Billion) | |
      2. BY END USE, 2025-2035 (USD Billion) | |
      3. BY DEVICE TYPE, 2025-2035 (USD Billion) | |
      4. BY TECHNOLOGY, 2025-2035 (USD Billion) | |
      5. BY REGULATORY CLASSIFICATION, 2025-2035 (USD Billion) |
    151. Europe MARKET SIZE ESTIMATES; FORECAST | |
      1. BY APPLICATION, 2025-2035 (USD Billion) | |
      2. BY END USE, 2025-2035 (USD Billion) | |
      3. BY DEVICE TYPE, 2025-2035 (USD Billion) | |
      4. BY TECHNOLOGY, 2025-2035 (USD Billion) | |
      5. BY REGULATORY CLASSIFICATION, 2025-2035 (USD Billion) |
    152. Germany MARKET SIZE ESTIMATES; FORECAST | |
      1. BY APPLICATION, 2025-2035 (USD Billion) | |
      2. BY END USE, 2025-2035 (USD Billion) | |
      3. BY DEVICE TYPE, 2025-2035 (USD Billion) | |
      4. BY TECHNOLOGY, 2025-2035 (USD Billion) | |
      5. BY REGULATORY CLASSIFICATION, 2025-2035 (USD Billion) |
    153. UK MARKET SIZE ESTIMATES; FORECAST | |
      1. BY APPLICATION, 2025-2035 (USD Billion) | |
      2. BY END USE, 2025-2035 (USD Billion) | |
      3. BY DEVICE TYPE, 2025-2035 (USD Billion) | |
      4. BY TECHNOLOGY, 2025-2035 (USD Billion) | |
      5. BY REGULATORY CLASSIFICATION, 2025-2035 (USD Billion) |
    154. France MARKET SIZE ESTIMATES; FORECAST | |
      1. BY APPLICATION, 2025-2035 (USD Billion) | |
      2. BY END USE, 2025-2035 (USD Billion) | |
      3. BY DEVICE TYPE, 2025-2035 (USD Billion) | |
      4. BY TECHNOLOGY, 2025-2035 (USD Billion) | |
      5. BY REGULATORY CLASSIFICATION, 2025-2035 (USD Billion) |
    155. Russia MARKET SIZE ESTIMATES; FORECAST | |
      1. BY APPLICATION, 2025-2035 (USD Billion) | |
      2. BY END USE, 2025-2035 (USD Billion) | |
      3. BY DEVICE TYPE, 2025-2035 (USD Billion) | |
      4. BY TECHNOLOGY, 2025-2035 (USD Billion) | |
      5. BY REGULATORY CLASSIFICATION, 2025-2035 (USD Billion) |
    156. Italy MARKET SIZE ESTIMATES; FORECAST | |
      1. BY APPLICATION, 2025-2035 (USD Billion) | |
      2. BY END USE, 2025-2035 (USD Billion) | |
      3. BY DEVICE TYPE, 2025-2035 (USD Billion) | |
      4. BY TECHNOLOGY, 2025-2035 (USD Billion) | |
      5. BY REGULATORY CLASSIFICATION, 2025-2035 (USD Billion) |
    157. Spain MARKET SIZE ESTIMATES; FORECAST | |
      1. BY APPLICATION, 2025-2035 (USD Billion) | |
      2. BY END USE, 2025-2035 (USD Billion) | |
      3. BY DEVICE TYPE, 2025-2035 (USD Billion) | |
      4. BY TECHNOLOGY, 2025-2035 (USD Billion) | |
      5. BY REGULATORY CLASSIFICATION, 2025-2035 (USD Billion) |
    158. Rest of Europe MARKET SIZE ESTIMATES; FORECAST | |
      1. BY APPLICATION, 2025-2035 (USD Billion) | |
      2. BY END USE, 2025-2035 (USD Billion) | |
      3. BY DEVICE TYPE, 2025-2035 (USD Billion) | |
      4. BY TECHNOLOGY, 2025-2035 (USD Billion) | |
      5. BY REGULATORY CLASSIFICATION, 2025-2035 (USD Billion) |
    159. APAC MARKET SIZE ESTIMATES; FORECAST | |
      1. BY APPLICATION, 2025-2035 (USD Billion) | |
      2. BY END USE, 2025-2035 (USD Billion) | |
      3. BY DEVICE TYPE, 2025-2035 (USD Billion) | |
      4. BY TECHNOLOGY, 2025-2035 (USD Billion) | |
      5. BY REGULATORY CLASSIFICATION, 2025-2035 (USD Billion) |
    160. China MARKET SIZE ESTIMATES; FORECAST | |
      1. BY APPLICATION, 2025-2035 (USD Billion) | |
      2. BY END USE, 2025-2035 (USD Billion) | |
      3. BY DEVICE TYPE, 2025-2035 (USD Billion) | |
      4. BY TECHNOLOGY, 2025-2035 (USD Billion) | |
      5. BY REGULATORY CLASSIFICATION, 2025-2035 (USD Billion) |
    161. India MARKET SIZE ESTIMATES; FORECAST | |
      1. BY APPLICATION, 2025-2035 (USD Billion) | |
      2. BY END USE, 2025-2035 (USD Billion) | |
      3. BY DEVICE TYPE, 2025-2035 (USD Billion) | |
      4. BY TECHNOLOGY, 2025-2035 (USD Billion) | |
      5. BY REGULATORY CLASSIFICATION, 2025-2035 (USD Billion) |
    162. Japan MARKET SIZE ESTIMATES; FORECAST | |
      1. BY APPLICATION, 2025-2035 (USD Billion) | |
      2. BY END USE, 2025-2035 (USD Billion) | |
      3. BY DEVICE TYPE, 2025-2035 (USD Billion) | |
      4. BY TECHNOLOGY, 2025-2035 (USD Billion) | |
      5. BY REGULATORY CLASSIFICATION, 2025-2035 (USD Billion) |
    163. South Korea MARKET SIZE ESTIMATES; FORECAST | |
      1. BY APPLICATION, 2025-2035 (USD Billion) | |
      2. BY END USE, 2025-2035 (USD Billion) | |
      3. BY DEVICE TYPE, 2025-2035 (USD Billion) | |
      4. BY TECHNOLOGY, 2025-2035 (USD Billion) | |
      5. BY REGULATORY CLASSIFICATION, 2025-2035 (USD Billion) |
    164. Malaysia MARKET SIZE ESTIMATES; FORECAST | |
      1. BY APPLICATION, 2025-2035 (USD Billion) | |
      2. BY END USE, 2025-2035 (USD Billion) | |
      3. BY DEVICE TYPE, 2025-2035 (USD Billion) | |
      4. BY TECHNOLOGY, 2025-2035 (USD Billion) | |
      5. BY REGULATORY CLASSIFICATION, 2025-2035 (USD Billion) |
    165. Thailand MARKET SIZE ESTIMATES; FORECAST | |
      1. BY APPLICATION, 2025-2035 (USD Billion) | |
      2. BY END USE, 2025-2035 (USD Billion) | |
      3. BY DEVICE TYPE, 2025-2035 (USD Billion) | |
      4. BY TECHNOLOGY, 2025-2035 (USD Billion) | |
      5. BY REGULATORY CLASSIFICATION, 2025-2035 (USD Billion) |
    166. Indonesia MARKET SIZE ESTIMATES; FORECAST | |
      1. BY APPLICATION, 2025-2035 (USD Billion) | |
      2. BY END USE, 2025-2035 (USD Billion) | |
      3. BY DEVICE TYPE, 2025-2035 (USD Billion) | |
      4. BY TECHNOLOGY, 2025-2035 (USD Billion) | |
      5. BY REGULATORY CLASSIFICATION, 2025-2035 (USD Billion) |
    167. Rest of APAC MARKET SIZE ESTIMATES; FORECAST | |
      1. BY APPLICATION, 2025-2035 (USD Billion) | |
      2. BY END USE, 2025-2035 (USD Billion) | |
      3. BY DEVICE TYPE, 2025-2035 (USD Billion) | |
      4. BY TECHNOLOGY, 2025-2035 (USD Billion) | |
      5. BY REGULATORY CLASSIFICATION, 2025-2035 (USD Billion) |
    168. South America MARKET SIZE ESTIMATES; FORECAST | |
      1. BY APPLICATION, 2025-2035 (USD Billion) | |
      2. BY END USE, 2025-2035 (USD Billion) | |
      3. BY DEVICE TYPE, 2025-2035 (USD Billion) | |
      4. BY TECHNOLOGY, 2025-2035 (USD Billion) | |
      5. BY REGULATORY CLASSIFICATION, 2025-2035 (USD Billion) |
    169. Brazil MARKET SIZE ESTIMATES; FORECAST | |
      1. BY APPLICATION, 2025-2035 (USD Billion) | |
      2. BY END USE, 2025-2035 (USD Billion) | |
      3. BY DEVICE TYPE, 2025-2035 (USD Billion) | |
      4. BY TECHNOLOGY, 2025-2035 (USD Billion) | |
      5. BY REGULATORY CLASSIFICATION, 2025-2035 (USD Billion) |
    170. Mexico MARKET SIZE ESTIMATES; FORECAST | |
      1. BY APPLICATION, 2025-2035 (USD Billion) | |
      2. BY END USE, 2025-2035 (USD Billion) | |
      3. BY DEVICE TYPE, 2025-2035 (USD Billion) | |
      4. BY TECHNOLOGY, 2025-2035 (USD Billion) | |
      5. BY REGULATORY CLASSIFICATION, 2025-2035 (USD Billion) |
    171. Argentina MARKET SIZE ESTIMATES; FORECAST | |
      1. BY APPLICATION, 2025-2035 (USD Billion) | |
      2. BY END USE, 2025-2035 (USD Billion) | |
      3. BY DEVICE TYPE, 2025-2035 (USD Billion) | |
      4. BY TECHNOLOGY, 2025-2035 (USD Billion) | |
      5. BY REGULATORY CLASSIFICATION, 2025-2035 (USD Billion) |
    172. Rest of South America MARKET SIZE ESTIMATES; FORECAST | |
      1. BY APPLICATION, 2025-2035 (USD Billion) | |
      2. BY END USE, 2025-2035 (USD Billion) | |
      3. BY DEVICE TYPE, 2025-2035 (USD Billion) | |
      4. BY TECHNOLOGY, 2025-2035 (USD Billion) | |
      5. BY REGULATORY CLASSIFICATION, 2025-2035 (USD Billion) |
    173. MEA MARKET SIZE ESTIMATES; FORECAST | |
      1. BY APPLICATION, 2025-2035 (USD Billion) | |
      2. BY END USE, 2025-2035 (USD Billion) | |
      3. BY DEVICE TYPE, 2025-2035 (USD Billion) | |
      4. BY TECHNOLOGY, 2025-2035 (USD Billion) | |
      5. BY REGULATORY CLASSIFICATION, 2025-2035 (USD Billion) |
    174. GCC Countries MARKET SIZE ESTIMATES; FORECAST | |
      1. BY APPLICATION, 2025-2035 (USD Billion) | |
      2. BY END USE, 2025-2035 (USD Billion) | |
      3. BY DEVICE TYPE, 2025-2035 (USD Billion) | |
      4. BY TECHNOLOGY, 2025-2035 (USD Billion) | |
      5. BY REGULATORY CLASSIFICATION, 2025-2035 (USD Billion) |
    175. South Africa MARKET SIZE ESTIMATES; FORECAST | |
      1. BY APPLICATION, 2025-2035 (USD Billion) | |
      2. BY END USE, 2025-2035 (USD Billion) | |
      3. BY DEVICE TYPE, 2025-2035 (USD Billion) | |
      4. BY TECHNOLOGY, 2025-2035 (USD Billion) | |
      5. BY REGULATORY CLASSIFICATION, 2025-2035 (USD Billion) |
    176. Rest of MEA MARKET SIZE ESTIMATES; FORECAST | |
      1. BY APPLICATION, 2025-2035 (USD Billion) | |
      2. BY END USE, 2025-2035 (USD Billion) | |
      3. BY DEVICE TYPE, 2025-2035 (USD Billion) | |
      4. BY TECHNOLOGY, 2025-2035 (USD Billion) | |
      5. BY REGULATORY CLASSIFICATION, 2025-2035 (USD Billion) |
    177. PRODUCT LAUNCH/PRODUCT DEVELOPMENT/APPROVAL | |
      1. |
    178. ACQUISITION/PARTNERSHIP | |

Healthcare Market Segmentation

Healthcare By Application (USD Billion, 2025-2035)

  • Diagnostic Devices
  • Therapeutic Devices
  • Monitoring Devices
  • Surgical Devices
  • Rehabilitation Devices

Healthcare By End Use (USD Billion, 2025-2035)

  • Hospitals
  • Clinics
  • Home Care
  • Research Laboratories
  • Ambulatory Surgical Centers

Healthcare By Device Type (USD Billion, 2025-2035)

  • Electromechanical Devices
  • Implantable Devices
  • In Vitro Diagnostic Devices
  • Wearable Devices
  • Surgical Instruments

Healthcare By Technology (USD Billion, 2025-2035)

  • Digital Technology
  • Biotechnology
  • Nanotechnology
  • Robotics
  • Telemedicine

Healthcare By Regulatory Classification (USD Billion, 2025-2035)

  • Class I Devices
  • Class II Devices
  • Class III Devices
  • Combination Devices
  • Exempt Devices
Infographic

Free Sample Request

Kindly complete the form below to receive a free sample of this Report

Get Free Sample

Customer Strories

Compare Licence

×
Features License Type
Single User Multiuser License Enterprise User
Price $4,950 $5,950 $7,250
Maximum User Access Limit 1 User Upto 10 Users Unrestricted Access Throughout the Organization
Free Customization
Direct Access to Analyst
Deliverable Format
Platform Access
Discount on Next Purchase 10% 15% 15%
Printable Versions
%>