Segmentation Quick Reference
| Dimension | Sub-Segments | Dominant Segment | Fastest Growing Segment |
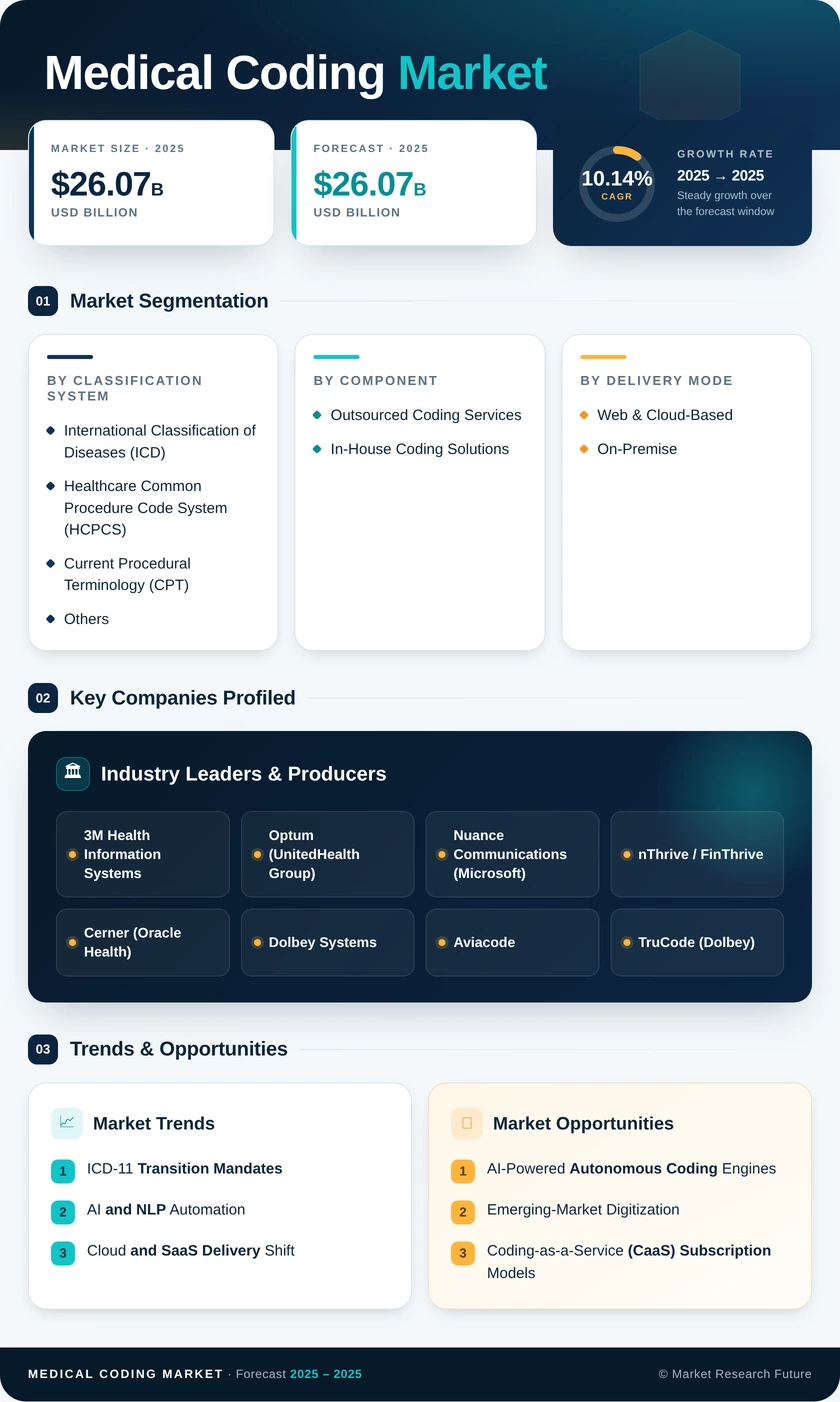
| Classification System | ICD, HCPCS, CPT, Others | International Classification of Diseases (ICD) | Medical Coding Market Common Procedure Code System (HCPCS) |
| Component | Outsourced Coding Services, In-House Coding Solutions | Outsourced Coding Services | In-House Coding Solutions |
| Delivery Mode | Web & Cloud-Based, On-Premise | Web & Cloud-Based | Web & Cloud-Based |
| End User | Hospitals, Physician Practices, Insurance Payers, Ambulatory Surgery Centers | Hospitals | Insurance Payers |
| Specialty Type | Radiology, Oncology, Cardiology, Orthopedics, Others | Radiology | Oncology |
Market Segmentation Overview
By Classification System
| Sub-Segment | Key Trend |
| International Classification of Diseases (ICD) | ICD-11 transition driving upgrade investments globally; 71.2% share in 2025 |
| Medical Coding Market Common Procedure Code System (HCPCS) | Outpatient and ambulatory procedure growth is accelerating HCPCS adoption |
| Current Procedural Terminology (CPT) | Physician professional fee coding remains a core revenue-cycle function |
| Others | National and specialty classification systems for niche clinical domains |
The ICD classification system remains the backbone of the Medical Coding Market, underpinned by universal regulatory mandates for morbidity reporting. The ongoing ICD-11 transition is creating a multi-year investment cycle as health systems upgrade their diagnosis coding systems and retrain clinical documentation coding staff to accommodate post-coordination and extension-code logic.
By Component
| Sub-Segment | Key Trend |
| Outsourced Coding Services | Workforce shortages and cost efficiency are driving outsourcing demand |
| In-House Coding Solutions | AI-powered platforms enabling large health systems to internalize coding. |
Outsourced coding services dominate the component landscape as the persistent 30%+ coder shortfall compels providers to engage third-party CPT clinical code assignment specialists. In-house solutions are gaining traction among large integrated delivery networks that invest in proprietary AI engines for healthcare billing codes automation.
By Delivery Mode
| Sub-Segment | Key Trend |
| Web & Cloud-Based | Remote coding enablement; real-time regulatory update deployment |
| On-Premise | Legacy installations in data-sensitive environments; declining share |
Cloud platforms account for the majority of new deployments, enabling scalable, subscription-based access to ICD-10 procedure coding tools. On-premise solutions persist primarily in organizations with strict data sovereignty or regulatory constraints.
By End User
| Sub-Segment | Key Trend |
| Hospitals | Highest encounter complexity; DRG and case-mix coding requirements |
| Physician Practices | E/M coding and professional fee documentation |
| Insurance Payers | Pre-payment claims editing and fraud-detection analytics |
| Ambulatory Surgery Centers | Rapid outpatient volume growth is driving procedure-code adoption. |
Hospitals lead the end-user landscape due to the complexity and volume of inpatient diagnosis coding systems requirements. Insurance payers are the fastest-growing segment as they deploy advanced healthcare billing codes validation algorithms to reduce claims leakage.
By Specialty Type
| Sub-Segment | Key Trend |
| Radiology | High imaging volumes requiring precise CPT modality codes |
| Oncology | Complex multi-drug and immunotherapy regimen coding |
| Cardiology | Interventional and diagnostic procedure coding depth |
| Orthopedics | Surgical implant and device coding complexity |
| Others | Multi-specialty ambulatory and primary-care coding |
Radiology maintains the largest specialty share due to sheer imaging encounter volume and the CPT clinical code assignment intensity of modality-specific billing. Oncology is the fastest-growing specialty, as clinical documentation coding for immunotherapy, targeted therapy, and clinical-trial encounters requires increasingly granular diagnosis coding systems expertise.