ID: MRFR/HC/5967-HCR | February 2021 | Region: Global | 110 pages
Market Scenario
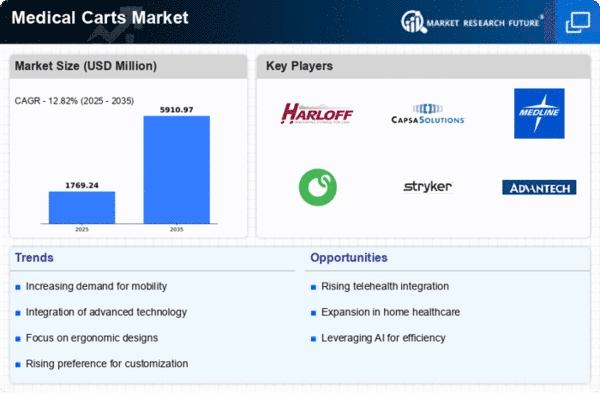
Global medical carts market is expected to grow significantly over the forecast period. The market held a market value of USD 1,100 million in 2017 and is projected to grow at a CAGR of 12.1% over the forecast period.
Medical carts are one of the most vital components in treating patients. Moreover, in cases of medical emergency hospital requires a rapid response in which medical carts play an important role. Increasing prevalence of musculoskeletal injury and technological advancements in medical devices are major factors responsible for the growth of the medical carts during forecast period.
Moreover, the easy availability of advanced medical cart through e-commerce and retail stores and increasing use of such devices at home are anticipated to fuel the growth of the global medical carts market. According to United States Bone and Joint Initiative, most of the musculoskeletal injuries occurred to people between the ages of 18 and 64 years are in the United States.
However, factors such as, high cost of advanced medical carts in developing countries may hamper the market growth during the forecast period.
Segmentation
The global medical carts market is segmented based on product type, type, material type, and end-users.
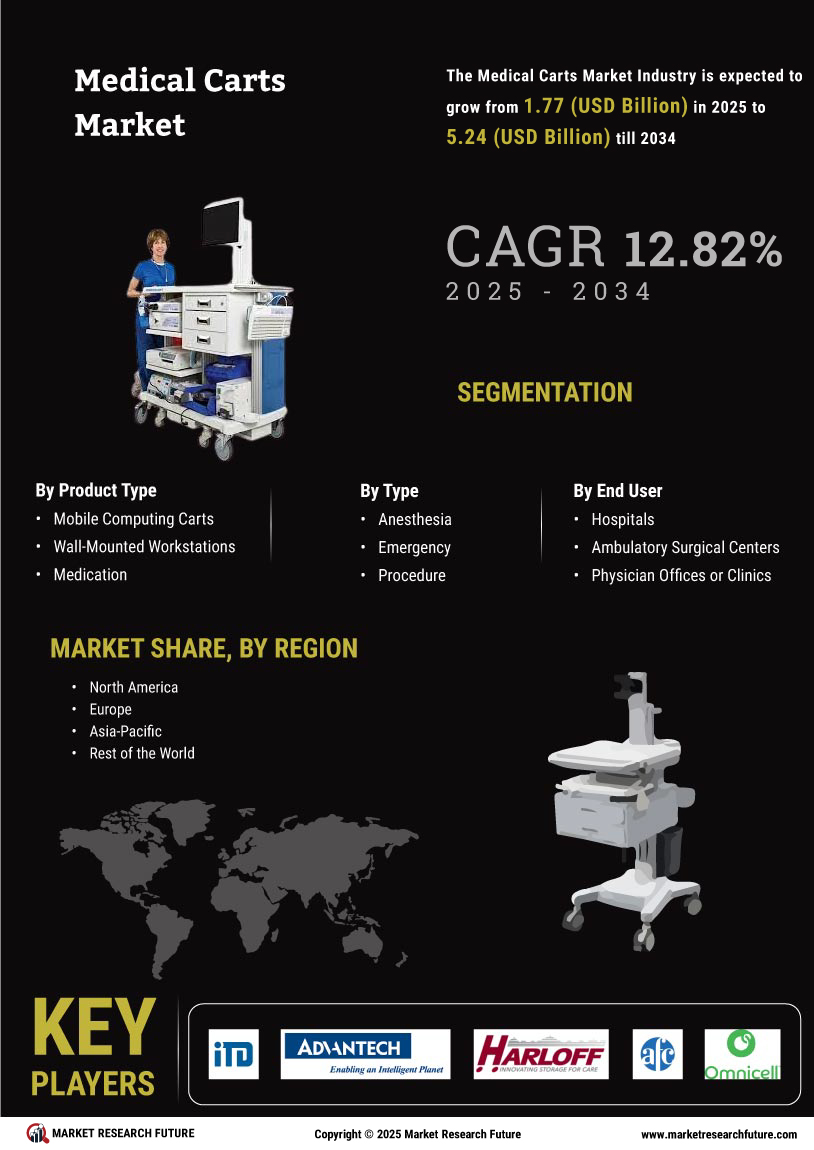
The medical carts market, by product type, the market is segmented into mobile computing carts, medical storage columns, wall-mounted workstations, medication carts, and others.
Based on type, the market is segmented into computer medical cart, procedure cart, emergency cart, anaesthesia cart, and others.
Based on material type, the market is segmented into metal type, plastic type, and others.
Based on end-user, the market is segmented into hospitals and clinics, ambulatory surgical centres, and others.
On the basis of region, the global medical carts market is segmented into the Americas, Europe, Asia-Pacific, and the Middle East and Africa. The Americas is sub-segmented into North America and Latin America. The North American region is further segmented into the US and Canada. The European region is divided into two, namely, Western Europe and Eastern Europe. Western Europe is further classified into Germany, Italy, France, the UK, Spain, and the rest of Western Europe. The Asia-Pacific region is sub-segmented into Japan, China, India, Australia, the Republic of Korea, and the rest of Asia-Pacific. The Middle Eastern and African region is sub-segmented into the United Arab Emirates, Saudi Arabia, Oman, Kuwait, Qatar, and the rest of the Middle East and Africa.
Regional Market Summary:
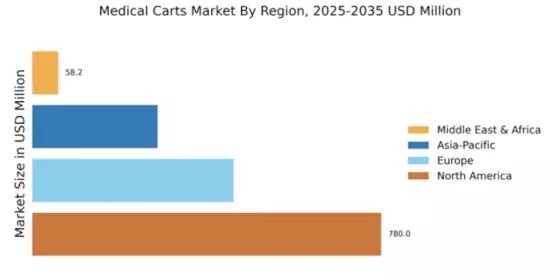
Global Medical Carts Market Share (%), by Region, 2017
Sources: Centers for Disease Control and Prevention (CDC), World Health Organization (WHO), US Department of Health and Human Services, National Institutes of Health, Company’s Annual Report
The Americas region dominated the global medical carts market in 2017, owing to the presence of major market participants & sophisticated healthcare infrastructure and comparatively higher adoption of advanced medical devices in the US and Canada.
Europe hoisted as the second largest region for the global medical carts market owing to increasing geriatric population along with the rise in the number of numerous surgeries is are expected to provide this market with lucrative growth opportunities.
Asia-Pacific was projected to be the fastest growing region for the global medical carts market in 2017. The factors attributed to the due to the increasing focus on patient safety and increasing expenditure in healthcare infrastructure.
The Middle East and Africa holds the least share in the medical carts market due to the presence of poor health expenditure and economically diverse countries. However, the market is expected to witness growth due to increasing healthcare programs in the Middle East.
Intended Audience
Market Segmentation and Key Market Players
Global Medical Carts Market, by Product Type
Global Medical Carts Market, by Type
Global Medical Carts Market, by Material Type
Global Medical Carts Market, by End User
Global Medical Carts Market, by Region
Global Medical Carts Market, by Key Players
Frequently Asked Questions (FAQ) :
The global medical carts market was valued at USD 1.1 billion in 2017.
The global medical carts market is expected to exhibit a strong 12.1% CAGR over the forecast period from 2018 to 2023.
The increasing availability of medical carts on online shopping portals and the increasing use of medical carts in home care are the major drivers for the medical carts market.
The Americas, followed by Europe, is the leading regional market for medical carts.
Leading players in the medical carts market include ITD GmbH, Advantech Co. Ltd., Harloff Manufacturing Co., AFC Industries, Omnicell Inc., Midmark Corporation, The Bergmann Group, Capsa Healthcare, Jaco Inc., and Ergotron Inc., among others.
Table of Contents:
Chapter 1. Report Prologue
Chapter 2. Market Introduction
2.1 Definition
2.2 Scope of the Study
2.2.1 Research Objective
2.2.2 Assumptions
2.2.3 Limitations
Chapter 3. Research Methodology
3.1 Introduction
3.2 Primary Research
3.3 Secondary Research
3.4 Market Size Estimation
Chapter 4. Market Dynamics
4.1 Drivers
4.2 Restraints
4.3 Opportunities
4.4 Challenges
4.5 Macroeconomic Indicators
4.6 Application Trends & Assessment
Chapter 5. Market Factor Analysis
5.1 Porter’s Five Forces Analysis
5.1.1 Bargaining Power of Suppliers
5.1.2 Bargaining Power of Buyers
5.1.3 Threat of New Entrants
5.1.4 Threat of Substitutes
5.1.5 Intensity of Rivalry
5.2 Value Chain Analysis
5.3 Investment Feasibility Analysis
5.4 Pricing Analysis
Chapter 6. Global Medical Carts Market, by Product Type
6.1 Introduction
6.2 Mobile Computing Carts
Market Estimates & Forecast, by Region, 2018–2023
Market Estimates & Forecast, by Country, 2018–2023
6.3 Medical Storage Columns
Market Estimates & Forecast, by Region, 2018–2023
Market Estimates & Forecast, by Country, 2018–2023
6.4 Wall-Mounted Workstations
Market Estimates & Forecast, by Region, 2018–2023
Market Estimates & Forecast, by Country, 2018–2023
6.5 Medication Carts
Market Estimates & Forecast, by Region, 2018–2023
Market Estimates & Forecast, by Country, 2018–2023
6.6 Others
Market Estimates & Forecast, by Region, 2018–2023
Market Estimates & Forecast, by Country, 2018–2023
Chapter 7. Global Medical Carts Market, by Type
7.1 Introduction
7.2 Computer Medical Cart
Market Estimates & Forecast, by Region, 2018–2023
Market Estimates & Forecast, by Country, 2018–2023
7.3 Procedure Cart
Market Estimates & Forecast, by Region, 2018–2023
Market Estimates & Forecast, by Country, 2018–2023
7.4 Emergency Cart
Market Estimates & Forecast, by Region, 2018–2023
Market Estimates & Forecast, by Country, 2018–2023
7.5 Anesthesia Cart
Market Estimates & Forecast, by Region, 2018–2023
Market Estimates & Forecast, by Country, 2018–2023
Chapter 8. Global Medical Carts Market, by Material Type
8.1 Introductio
8.2 Metal Type
Market Estimates & Forecast, by Region, 2018–2023
Market Estimates & Forecast, by Country, 2018–2023
8.3 Plastic Type
Market Estimates & Forecast, by Region, 2018–2023
Market Estimates & Forecast, by Country, 2018–2023
8.4 Others
Market Estimates & Forecast, by Region, 2018–2023
Market Estimates & Forecast, by Country, 2018–2023
Chapter 9. Global Medical Carts Market, by End-Users
9.1 Introduction
9.2 Hospitals & Clinics
Market Estimates & Forecast, by Region, 2018–2023
Market Estimates & Forecast, by Country, 2018–2023
9.2 Ambulatory Surgical Centers
Market Estimates & Forecast, by Region, 2018–2023
Market Estimates & Forecast, by Country, 2018–2023
9.3 Others
Market Estimates & Forecast, by Region, 2018–2023
Market Estimates & Forecast, by Country, 2018–2023
Chapter 10. Global Medical Carts Market, by Region
10.1 Introduction
10.2 Americas
10.2.1 North America
10.2.1.1 US
10.2.1.2 Canada
10.2.2 Latin America
10.3 Europe
10.3.1 Western Europe
10.3.1.1 Germany
10.3.1.2 France
10.3.1.3 Italy
10.3.1.4 Spain
10.3.1.5 UK
10.3.1.6 Rest of Western Europe
10.3.2 Eastern Europe
10.4 Asia-Pacific
10.4.1 Japan
10.4.2 China
10.4.3 India
10.4.4 Australia
10.4.5 South Korea
10.4.6 Rest of Asia-Pacific
10.5 Middle East & Africa
10.5.1 Middle East
10.5.2 Africa
Chapter 11. Company Landscape
11.1 Introduction
11.2 Market Share Analysis
11.3 Key Development & Strategies
Chapter 12. Company Profiles
12.1 ITD GmbH
12.1.1 Company Overview
12.1.2 Product Overview
12.1.3 Financials Overview
12.1.4 Key Developments
12.1.5 SWOT Analysis
12.2 Advantech Co., Ltd
12.2.1 Company Overview
12.2.2 Product Overview
12.2.3 Financial Overview
12.2.4 Key Developments
12.2.5 SWOT Analysis
12.3 Harloff Manufacturing Co.
12.3.1 Company Overview
12.3.2 Product Overview
12.3.3 Financial Overview
12.3.4 Key Development
12.3.5 SWOT Analysis
12.4 AFC Industries
12.4.1 Company Overview
12.4.2 Application s/Business Segment Overview
12.4.3 Financial Overview
12.4.4 Key Development
12.4.5 SWOT Analysis
12.5 Chang Gung Medical Technology Co.
12.5.1 Company Overview
12.5.2 Product Overview
12.5.3 Financial overview
12.5.4 Key Developments
12.5.5 SWOT Analysis
12.6 Omnicell Inc
12.6.1 Company Overview
12.6.2 Product Overview
12.6.3 Financial Overview
12.6.4 Key Developments
12.6.5 SWOT Analysis
12.7 Midmark Corporation
12.7.1 Overview
12.7.2 Product Overview
12.7.3 Financial Overview
12.7.4 Key Developments
12.7.5 SWOT Analysis
12.8 The Bergmann Group
12.8.1 Overview
12.8.2 Product/ Application Overview
12.8.3 Financials
12.8.4 Key Developments
12.8.5 SWOT Analysis
12.9 Capsa Healthcare
12.9.1 Overview
12.9.2 Product Overview
12.9.3 Financials
12.9.4 Key Developments
12.9.5 SWOT Analysis
12.9 Jaco Inc
12.9.1 Overview
12.9.2 Product Overview
12.9.3 Financials
12.9.4 Key Developments
12.9.5 SWOT Analysis
12.10 Waterloo Healthcare
12.10.1 Overview
12.10.2 Product Overview
12.10.3 Financials
12.10.4 Key Developments
12.10.5 SWOT Analysis
Chapter 13 MRFR Conclusion
13.1 Key Findings
13.1.1 From CEO’s Viewpoint
13.1.2 Unmet Needs of the Market
13.2 Key Companies to Watch
Chapter 14. Appendix
LIST OF TABLES
Table 1 Global Medical Carts Market Market Synopsis, 2018–2023
Table 2 Global Medical Carts Market Estimates and Forecast, 2018–2023 (USD Million)
Table 3 Global Medical Carts Market, by Region, 2018–2023 (USD Million)
Table 4 Global Medical Carts Market, by Product, 2018–2023 (USD Million)
Table 5 Global Medical Carts Market, by Site, 2018–2023 (USD Million)
Table 6 Global Medical Carts Market, by Application, 2018–2023 (USD Million)
Table 7 Global Medical Carts Market, by End-Users, 2018–2023 (USD Million)
Table 8 North America: Medical Carts Market, by Product, 2018–2023(USD Million)
Table 9 North America: Medical Carts Market, by Site, 2018–2023 (USD Million)
Table 10 North America: Medical Carts Market, by Application, 2018–2023 (USD Million)
Table 11 North America: Medical Carts Market End-Users, by, 2018–2023 (USD Million)
Table 12 US: Medical Carts Market, by Product, 2018–2023 (USD Million)
Table 13 US: Medical Carts Market, by Site, 2018–2023 (USD Million)
Table 14 US: Medical Carts Market, by Application, 2018–2023 (USD Million)
Table 15 US: Medical Carts Market, by End-Users, 2018–2023 (USD Million)
Table 16 Canada: Medical Carts Market,by Product, 2018–2023 (USD Million)
Table 17 Canada: Medical Carts Market, by Site, 2018–2023 (USD Million)
Table 18 Canada: Medical Carts Market, by Application, 2018–2023 (USD
Million)
Table 19 Canada: Medical Carts Market,by End-Users, 2018–2023 (USD Million)
Table 20 South America: Medical Carts Market, by Product, 2018–2023 (USD Million)
Table 21 South America: Medical Carts Market, by Site, 2018–2023 (USD Million)
Table 22 South America: Medical Carts Market, by Application, 2018–2023 (USD Million)
Table 23 South America: Medical Carts Market, by End-Users, 2018–2023 (USD Million)
Table 24 Europe: Medical Carts Market, by Product, 2018–2023 (USD Million)
Table 25 Europe: Medical Carts Market, by Site, 2018–2023 (USD Million)
Table 26 Europe: Medical Carts Market, by Application, 2018–2023 (USD Million)
Table 27 Europe: Medical Carts Market, by End-Users, 2018–2023 (USD Million)
Table 28 Western Europe: Medical Carts Market, by Product, 2018–2023(USD Million)
Table 29 Western Europe: Medical Carts Market, by Site, 2018–2023 (USD Million)
Table 30 Western Europe: Medical Carts Market, by Application, 2018–2023 (USD Million)
Table 31 Western Europe: Medical Carts Market, by End-Users, 2018–2023 (USD Million)
Table 32 Eastern Europe: Medical Carts Market, by Product, 2018–2023 (USD Million)
Table 33 Eastern Europe: Medical Carts Market, by Site, 2018–2023 (USD Million)
Table 34 Eastern Europe: Medical Carts Market, by Application, 2018–2023
(USD Million)
Table 35 Eastern Europe: Medical Carts Market, by End-Users, 2018–2023
(USD Million)
Table 36 Asia-Pacific: Medical Carts Market, by Product, 2018–2023 (USD
Million)
Table 37 Asia-Pacific: Medical Carts Market, by Site, 2018–2023 (USD
Million)
Table 38 Asia-Pacific: Medical Carts Market, by Application, 2018–2023 (USD
Million)
Table 39 Asia-Pacific: Medical Carts Market, by End-Users, 2018–2023 (USD
Million)
Table 40 Middle East & Africa: Medical Carts Market, by Product, 2018–2023
(USD Million)
Table 41 Middle East & Africa: Medical Carts Market, by Site, 2018–2023
(USD Million)
Table 42 Middle East & Africa: Medical Carts Market, by Application, 2018–2023
(USD Million)
Table 43 Middle East & Africa: Medical Carts Market, by End-Users, 2018–2023 (USD Million)
LIST OF FIGURES
Figure 1 Research Process
Figure 2 Segmentation for Global Medical Carts Market
Figure 3 Segmentation Market Dynamics for Global Medical Carts Market
Figure 4 Global Medical Carts Market Share, by Product, 2018
Figure 5 Global Medical Carts Market Share, by Site, 2018
Figure 6 Global Medical Carts Market Share, by Application, 2018
Figure 7 Global Medical Carts Market Share, by End-Users, 2018
Figure 8 Global Medical Carts Market Share, by Region, 2018
Figure 9 North America: Medical Carts Market Share, by Country, 2018
Figure 10 Europe: Medical Carts Market Share, by Country, 2018
Figure 11 Asia-Pacific: Medical Carts Market Share, by Country, 2018
Figure 12 Middle East & Africa: Medical Carts Market Share, by Country, 2018
Figure 13 Global Medical Carts Market: Company Share Analysis, 2018 (%)
Figure 14 ITD GmbH : Key Financials
Figure 15 ITD GmbH : Segmental Revenue
Figure 16 ITD GmbH : Geographical Revenue
Figure 17 Advantech Co., Ltd: Key Financials
Figure 18 Advantech Co., Ltd: Segmental Revenue
Figure 19 Advantech Co., Ltd: Geographical Revenue
Figure 20 Harloff Manufacturing Co. : Key Financials
Figure 21 Harloff Manufacturing Co. : Segmental Revenue
Figure 22 Harloff Manufacturing Co. : Geographical Revenue
Figure 23 AFC Industries : Key Financials
Figure 24 AFC Industries : Segmental Revenue
Figure 25 AFC Industries : Geographical Revenue
Figure 26 Chang Gung Medical Technology Co. : Key Financials
Figure 27 Chang Gung Medical Technology Co. : Segmental Revenue
Figure 28 Chang Gung Medical Technology Co. :Geographical Revenue
Figure 29 Omnicell Inc : Key Financials
Figure 30 Omnicell Inc :Segmental Revenue
Figure 31 Omnicell Inc :Geographical Revenue
Figure 32 Ashai Kasei Corporation: Key Financials
Figure 33 Asahi Kasei Corporation: Segmental Revenue
Figure 34 Ashai Kasei Corporation: Geographical Revenue
Figure 35 Nikkiso Co.Ltd: Key Financials
Figure 36 Nikkiso Co.Ltd: Segmental Revenue
Figure 37 Nikkiso Co.Ltd: Geographical Revenue
Figure 38 Midmark Corporation : Key Financials
Figure 39 Midmark Corporation : Segmental Revenue
Figure 40 Midmark Corporation : Geographical Revenue
Figure 41 The Bergmann Group : Key Financials
Figure 42 The Bergmann Group : Segmental Revenue
Figure 43 The Bergmann Group : Geographical Revenue
Figure 44 Capsa Healthcare : Key Financials
Figure 45 Capsa Healthcare :Segmental Revenue
Figure 46 Capsa Healthcare : Geographical Revenue
Figure 47 Jaco Inc: Key Financials
Figure 48 Jaco Inc: Segmental Revenue
Figure 49 Jaco Inc: Geographical Revenue
Figure 50 Waterloo Healthcare : Key Financials
Figure 51 Waterloo Healthcare : Segmental Revenue
Figure 52 Waterloo Healthcare :Geographical Revenue
Figure 53 Concept Laser GmbH: Key Financials
Figure 54 Concept Laser GmbH.: Segmental Revenue
Figure 55 Concept Laser GmbH :Geographical Revenue
Figure 56 Renishaw plc: Key Financials
Figure 57 Renishaw plc: Segmental Revenue
Figure 58 Renishaw plc :Geographical Revenue
Figure 59 Prodways Group: Key Financials
Figure 60 Prodways Group: Segmental Revenue
Figure 61 Prodways Group: Geographical Revenue
Figure 62 3T RPD Ltd: Key Financials
Figure 63 3T RPD Ltd: Segmental Revenue
Figure 64 3T RPD Ltd: Geographical Revenue
This table of content is tentative and subject to change as the research progresses.
Please Note: Financial details of company cannot be provided if the information of the company is not available in public domain and or reliable source.