Segmentation Quick Reference
| Dimension | Sub-Segments | Dominant Segment | Fastest Growing Segment |
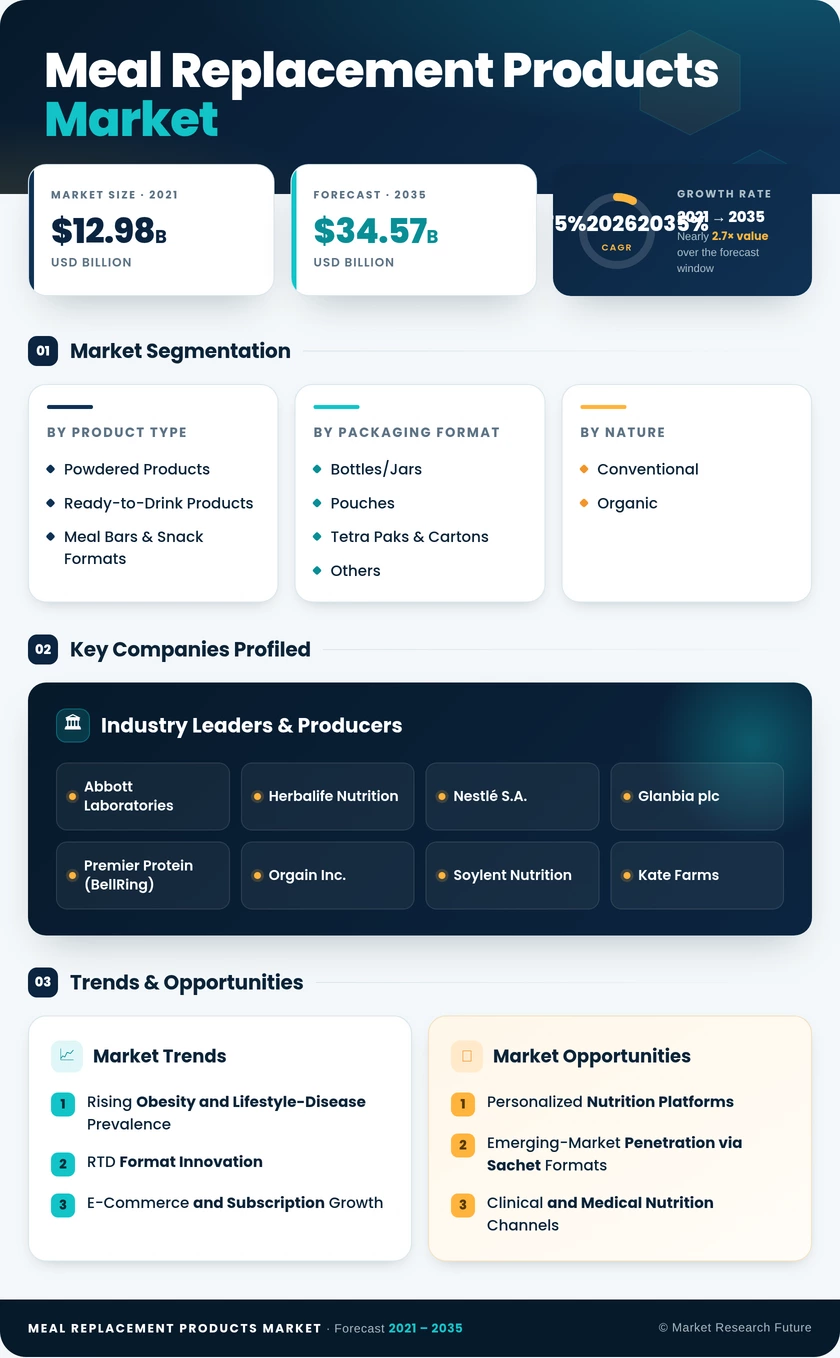
| Product Type | Powdered Products, Ready-to-Drink Products, Meal Bars & Snack Formats | Powdered Products | Ready-to-Drink Products |
| Packaging Format | Bottles/Jars, Pouches, Tetra Paks & Cartons, Others | Bottles/Jars | Tetra Paks & Cartons |
| Nature | Conventional, Organic | Conventional | Organic |
| Distribution Channel | Supermarkets/Hypermarkets, Online Retailers, Specialty Health Stores, Others | Supermarkets/Hypermarkets | Online Retailers |
| Region | North America, Europe, Asia-Pacific, South America, Middle East & Africa | North America | Asia-Pacific |
Market Segmentation Overview
By Product Type
| Sub-Segment | Key Trend |
| Powdered Products | Customizable blending with plant milks and functional add-ins drives consumer engagement |
| Ready-to-Drink Products | Aseptic processing and zero-prep convenience fuel the fastest format growth |
| Meal Bars & Snack Formats | On-the-go portability and portion control appeal to commuter demographics |
Powdered products continue to anchor the meal replacement products market due to their lower cost per serving and formulation flexibility, while RTD shakes are rapidly gaining share through innovation in aseptic technology and ambient-stable packaging.
By Packaging Format
| Sub-Segment | Key Trend |
| Bottles/Jars | Strong retail shelf presence and consumer familiarity maintain dominance |
| Pouches | Lightweight, lower-material-cost format gaining traction in e-commerce fulfillment |
| Tetra Paks & Cartons | Ambient shelf stability and stackable logistics drive the fastest packaging growth |
| Others | Specialty clinical packaging for hospital and institutional channels |
Bottles and jars remain the primary packaging choice across supermarket and pharmacy channels, though Tetra Pak cartons are emerging as the preferred format for subscription-based and ambient-logistics models.
By Nature
| Sub-Segment | Key Trend |
| Conventional | Price competitiveness and broad distribution sustain volume leadership |
| Organic | Clean-label demand and USDA/EU Organic certification premiums drive above-average growth |
Conventional formulations dominate total volume, but organic products are capturing an increasing share of premium shelf space, particularly in Western Europe and coastal US markets where clean-label preferences are strongest.
By Distribution Channel
| Sub-Segment | Key Trend |
| Supermarkets/Hypermarkets | In-store trial, impulse purchasing, and promotional bundling lead the channel |
| Online Retailers | Subscription auto-ship and DTC models deliver the highest growth rate |
| Specialty Health Stores | Expert-guided purchasing and curated assortments command premium pricing |
| Others | Pharmacy, clinical, and military commissary channels expanding steadily |
Supermarkets and hypermarkets lead revenue generation, but online retailers are the fastest-growing channel as digitally native brands and subscription platforms reshape how consumers purchase meal replacement products.