Marine Engine Monitoring System Market (2026 – 2035)

ID: MRFR/SEM/28944-HCR 128 Pages Aarti Dhapte Last Updated: October 09, 2026
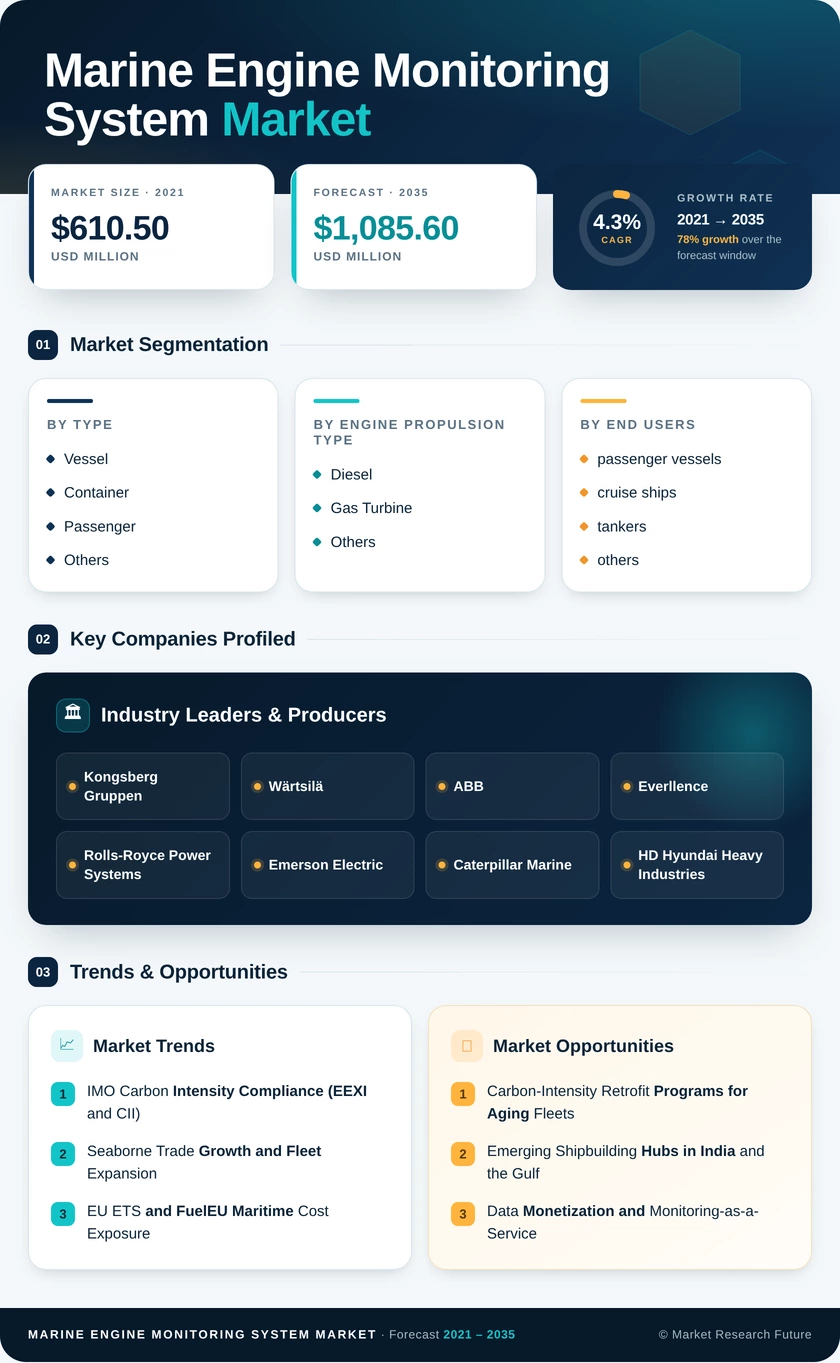
Marine Engine Monitoring System Market Size, Share and Research Report By Type (Vessels, Containers, Passenger Vessels, Others), By Engine Propulsion Type (Diesel, Gas Turbine, Others), By End User (Passenger Vessels, Cruise Ships, Tankers, Others) and By Regional (North America, Europe, Asia-Pacific, South America, Middle East and Africa) - Industry Forecast to 2035.
Marine Engine Monitoring System Market
Market Size
Forecast Period2026-2035
CAGR (2026-2035)4.3%
2025 Market SizeUSD 712.6 Million
2035 Market SizeUSD 1,085.6 Million
Key Players
Kongsberg Gruppen
Wärtsilä
ABB
Everllence
Rolls-Royce Power Systems
Emerson Electric
Opportunities
  • Carbon-Intensity Retrofit Programs for Aging Fleets
  • Emerging Shipbuilding Hubs in India and the Gulf
  • Data Monetization and Monitoring-as-a-Service
  1. 1 Market Summary | |
  2. 2 Key Report Takeaways | |
    1. 2.1 By Type | |
    2. 2.2 By Engine Propulsion Type | |
    3. 2.3 By End Users | |
    4. 2.4 By Region | |
  3. 3 Market Size and Forecast (2021–2035) | |
  4. 4 Driver Impact Analysis | |
    1. 4.1 IMO Carbon Intensity Compliance (EEXI and CII) | |
    2. 4.2 Seaborne Trade Growth and Fleet Expansion | |
    3. 4.3 EU ETS and FuelEU Maritime Cost Exposure | |
    4. 4.4 Predictive Maintenance and Real-Time Connectivity | |
    5. 4.5 Alternative-Fuel and Dual-Fuel Engine Adoption | |
    6. 4.6 Cruise and Passenger Fleet Expansion | |
    7. 4.7 Naval Fleet Modernization | |
  5. 5 Restraints Impact Analysis | |
    1. 5.1 High Retrofit and Integration Costs | |
    2. 5.2 Oil and Gas Price Volatility | |
    3. 5.3 Cybersecurity Exposure and Compliance Burden | |
    4. 5.4 Legacy Protocol Fragmentation | |
    5. 5.5 Shortage of Skilled Marine Engineers | |
  6. 6 Opportunities | |
    1. 6.1 Carbon-Intensity Retrofit Programs for Aging Fleets | |
    2. 6.2 Emerging Shipbuilding Hubs in India and the Gulf | |
    3. 6.3 Data Monetization and Monitoring-as-a-Service | |
    4. 6.4 Monitoring for Ammonia and Methanol Engines | |
    5. 6.5 Digital Twins for Naval and Government Fleets | |
  7. 7 Regional Market Share and Country-Level Analysis | |
    1. 7.1 North America | | |
      1. 7.1.1 United States | | |
      2. 7.1.2 Canada | | |
      3. 7.1.3 Rest of North America | |
    2. 7.2 Europe | | |
      1. 7.2.1 Germany | | |
      2. 7.2.2 United Kingdom | | |
      3. 7.2.3 France | | |
      4. 7.2.4 Italy | | |
      5. 7.2.5 Rest of Europe | |
    3. 7.3 Asia-Pacific | | |
      1. 7.3.1 China | | |
      2. 7.3.2 India | | |
      3. 7.3.3 Japan | | |
      4. 7.3.4 South Korea | | |
      5. 7.3.5 Rest of Asia-Pacific | |
    4. 7.4 Rest of the World | | |
      1. 7.4.1 South America | | |
      2. 7.4.2 Middle East and Africa | |
  8. 8 Future Outlook (2026–2035) | |
    1. 8.1 AI-Driven Predictive Analytics and Autonomous Engine Rooms | |
    2. 8.2 Platform Economics and OEM Data Ecosystems | |
    3. 8.3 The Fuel Transition Supercycle | |
    4. 8.4 Emissions Verification and ESG Reporting | |
  9. 9 Segmentation Analysis | |
    1. 9.1 By Type | | |
      1. 9.1.1 Vessel | | |
      2. 9.1.2 Container | | |
      3. 9.1.3 Passenger | | |
      4. 9.1.4 Others | |
    2. 9.2 By Engine Propulsion Type | | |
      1. 9.2.1 Diesel | | |
      2. 9.2.2 Gas Turbine | | |
      3. 9.2.3 Others | |
    3. 9.3 By End Users | | |
      1. 9.3.1 Passenger vessels | | |
      2. 9.3.2 Cruise ships | | |
      3. 9.3.3 tankers | | |
      4. 9.3.4 others | |
  10. 10 Competitive Landscape | |
    1. 10.1 Market Concentration Analysis | |
    2. 10.2 Competitive Benchmarking Matrix | |
    3. 10.3 Company Profiles | | |
      1. 10.3.1 Kongsberg Gruppen | | |
      2. 10.3.2 Wärtsilä | | |
      3. 10.3.3 ABB | | |
      4. 10.3.4 Everllence | | |
      5. 10.3.5 Rolls-Royce Power Systems | | |
      6. 10.3.6 Emerson Electric | | |
      7. 10.3.7 Caterpillar Marine | | |
      8. 10.3.8 HD Hyundai Heavy Industries | | |
      9. 10.3.9 Mitsubishi Heavy Industries | | |
      10. 10.3.10 Volvo Penta | | |
      11. 10.3.11 Praxis Automation Technology | |
  11. 11 Recent News & Developments | |
  12. 12 Report Scope and Methodology | |
  13. 13 Detailed Sources and Citations | |
  14. 14 Frequently Asked Questions (FAQs) | | LIST OF TABLES | |
  15. TABLE 1 Report Highlights Summary, 2025–2035 | |
  16. TABLE 2 Global Market Size and Forecast, by Revenue, 2021–2035 (USD Million) | |
  17. TABLE 3 Driver Impact Analysis, 2026–2035 | |
  18. TABLE 4 Restraints Impact Analysis, 2026–2035 | |
  19. TABLE 5 Regional Market Summary, 2025 | |
  20. TABLE 6 North America Market, by Country | |
  21. TABLE 7 Europe Country-Level Analysis | |
  22. TABLE 8 Asia-Pacific Country-Level Analysis | |
  23. TABLE 9 South America Country-Level Analysis | |
  24. TABLE 10 Middle East & Africa Country-Level Analysis | |
  25. TABLE 11 Marine Engine Monitoring System Market Segmentation by Type | |
  26. TABLE 12 Marine Engine Monitoring System Market Segmentation by Engine Propulsion Type | |
  27. TABLE 13 Marine Engine Monitoring System Market Segmentation by End Users | |
  28. TABLE 14 Competitive Benchmarking Matrix | |
  29. TABLE 15 Report Scope and Methodology | |
  30. TABLE 16 Detailed Sources and Citations | | LIST OF FIGURES | |
  31. FIGURE 1 Marine Engine Monitoring System Market Size Trend, 2021–2035 | |
  32. FIGURE 2 Marine Engine Monitoring System Market Year-over-Year Growth Outlook | |
  33. FIGURE 3 Regional Revenue Share Analysis | |
  34. FIGURE 4 Driver and Restraint Impact Matrix | |
  35. FIGURE 5 Competitive Landscape Snapshot | |
  36. FIGURE 6 Segment Share by Type | |
  37. FIGURE 7 Segment Share by Engine Propulsion Type | |
  38. FIGURE 8 Segment Share by End Users

Segmentation Quick Reference

DimensionSub-SegmentsDominant SegmentFastest Growing Segment
By TypeVessel, Container, Passenger, OthersVesselContainer
By Engine Propulsion TypeDiesel, Gas Turbine, OthersDieselGas Turbine
By End Userspassenger vessels, cruise ships, tankers, otherspassenger vesselscruise ships
By RegionNorth America, Europe, Asia-Pacific, Rest of the WorldNorth AmericaAsia-Pacific


Market Segmentation Overview

By Type

Sub-SegmentKey Trend
VesselCII compliance across bulk and general cargo fleets
ContainerDual-fuel newbuild deliveries on major trade lanes
PassengerFerry fleet renewal and hybrid propulsion retrofits
OthersOffshore support, tug and workboat uptime requirements


Across the Marine Engine Monitoring System Market, Vessel units lead by type because bulk carriers and general cargo ships form the largest share of the world fleet and face direct CII exposure. Container ships follow, carrying the highest monitoring content per hull on large dual-fuel newbuilds. Passenger units grow fastest as ferry operators replace aging propulsion plants, while the Others category, covering offshore support vessels, tugs and workboats, provides steady retrofit demand.

By Engine Propulsion Type

Sub-SegmentKey Trend
DieselInstalled base dominance and two-stroke prevalence
Gas TurbineNaval combatants and high-speed ferries
OthersDual-fuel LNG, methanol and hybrid-electric orders


Within the Marine Engine Monitoring System Market, Diesel propulsion dominates because two-stroke and four-stroke diesel engines power the overwhelming majority of the trading fleet, and retrofit kits target this installed base. Gas Turbine demand centers on naval combatants and fast ferries, where power density outweighs fuel cost. The Others group, spanning dual-fuel, methanol and hybrid-electric plants, grows fastest as 2024 alternative-fuel orders reach delivery.

By End Users

Sub-SegmentKey Trend
passenger vesselsFerry and ro-pax safety and fuel-efficiency upgrades
cruise shipsNewbuild deliveries and diesel-electric plant optimization
tankersVetting inspections, CII ratings and charterer data demands
othersBulk, offshore and government fleets


End-user demand in the Marine Engine Monitoring System Market is led by tankers, whose operators face strict oil-major vetting regimes that reward documented engine condition and verified fuel data. Demand from cruise ships rises fastest, supported by a full orderbook and multi-engine diesel-electric plants [8]. Operators of passenger vessels, mainly ferries and ro-pax units, invest to meet SOLAS safe-return-to-port rules, while the other group covers bulk, offshore and government fleets.


Download PDF ×

We do not share your information with anyone. However, we may send you emails based on your report interest from time to time. You may contact us at any time to opt-out.