Magnesium Hydroxide Market (2026 - 2035)

ID: MRFR/CnM/17714-HCR 128 Pages Chitranshi Jaiswal Last Updated: October 12, 2026
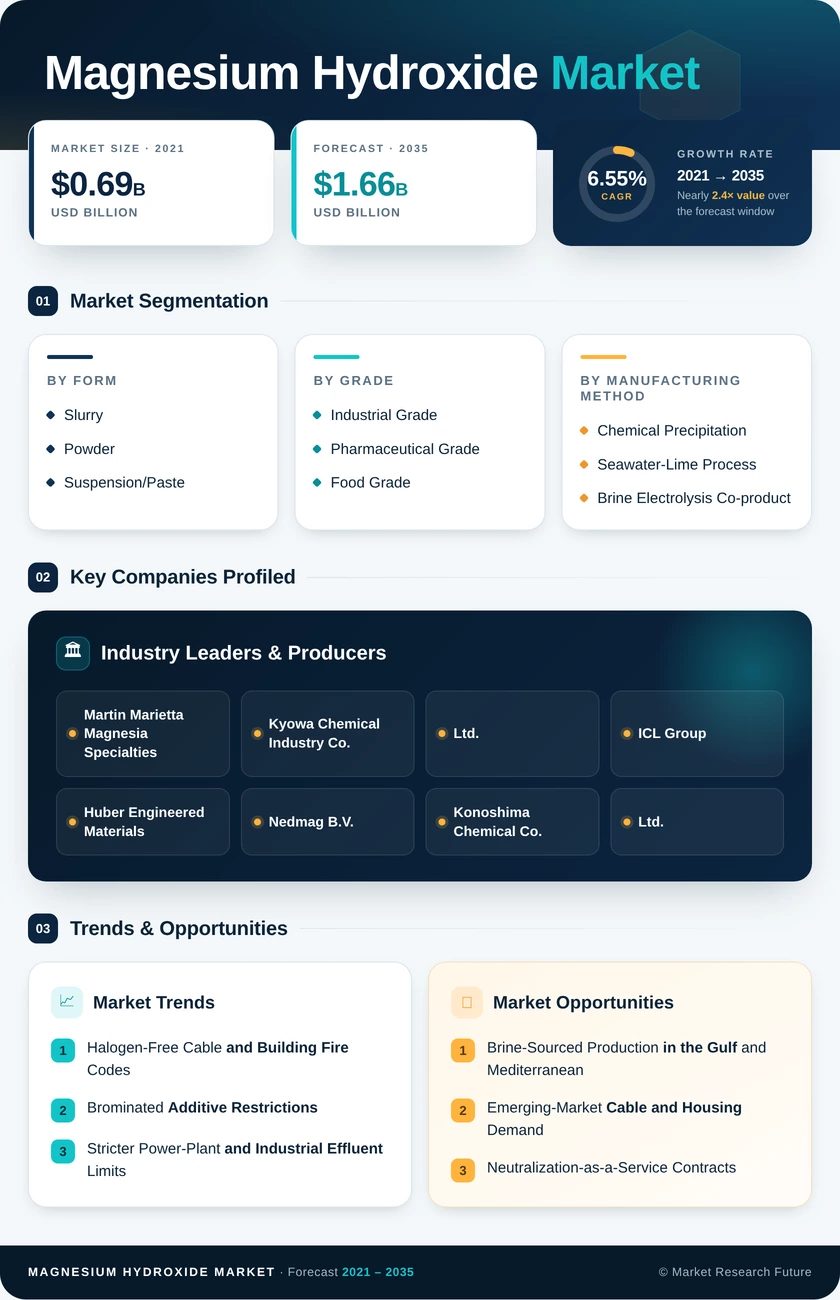
Magnesium Hydroxide Market Research Report Information By Form (Slurry, Powder, and Suspension/Paste), By Grade (Industrial Grade, Pharmaceutical Grade, and Food Grade), By Manufacturing Method (Chemical Precipitation, Seawater-Lime Process, and Brine Electrolysis Co-product), and By Application (Industrial, Pharmaceuticals, and Food and Beverage) – Forecast Till 2035.
Magnesium Hydroxide Market
Market Size
Forecast Period2026-2035
CAGR (2026-2035)6.55%
2025 Market SizeUSD 0.88 Billion
2035 Market SizeUSD 1.66 Billion
Key Players
Martin Marietta Magnesia Specialties
Kyowa Chemical Industry Co., Ltd.
ICL Group
Huber Engineered Materials
Nedmag B.V.
Konoshima Chemical Co., Ltd.
Opportunities
  • Brine-Sourced Production in the Gulf and Mediterranean
  • Emerging-Market Cable and Housing Demand
  • Neutralization-as-a-Service Contracts
  1. 1 Market Summary | |
  2. 2 Key Report Takeaways | |
    1. 2.1 By Form | |
    2. 2.2 By Grade | |
    3. 2.3 By Manufacturing Method | |
    4. 2.4 By Application | |
    5. 2.5 By Region | |
  3. 3 Market Size and Forecast (2021–2035) | |
  4. 4 Driver Impact Analysis | |
    1. 4.1 Halogen-Free Cable and Building Fire Codes | |
    2. 4.2 Brominated Additive Restrictions | |
    3. 4.3 Stricter Power-Plant and Industrial Effluent Limits | |
    4. 4.4 EV and Charging Infrastructure Build-Out | |
    5. 4.5 Grid and Data-Centre Cable Demand | |
    6. 4.6 Kidney-Care and Nutraceutical Formulations | |
    7. 4.7 Desalination Brine Valorization | |
  5. 5 Restraints Impact Analysis | |
    1. 5.1 Calcination Energy Cost Volatility | |
    2. 5.2 High Filler Loadings and ATH Substitution | |
    3. 5.3 Magnesite Supply Concentration in China | |
    4. 5.4 Pharmaceutical Purity Compliance Costs | |
    5. 5.5 Slurry Freight and Shelf-Life Limits | |
  6. 6 Opportunities | |
    1. 6.1 Brine-Sourced Production in the Gulf and Mediterranean | |
    2. 6.2 Emerging-Market Cable and Housing Demand | |
    3. 6.3 Neutralization-as-a-Service Contracts | |
    4. 6.4 Surface-Modified Grades for EV Battery Enclosures | |
    5. 6.5 Low-Carbon Grades and Product Carbon Footprints | |
  7. 7 Regional Market Share and Country-Level Analysis | |
    1. 7.1 Asia-Pacific | | |
      1. 7.1.1 China | | |
      2. 7.1.2 India | | |
      3. 7.1.3 Japan | | |
      4. 7.1.4 South Korea | | |
      5. 7.1.5 Rest of Asia-Pacific | |
    2. 7.2 North America | | |
      1. 7.2.1 United States | | |
      2. 7.2.2 Canada | |
    3. 7.3 Europe | | |
      1. 7.3.1 Germany | | |
      2. 7.3.2 France | | |
      3. 7.3.3 United Kingdom | | |
      4. 7.3.4 Rest of Europe | |
    4. 7.4 South America | | |
      1. 7.4.1 Brazil | | |
      2. 7.4.2 Argentina | | |
      3. 7.4.3 Rest of South America | |
    5. 7.5 Middle East & Africa | | |
      1. 7.5.1 Saudi Arabia | | |
      2. 7.5.2 South Africa | | |
      3. 7.5.3 Rest of Middle East & Africa | |
  8. 8 Future Outlook (2026–2035) | |
    1. 8.1 Electrification and the Cable Supercycle | |
    2. 8.2 Circular and Diversified Feedstocks | |
    3. 8.3 Digital Dosing and Process Control | |
    4. 8.4 ESG Disclosure and Carbon Pricing | |
  9. 9 Segmentation Analysis | |
    1. 9.1 By Form | | |
      1. 9.1.1 Slurry | | |
      2. 9.1.2 Powder | | |
      3. 9.1.3 Suspension/Paste | |
    2. 9.2 By Grade | | |
      1. 9.2.1 Industrial Grade | | |
      2. 9.2.2 Pharmaceutical Grade | | |
      3. 9.2.3 Food Grade | |
    3. 9.3 By Manufacturing Method | | |
      1. 9.3.1 Chemical Precipitation | | |
      2. 9.3.2 Seawater-Lime Process | | |
      3. 9.3.3 Brine Electrolysis Co-product | |
    4. 9.4 By Application | | |
      1. 9.4.1 Industrial | | |
      2. 9.4.2 Pharmaceuticals | | |
      3. 9.4.3 Food and Beverage | |
  10. 10 Competitive Landscape | |
    1. 10.1 Market Concentration Analysis | |
    2. 10.2 Competitive Benchmarking Matrix | |
  11. 11 Recent News & Developments | |
  12. 12 Report Scope and Methodology | |
  13. 13 Detailed Sources and Citations | |
  14. 14 Frequently Asked Questions (FAQs) | | LIST OF TABLES | |
  15. TABLE 1 Global Market Snapshot, 2025 and 2035 | |
  16. TABLE 2 Global Market Size & Forecast, by Revenue (USD Billion), 2021–2035 | |
  17. TABLE 3 Driver Impact Analysis, 2026–2035 | |
  18. TABLE 4 Restraints Impact Analysis, 2026–2035 | |
  19. TABLE 5 Regional Summary, by Region, 2025 | |
  20. TABLE 6 Asia-Pacific Country-Level Analysis, 2025 | |
  21. TABLE 7 North America Country-Level Analysis, 2025 | |
  22. TABLE 8 Europe Country-Level Analysis, 2025 | |
  23. TABLE 9 South America Country-Level Analysis, 2025 | |
  24. TABLE 10 Middle East & Africa Country-Level Analysis, 2025 | |
  25. TABLE 11 Segmentation by Form, 2025 | |
  26. TABLE 12 Segmentation by Grade, 2025 | |
  27. TABLE 13 Segmentation by Manufacturing Method, 2025 | |
  28. TABLE 14 Segmentation by Application, 2025 | |
  29. TABLE 15 Competitive Benchmarking Matrix, 2025 | |
  30. TABLE 16 Report Scope and Methodology | |
  31. TABLE 17 Detailed Sources and Citations | | LIST OF FIGURES | |
  32. FIGURE 1 Market Dynamics Overview (Drivers, Restraints, Opportunities) | |
  33. FIGURE 2 Industry Value Chain Analysis | |
  34. FIGURE 3 Porter's Five Forces Analysis | |
  35. FIGURE 4 Global Market Size Trend, 2021–2035 (USD Billion) | |
  36. FIGURE 5 Year-over-Year Growth Rate, 2022–2035 | |
  37. FIGURE 6 Market Share by Form, 2025 | |
  38. FIGURE 7 Market Share by Grade, 2025 | |
  39. FIGURE 8 Market Share by Manufacturing Method, 2025 | |
  40. FIGURE 9 Market Share by Application, 2025 | |
  41. FIGURE 10 Regional Market Share, 2025 | |
  42. FIGURE 11 Asia-Pacific Country Share, 2025 | |
  43. FIGURE 12 Competitive Landscape Positioning Map, 2025

Segmentation Quick Reference

DimensionSub-SegmentsDominant SegmentFastest Growing Segment
By FormSlurry; Powder; Suspension/PasteSlurry (57.4% share)Suspension/Paste (7.6% CAGR)
By GradeIndustrial Grade; Pharmaceutical Grade; Food GradeIndustrial Grade (61.0% share)Pharmaceutical Grade (8.9% CAGR)
By Manufacturing MethodChemical Precipitation; Seawater-Lime Process; Brine Electrolysis Co-productChemical Precipitation (54.1% share)Brine Electrolysis Co-product (9.6% CAGR)
By ApplicationIndustrial; Pharmaceuticals; Food and BeverageIndustrial (59.4% share)Pharmaceuticals (9.8% CAGR)
By RegionAsia-Pacific; North America; Europe; South America; Middle East & AfricaAsia-Pacific (46.5% share)Asia-Pacific (46.5% share)


Market Segmentation Overview

By Form

Sub-SegmentKey Trend
SlurryHigh-solids dispersants above 60 wt% cut freight per active unit
PowderSteady pharmaceutical and compounding demand requiring dry handling
Suspension/PasteThixotropic formulations for corrosion linings and coatings


Slurry leads this dimension with a 57.4% share because neutralization users want pumpable, dust-free reagent that feeds automated dosing skids. Suspension/Paste grows fastest at a 7.6% CAGR as sewer-pipe corrosion linings and specialty coatings need stable, high-solids rheology. Powder holds its place where water is unacceptable, chiefly pharmaceutical tableting and polymer compounding.

By Grade

Sub-SegmentKey Trend
Industrial GradeBulk 96–97% assay material for cables and scrubbers
Pharmaceutical GradeSub-ppm impurity specifications under ICH Q3D
Food GradeLimited qualified supplier base for refining and confectionery


Industrial Grade dominates at a 61.0% share since cable compounders and scrubber operators prioritize cost over ultra-high purity. Pharmaceutical Grade expands fastest at an 8.9% CAGR, supported by kidney-care binders and the premium pricing that GMP-validated production commands. Food Grade remains a smaller, regulation-gated niche serving sugar refining and chewing-gum bases.

By Manufacturing Method

Sub-SegmentKey Trend
Chemical PrecipitationLow-cost debottlenecking of depreciated plants
Seawater-Lime ProcessHigh-purity coastal output where limestone is cheap
Brine Electrolysis Co-productDesalination brine converted from waste to feedstock


Chemical Precipitation retains a 54.1% share because established plants can raise output through agitator and filtration upgrades rather than new construction. Brine Electrolysis Co-product grows fastest at a 9.6% CAGR, turning desalination reject streams into Mg(OH)₂ while recycling chlorine and caustic. The Seawater-Lime Process continues to supply high-purity grades from Japanese and European coastal sites.

By Application

Sub-SegmentKey Trend
IndustrialHalogen-free cable compounds and stricter effluent limits
PharmaceuticalsRising kidney-disease prevalence lifts phosphate binder demand
Food and BeverageStable use as processing aid and mineral fortificant


Industrial applications lead with a 59.4% share, combining fire-retardant polymer compounds, power-plant desulfurization, and municipal effluent control. Pharmaceuticals grow fastest at a 9.8% CAGR as more than 850 million people living with kidney disease sustain demand for oral phosphate binders. Food and Beverage uses provide steady, lower-volume offtake through processing aids and fortification.


Download PDF ×

We do not share your information with anyone. However, we may send you emails based on your report interest from time to time. You may contact us at any time to opt-out.