Lwan Market (2026 - 2035)

ID: MRFR/ICT/41170-HCR 200 Pages Nirmit Biswas Last Updated: October 10, 2026
LoRaWAN Market Size, Share and Research Report By Network Technology (LoRa, LoRa-WAN, Sigfox, NB-IoT, LTE-M, 5G RedCap, RPMA (Ingenu), and Others), By Component (Hardware (Modules, Gateways, Antennas), Platform, and Services), By Deployment Model (Public Network, and Private/Enterprise Network), By End-User Industry (Utilities, Smart City Infrastructure, Smart Homes and Consumer IoT, Industrial and Manufacturing, Transportation and Logistics, Agriculture, Healthcare, and Others) – Industry Forecast Till 2035
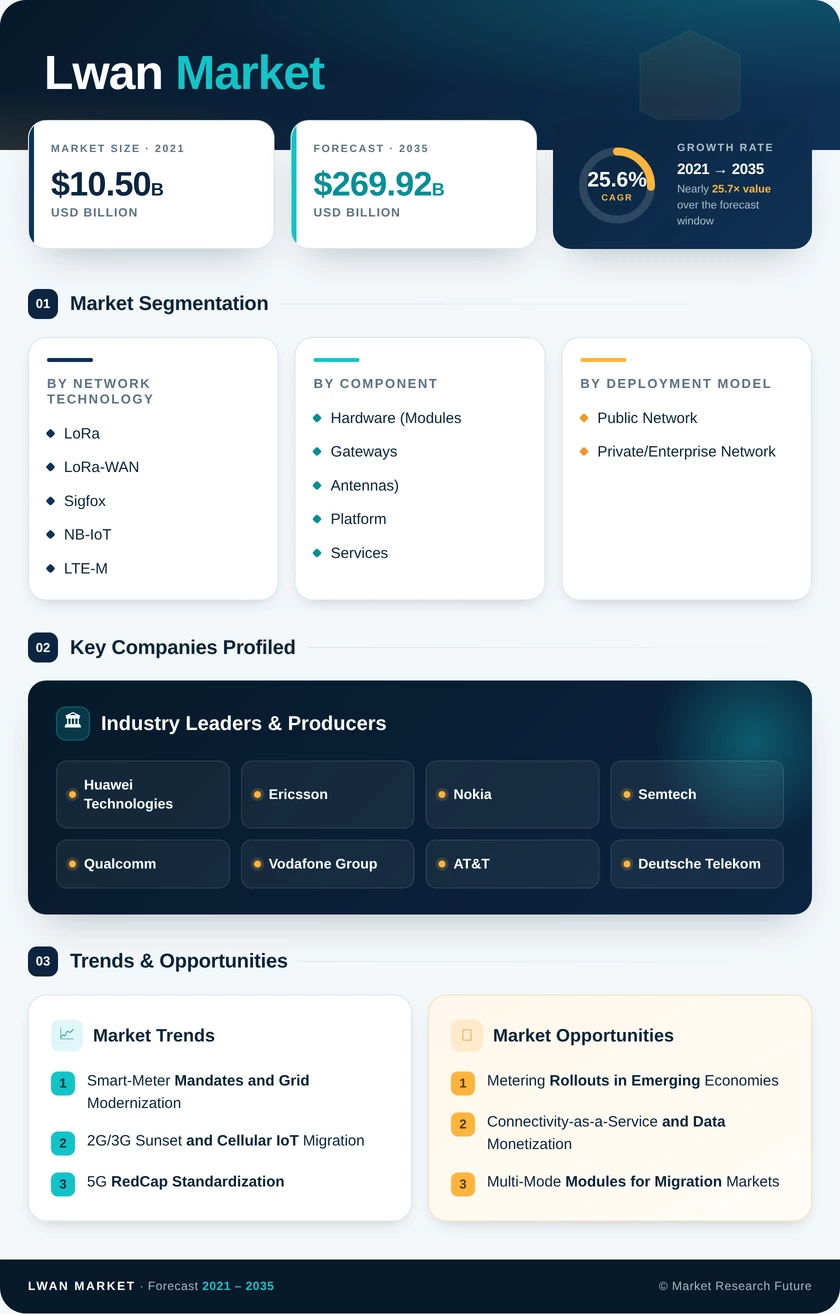
Lwan Market
Market Size
Forecast Period2026-2035
CAGR (2026-2035)25.6%
2025 Market SizeUSD 27.80 Billion
2035 Market SizeUSD 269.92 Billion
Key Players
Huawei Technologies
Ericsson
Nokia
Semtech
Qualcomm
Vodafone Group
Opportunities
  • Metering Rollouts in Emerging Economies
  • Connectivity-as-a-Service and Data Monetization
  • Multi-Mode Modules for Migration Markets
  1. 1 Market Summary | |
  2. 2 Key Report Takeaways | |
    1. 2.1 By Network Technology | |
    2. 2.2 By Component | |
    3. 2.3 By Deployment Model | |
    4. 2.4 By End-User Industry | |
    5. 2.5 By Region | |
  3. 3 Market Size and Forecast (2021–2035) | |
    1. 3.1 Historical Market Size (2021–2025) | |
    2. 3.2 Forecast Market Size (2026–2035) | |
    3. 3.3 Year-over-Year Growth Analysis | |
  4. 4 Driver Impact Analysis | |
    1. 4.1 Smart-Meter Mandates and Grid Modernization | |
    2. 4.2 2G/3G Sunset and Cellular IoT Migration | |
    3. 4.3 5G RedCap Standardization | |
    4. 4.4 Enterprise Demand for Private Networks | |
    5. 4.5 Remote Patient Monitoring Adoption | |
    6. 4.6 Smart-City and Logistics Asset Tracking | |
  5. 5 Restraints Impact Analysis | |
    1. 5.1 Protocol Fragmentation and Interoperability Gaps | |
    2. 5.2 Cybersecurity Compliance Burden | |
    3. 5.3 Unlicensed Spectrum Duty-Cycle and Capacity Limits | |
    4. 5.4 Network Sunset and Vendor Continuity Risk | |
    5. 5.5 Module Cost Pressure in Price-Sensitive Markets | |
  6. 6 Opportunities | |
    1. 6.1 Metering Rollouts in Emerging Economies | |
    2. 6.2 Connectivity-as-a-Service and Data Monetization | |
    3. 6.3 Multi-Mode Modules for Migration Markets | |
    4. 6.4 Satellite-Terrestrial Hybrid Coverage | |
    5. 6.5 Private Networks for Healthcare and Manufacturing | |
  7. 7 Regional Market Share and Country-Level Analysis | |
    1. 7.1 North America | | |
      1. 7.1.1 United States | | |
      2. 7.1.2 Canada | | |
      3. 7.1.3 Mexico | |
    2. 7.2 Europe | | |
      1. 7.2.1 Germany | | |
      2. 7.2.2 United Kingdom | | |
      3. 7.2.3 France | | |
      4. 7.2.4 Rest of Europe | |
    3. 7.3 Asia-Pacific | | |
      1. 7.3.1 China | | |
      2. 7.3.2 India | | |
      3. 7.3.3 Japan | | |
      4. 7.3.4 South Korea | | |
      5. 7.3.5 Rest of Asia-Pacific | |
    4. 7.4 South America | | |
      1. 7.4.1 Brazil | | |
      2. 7.4.2 Argentina | | |
      3. 7.4.3 Rest of South America | |
    5. 7.5 Middle East & Africa | | |
      1. 7.5.1 Saudi Arabia | | |
      2. 7.5.2 United Arab Emirates | | |
      3. 7.5.3 South Africa | | |
      4. 7.5.4 Rest of Middle East & Africa | |
  8. 8 Future Outlook (2026–2035) | |
    1. 8.1 Edge AI and Autonomous Network Operations | |
    2. 8.2 Platform Economics Replace Hardware Margins | |
    3. 8.3 Grid Investment Supercycle | |
    4. 8.4 Sustainability Reporting and Energy-Efficient Devices | |
  9. 9 Segmentation Analysis | |
    1. 9.1 By Network Technology | | |
      1. 9.1.1 LoRa | | |
      2. 9.1.2 LoRa-WAN | | |
      3. 9.1.3 Sigfox | | |
      4. 9.1.4 NB-IoT | | |
      5. 9.1.5 LTE-M | | |
      6. 9.1.6 5G RedCap | | |
      7. 9.1.7 RPMA (Ingenu) | | |
      8. 9.1.8 Others | |
    2. 9.2 By Component | | |
      1. 9.2.1 Hardware (Modules, Gateways, Antennas) | | |
      2. 9.2.2 Platform | | |
      3. 9.2.3 Services | |
    3. 9.3 By Deployment Model | | |
      1. 9.3.1 Public Network | | |
      2. 9.3.2 Private/Enterprise Network | |
    4. 9.4 By End-User Industry | | |
      1. 9.4.1 Utilities | | |
      2. 9.4.2 Smart City Infrastructure | | |
      3. 9.4.3 Smart Homes and Consumer IoT | | |
      4. 9.4.4 Industrial and Manufacturing | | |
      5. 9.4.5 Transportation and Logistics | | |
      6. 9.4.6 Agriculture | | |
      7. 9.4.7 Healthcare | | |
      8. 9.4.8 Others | |
  10. 10 Competitive Landscape | |
    1. 10.1 Market Concentration Analysis | |
    2. 10.2 Competitive Benchmarking Matrix | |
    3. 10.3 Company Profiles | | |
      1. 10.3.1 Huawei Technologies | | |
      2. 10.3.2 Ericsson | | |
      3. 10.3.3 Nokia | | |
      4. 10.3.4 Semtech | | |
      5. 10.3.5 Qualcomm | | |
      6. 10.3.6 Vodafone Group | | |
      7. 10.3.7 AT&T | | |
      8. 10.3.8 Deutsche Telekom | | |
      9. 10.3.9 Actility | | |
      10. 10.3.10 UnaBiz (Sigfox) | | |
      11. 10.3.11 Ingenu | |
  11. 11 Recent News & Developments | |
  12. 12 Report Scope and Methodology | |
  13. 13 Detailed Sources and Citations | |
  14. 14 Frequently Asked Questions (FAQs) | | LIST OF TABLES | |
  15. TABLE 1 Global Market Size & Forecast, by Revenue (USD Billion), 2021–2035 | |
  16. TABLE 2 Year-over-Year Growth Analysis, 2021–2035 | |
  17. TABLE 3 Driver Impact Analysis | |
  18. TABLE 4 Restraints Impact Analysis | |
  19. TABLE 5 Market Size, by Region, 2021–2035 (USD Billion) | |
  20. TABLE 6 North America Market Size, by Country, 2021–2035 (USD Billion) | |
  21. TABLE 7 Europe Market Size, by Country, 2021–2035 (USD Billion) | |
  22. TABLE 8 Asia-Pacific Market Size, by Country, 2021–2035 (USD Billion) | |
  23. TABLE 9 South America Market Size, by Country, 2021–2035 (USD Billion) | |
  24. TABLE 10 Middle East & Africa Market Size, by Country, 2021–2035 (USD Billion) | |
  25. TABLE 11 Market Size, by Network Technology, 2021–2035 (USD Billion) | |
  26. TABLE 12 Market Size, by Component, 2021–2035 (USD Billion) | |
  27. TABLE 13 Market Size, by Deployment Model, 2021–2035 (USD Billion) | |
  28. TABLE 14 Market Size, by End-User Industry, 2021–2035 (USD Billion) | |
  29. TABLE 15 Competitive Benchmarking Matrix, 2025 | |
  30. TABLE 16 Report Scope and Methodology | |
  31. TABLE 17 Detailed Sources and Citations | | LIST OF FIGURES | |
  32. FIGURE 1 Market Dynamics Overview (Drivers, Restraints, Opportunities) | |
  33. FIGURE 2 Industry Value Chain Analysis | |
  34. FIGURE 3 Porter's Five Forces Analysis | |
  35. FIGURE 4 Global Market Size Trend, 2021–2035 (USD Billion) | |
  36. FIGURE 5 Market Share, by Network Technology, 2025 (%) | |
  37. FIGURE 6 Market Share, by Component, 2025 (%) | |
  38. FIGURE 7 Market Share, by Deployment Model, 2025 (%) | |
  39. FIGURE 8 Market Share, by End-User Industry, 2025 (%) | |
  40. FIGURE 9 Regional Market Share, 2025 (%) | |
  41. FIGURE 10 Country-Level Market Share within Each Region, 2025 (%) | |
  42. FIGURE 11 Competitive Landscape: Estimated Revenue Share Ranges of Key Players, 2025

Segmentation Quick Reference

DimensionSub-SegmentsDominant SegmentFastest Growing Segment
By Network TechnologyLoRa, LoRa-WAN, Sigfox, NB-IoT, LTE-M, 5G RedCap, OthersLoRa (34.6%)5G RedCap (26.9% CAGR)
By ComponentHardware (Modules, Gateways, Antennas), Platform, ServicesHardware (Modules, Gateways, Antennas) (44.2%)Platform (27.6% CAGR)
By Deployment ModelPublic Network, Private/Enterprise NetworkPublic Network (56.4%)Private/Enterprise Network (28.1% CAGR)
By End-User IndustryUtilities, Smart City Infrastructure, Smart Homes and Consumer IoT, Industrial and Manufacturing, Transportation and Logistics, Agriculture, Healthcare, OthersUtilities (24.2%)Healthcare (26.7% CAGR)
By RegionNorth America, Europe, Asia-Pacific, South America, Middle East & AfricaAsia-Pacific (41.2%)Asia-Pacific (41.2%)


Market Segmentation Overview

By Network Technology

Sub-SegmentKey Trend
LoRaUtility- and city-owned gateways in unlicensed bands
LoRa-WANOperator and community public networks
SigfoxRecalibration toward niche ultra-low-data tracking
NB-IoTPolicy-backed metering in China
LTE-MMobile asset tracking after NB-IoT retirements in North America
5G RedCapCertified modules for mid-bandwidth devices
OthersRPMA for high-reliability mining and industrial sites


LoRa leads this dimension because owners can build private coverage without paying spectrum or subscription fees, which suits utilities and municipalities. 5G RedCap grows fastest as Release 17 and Release 18 devices reach certification and offer far lower power draw than LTE. NB-IoT and LTE-M split the licensed cellular space by geography, with NB-IoT strongest in China and LTE-M favoured for moving assets in North America.

By Component

Sub-SegmentKey Trend
Hardware (Modules, Gateways, Antennas)Volume growth with falling unit prices
PlatformUnified device lifecycle management and analytics
ServicesCustom gateways, protocol translation, managed offers


Hardware (Modules, Gateways, Antennas) leads because every new meter, tracker and sensor needs a radio module and network gateways, keeping unit volumes high even as prices fall. Platform is the fastest-growing component as buyers consolidate provisioning, firmware updates and anomaly detection across mixed LoRa and cellular fleets. Services stay important where legacy equipment requires protocol conversion before it can join an LWAN.

By Deployment Model

Sub-SegmentKey Trend
Public NetworkBroad operator coverage for dispersed devices
Private/Enterprise NetworkOn-site control, custom QoS and data sovereignty


Public Network remains dominant because carriers already cover most populated areas, letting customers connect devices with no infrastructure spend. Private/Enterprise Network grows faster as factories and hospitals use shared spectrum such as CBRS to keep sensitive telemetry on site with guaranteed latency. Many enterprises now combine both, routing routine data publicly and critical workloads privately.

By End-User Industry

Sub-SegmentKey Trend
UtilitiesMandated smart-meter rollouts
Smart City InfrastructureLighting, parking and waste sensors
Smart Homes and Consumer IoTTrackers and security devices
Industrial and ManufacturingPredictive-maintenance sensors
Transportation and LogisticsContainer and fleet tracking on LTE-M
AgricultureSatellite-terrestrial soil and livestock monitoring
HealthcareReimbursed remote patient monitoring
OthersRetail, building and environmental sensing


Utilities lead because regulators in India, Europe and the United States require smart metering, creating predictable multi-million-unit tenders. Healthcare grows fastest as CMS reimbursement turns remote patient monitoring into routine care that depends on simple, low-power cellular uplinks. Industrial and Manufacturing follows closely, using vibration and temperature sensors to cut unplanned downtime.


 

Download PDF ×

We do not share your information with anyone. However, we may send you emails based on your report interest from time to time. You may contact us at any time to opt-out.