Low GWP Refrigerants Market (2026 - 2035)

ID: MRFR/CnM/6002-HCR 140 Pages Chitranshi Jaiswal Last Updated: September 04, 2026
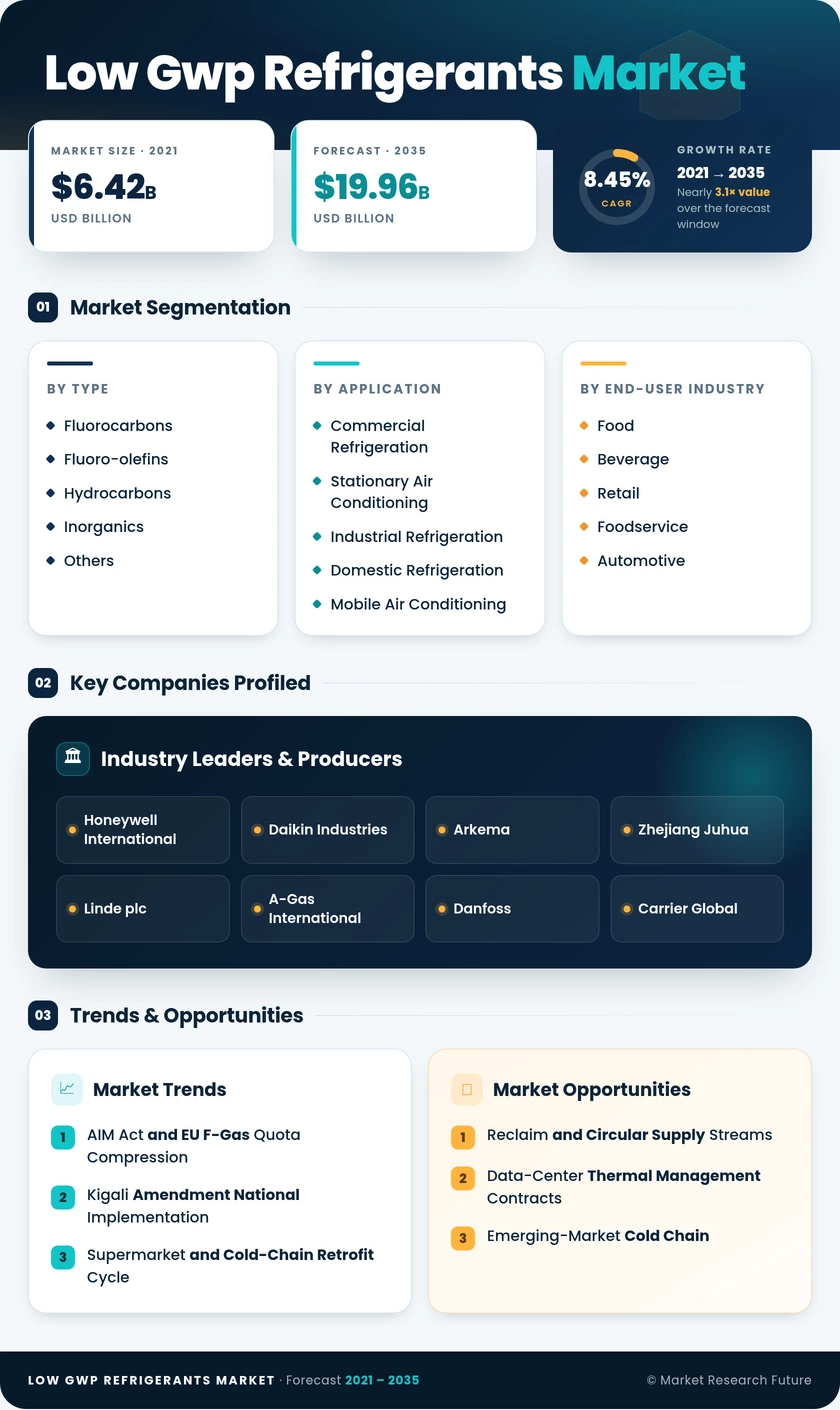
Low GWP Refrigerants Market Research Report Information By Type (Fluorocarbons and Fluoro-olefins, Hydrocarbons, Inorganics (NH₃, CO₂, H₂O), and Others), By Application (Commercial Refrigeration, Stationary Air Conditioning, Industrial Refrigeration, Domestic Refrigeration, Mobile Air Conditioning, and Others (heat pumps, transport)), and By End-User Industry (Food and Beverage, Retail and Foodservice, Automotive and Transportation, Chemical and Petrochemical, and Healthcare and Pharmaceutical) – Forecast Till 2035.
Low GWP Refrigerants Market
Market Size
Forecast Period2026-2035
CAGR (2026-2035)8.45%
2025 Market SizeUSD 8.87 Billion
2035 Market SizeUSD 19.96 Billion
Key Players
Honeywell International
Daikin Industries
Arkema
Zhejiang Juhua
Linde plc
A-Gas International
Opportunities
  • Reclaim and Circular Supply Streams
  • Data-Center Thermal Management Contracts
  • Emerging-Market Cold Chain
  1. 1 Market Summary | |
    1. 1.1 Study Assumptions & Market Definition | |
    2. 1.2 Scope of the Study | |
    3. 1.3 Research Methodology | |
  2. 2 Key Report Takeaways | |
    1. 2.1 By Type | |
    2. 2.2 By Sector | |
    3. 2.3 By Geography | |
  3. 3 Market Size & Forecast (2021–2035) | |
    1. 3.1 Historical Market Size (2021–2024) | |
    2. 3.2 Base Year Estimate (2025) | |
    3. 3.3 Forecast Market Size (2026–2035) | |
    4. 3.4 Year-over-Year Growth Analysis | |
  4. 4 Driver Impact Analysis | |
    1. 4.1 AIM Act and EU F-Gas Quota Compression | |
    2. 4.2 Kigali Amendment National Implementation | |
    3. 4.3 Supermarket and Cold-Chain Retrofit Cycle | |
    4. 4.4 Data-Center Thermal Load Growth | |
    5. 4.5 A2L Safety Code and Standards Approval | |
    6. 4.6 Heat Pump Deployment Incentives | |
    7. 4.7 Carbon Pricing and Scope 1 Disclosure | |
  5. 5 Restraints Impact Analysis | |
    1. 5.1 Feedstock and Fluorspar Supply Concentration | |
    2. 5.2 Flammability Codes and Charge Limits | |
    3. 5.3 Capital Burden of Transcritical Architecture | |
    4. 5.4 PFAS and TFA Regulatory Scrutiny | |
    5. 5.5 Technician Shortage and Certification Gaps | |
  6. 6 Opportunities | |
    1. 6.1 Reclaim and Circular Supply Streams | |
    2. 6.2 Data-Center Thermal Management Contracts | |
    3. 6.3 Emerging-Market Cold Chain | |
    4. 6.4 Leak Analytics and Service Monetization | |
    5. 6.5 Proprietary Blend and Compressor Pairing | |
    6. 6.6 Industry Value Chain Analysis | |
    7. 6.7 Porter's Five Forces Analysis | |
  7. 7 Regional Market Share & Country-Level Analysis | |
    1. 7.1 North America | | |
      1. 7.1.1 US | | |
      2. 7.1.2 Canada | | |
      3. 7.1.3 Mexico | |
    2. 7.2 Europe | | |
      1. 7.2.1 Germany | | |
      2. 7.2.2 UK | | |
      3. 7.2.3 France | | |
      4. 7.2.4 Italy | | |
      5. 7.2.5 Spain | | |
      6. 7.2.6 Nordic Countries | | |
      7. 7.2.7 Russia | | |
      8. 7.2.8 Rest of Europe | |
    3. 7.3 Asia-Pacific | | |
      1. 7.3.1 China | | |
      2. 7.3.2 India | | |
      3. 7.3.3 Japan | | |
      4. 7.3.4 South Korea | | |
      5. 7.3.5 ASEAN | | |
      6. 7.3.6 Rest of Asia-Pacific | |
    4. 7.4 South America | | |
      1. 7.4.1 Brazil | | |
      2. 7.4.2 Argentina | | |
      3. 7.4.3 Rest of South America | |
    5. 7.5 Middle East & Africa | | |
      1. 7.5.1 Saudi Arabia | | |
      2. 7.5.2 UAE | | |
      3. 7.5.3 South Africa | | |
      4. 7.5.4 Egypt | | |
      5. 7.5.5 Rest of Middle East & Africa | |
  8. 8 Future Outlook (2026–2035) | |
    1. 8.1 Predictive Leak Management and Autonomous Controls | |
    2. 8.2 Servitization of Fluid Supply | |
    3. 8.3 Electrification and the Heat Pump Supercycle | |
    4. 8.4 Lifecycle Climate Performance as a Procurement Standard | |
  9. 9 Segmentation Analysis | |
    1. 9.1 By Type | | |
      1. 9.1.1 Fluorocarbons and Fluoro-olefins | | |
      2. 9.1.2 Hydrocarbons | | |
      3. 9.1.3 Inorganics | | |
      4. 9.1.4 Others | |
    2. 9.2 By Application | | |
      1. 9.2.1 Commercial Refrigeration | | |
      2. 9.2.2 Stationary Air Conditioning | | |
      3. 9.2.3 Industrial Refrigeration | | |
      4. 9.2.4 Domestic Refrigeration | | |
      5. 9.2.5 Mobile Air Conditioning | | |
      6. 9.2.6 Others | |
    3. 9.3 By End-User Industry | | |
      1. 9.3.1 Food and Beverage | | |
      2. 9.3.2 Retail and Foodservice | | |
      3. 9.3.3 Automotive and Transportation | | |
      4. 9.3.4 Chemical and Petrochemical | | |
      5. 9.3.5 Healthcare and Pharmaceutical | | |
      6. 9.3.6 Others | |
  10. 10 Competitive Landscape | |
    1. 10.1 Market Concentration Analysis (2026) | |
    2. 10.2 Competitive Benchmarking Matrix | |
    3. 10.3 Company Profiles | | |
      1. 10.3.1 The Chemours Company | | |
      2. 10.3.2 Honeywell International | | |
      3. 10.3.3 Daikin Industries | | |
      4. 10.3.4 Arkema | | |
      5. 10.3.5 Zhejiang Juhua | | |
      6. 10.3.6 Linde plc | | |
      7. 10.3.7 A-Gas International | | |
      8. 10.3.8 Danfoss | | |
      9. 10.3.9 Carrier Global | | |
      10. 10.3.10 Johnson Controls | | |
      11. 10.3.11 Lennox International | | |
      12. 10.3.12 Epta Group | |
  11. 11 Recent News & Developments | |
  12. 12 Report Scope & Methodology | |
    1. 12.1 Study Period & Base Year | |
    2. 12.2 Data Sources & Estimation Framework | |
    3. 12.3 Abbreviations | |
  13. 13 Detailed Sources & Citations | |
  14. 14 Frequently Asked Questions (FAQs) | | LIST OF TABLES | |
  15. TABLE 1 Global Low GWP Refrigerants Market Size & Forecast (USD Billion), 2021–2035 | |
  16. TABLE 2 Global Market — Year-over-Year Growth Analysis, 2021–2035 | |
  17. TABLE 3 Driver Impact Analysis Matrix, 2026–2035 | |
  18. TABLE 4 Restraint Impact Analysis Matrix, 2026–2035 | |
  19. TABLE 5 Global Market Size, by Type, 2021–2035 (USD Billion) | |
  20. TABLE 6 Global Market Size, by Application, 2021–2035 (USD Billion) | |
  21. TABLE 7 Global Market Size, by End-User Industry, 2021–2035 (USD Billion) | |
  22. TABLE 8 Global Market Size, by Region, 2021–2035 (USD Billion) | |
  23. TABLE 9 North America Market Size, by Country, 2021–2035 (USD Billion) | |
  24. TABLE 10 Europe Market Size, by Country, 2021–2035 (USD Billion) | |
  25. TABLE 11 Asia-Pacific Market Size, by Country, 2021–2035 (USD Billion) | |
  26. TABLE 12 South America Market Size, by Country, 2021–2035 (USD Billion) | |
  27. TABLE 13 Middle East & Africa Market Size, by Country, 2021–2035 (USD Billion) | |
  28. TABLE 14 North America Market Size, by Type, 2021–2035 (USD Billion) | |
  29. TABLE 15 North America Market Size, by Application, 2021–2035 (USD Billion) | |
  30. TABLE 16 Europe Market Size, by Type, 2021–2035 (USD Billion) | |
  31. TABLE 17 Europe Market Size, by Application, 2021–2035 (USD Billion) | |
  32. TABLE 18 Asia-Pacific Market Size, by Type, 2021–2035 (USD Billion) | |
  33. TABLE 19 Asia-Pacific Market Size, by End-User Industry, 2021–2035 (USD Billion) | |
  34. TABLE 20 Competitive Benchmarking Matrix, 2026 | |
  35. TABLE 21 Company Profiles — Key Players | |
  36. TABLE 22 Recent Developments & Strategic Announcements, 2023–2025 | |
  37. TABLE 23 Report Scope & Methodology Summary | |
  38. TABLE 24 Detailed Sources & Citations Index | | LIST OF FIGURES | |
  39. FIGURE 1 Market Dynamics — Drivers, Restraints and Opportunities Framework | |
  40. FIGURE 2 Industry Value Chain Analysis | |
  41. FIGURE 3 Porter's Five Forces Analysis | |
  42. FIGURE 4 Global Market Size Trend, 2021–2035 (USD Billion) | |
  43. FIGURE 5 Year-over-Year Growth Trajectory, 2022–2035 | |
  44. FIGURE 6 Market Share by Type, 2025 vs 2035 | |
  45. FIGURE 7 Market Share by Application, 2025 | |
  46. FIGURE 8 Market Share by End-User Industry, 2025 | |
  47. FIGURE 9 Regional Share Distribution, 2025 | |
  48. FIGURE 10 Regional CAGR Comparison, 2026–2035 | |
  49. FIGURE 11 North America Country-Level Share, 2025 | |
  50. FIGURE 12 Europe Country-Level Share, 2025 | |
  51. FIGURE 13 Asia-Pacific Country-Level Share, 2025 | |
  52. FIGURE 14 Competitive Landscape — Estimated Revenue Share Bands, 2026 | |
  53. FIGURE 15 Strategic Positioning Matrix — Key Players

Segmentation Quick Reference

DimensionSub-SegmentsDominant SegmentFastest Growing Segment
By TypeFluorocarbons and Fluoro-olefins; Hydrocarbons; Inorganics; OthersFluorocarbons and Fluoro-olefinsInorganics
By ApplicationCommercial Refrigeration; Stationary Air Conditioning; Industrial Refrigeration; Domestic Refrigeration; Mobile Air Conditioning; OthersCommercial RefrigerationStationary Air Conditioning
By End-User IndustryFood and Beverage; Retail and Foodservice; Automotive and Transportation; Chemical and Petrochemical; Healthcare and Pharmaceutical; OthersFood and BeverageRetail and Foodservice
By GeographyNorth America; Europe; Asia-Pacific; South America; Middle East & AfricaNorth AmericaNorth America


Market Segmentation Overview

By Type

Sub-SegmentKey Trend
Fluorocarbons and Fluoro-olefinsBlend proprietisation and compressor-specific validation displacing generic drop-ins
HydrocarbonsCharge-limit relaxation to 500 g widening addressable equipment classes
InorganicsTranscritical CO₂ ejector designs closing the warm-climate efficiency gap
OthersSpecialty low-pressure fluids gaining ground in centrifugal chiller retrofits


Type selection is now a function of jurisdiction as much as duty. Where quota enforcement is strict and PFAS scrutiny is active, buyers skip intermediate chemistry and specify inorganics outright; elsewhere, fluorinated blends remain the lowest-friction path because they preserve existing equipment architecture and technician skill sets.

By Application

Sub-SegmentKey Trend
Commercial Refrigeration150 GWP caps forcing rack-level redesign in new retail food builds
Stationary Air ConditioningA2L platform conversion completed across most North American unitary lines
Industrial RefrigerationAmmonia secondary-loop designs reducing charge inventory per plant
Domestic RefrigerationIsobutane now the global default in appliance manufacturing
Mobile Air ConditioningR-1234yf entrenched in light vehicles; heat pump duty rising in EVs
OthersReefer containers and district cooling emerging as distinct demand pools


Application dynamics diverge sharply by charge size. Large-charge segments respond to regulation within one build cycle, while small-charge, high-volume categories such as domestic refrigeration completed their transition years ago and now contribute steady replacement demand rather than growth.

By End-User Industry

Sub-SegmentKey Trend
Food and BeverageExport buyer specifications embedding system GWP alongside food-safety criteria
Retail and FoodserviceStore-format standardisation accelerating multi-site retrofit programmes
Automotive and TransportationEV thermal management raising per-vehicle charge and service complexity
Chemical and PetrochemicalProcess cooling upgrades bundled with broader decarbonisation capex
Healthcare and PharmaceuticalUltra-low-temperature storage demand persisting post-pandemic
OthersData centers and district cooling scaling into contract-grade volume


End-user behaviour tracks disclosure exposure closely. Industries publishing audited Scope 1 figures move first and pay premiums for verified low-leakage systems, while sectors without comparable reporting obligations continue to optimise on installed cost and defer conversion until servicing supply constraints force the decision.




Download PDF ×

We do not share your information with anyone. However, we may send you emails based on your report interest from time to time. You may contact us at any time to opt-out.