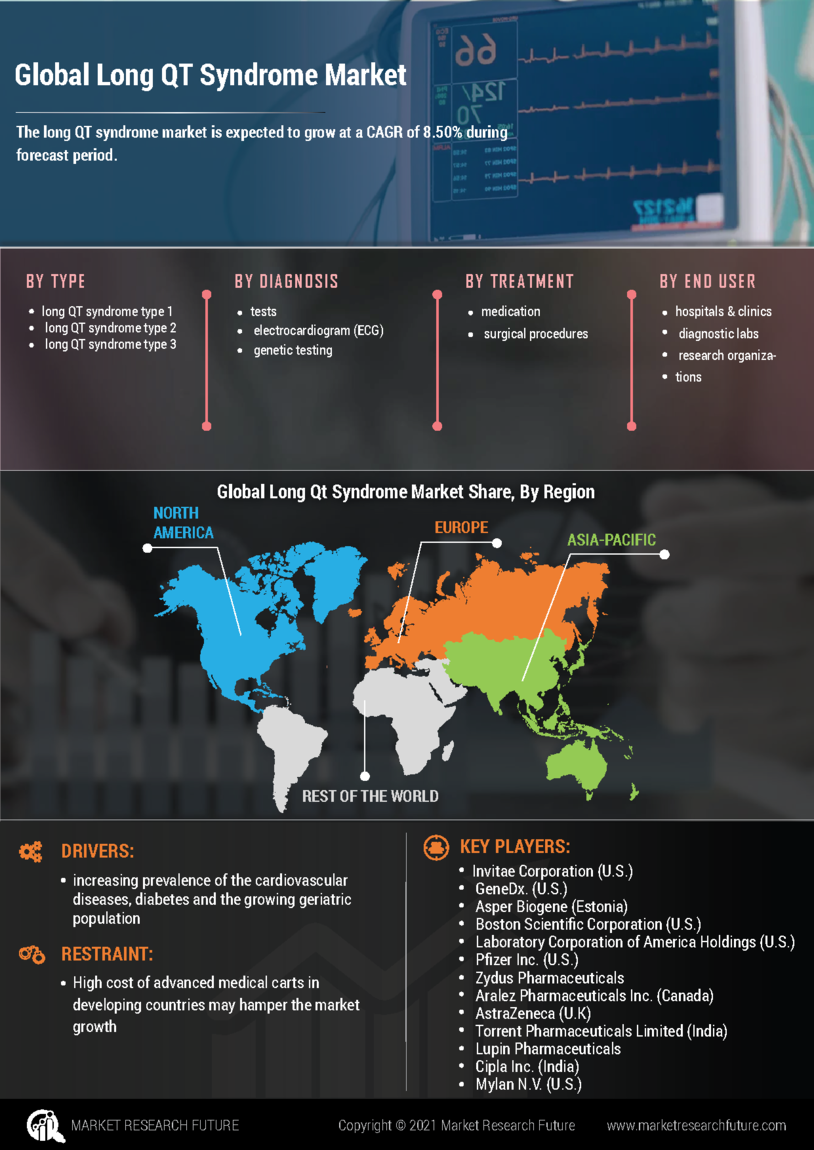
Long QT Syndrome Market Research Report - Global Forecast till 2030

Long QT Syndrome Market Research Report, Type (LQT1, LQT2, LQT3), Diagnosis (Tests, ECG, Genetic Testing), Treatment (Medications, Surgical Procedures), End Users (Hospitals, Diagnostic Labs, Research Organizations) - Global Forecast till 2030

ID: MRFR/Pharma/3861-HCR | 90 Pages | Author: Rahul Gotadki | March 2024         

TABLE OF CONTENT

Chapter 1. Report Prologue

Chapter 2. Market Introduction

2.1 Definition

2.2 Scope of the Study

2.2.1 Research Objective

2.2.2 Assumptions

2.2.3 Limitations

Chapter 3. Research Methodology

3.1 Introduction

3.2 Primary Research

3.3 Secondary research

3.4 Market Size Estimation

Chapter 4. Market Dynamics

4.1 Drivers

4.2 Restrains

4.3 Opportunities

4.4 Challenges

4.5 Macroeconomic Indicators

4.6 Technology Trends & Assessment

Chapter 5. Market Factor Analysis

5.1 Porter’s Five Forces Analysis

5.1.1 Bargaining Power of Suppliers

5.1.2 Bargaining Power of Buyers

5.1.3 Threat of New Entrants

5.1.4 Threat of Substitutes

5.1.5 Intensity of Rivalry

5.2 Value Chain Analysis

5.3 Investment Feasibility Analysis

5.4 Pricing Analysis

Chapter 6. Global Long QT Syndrome Market, by Type

6.1 Introduction

6.2 Long QT Syndrome Type 1 (LQT1)

Market Estimates & Forecast, 2020 – 2027

6.3 Long QT Syndrome Type 2 (LQT2)

Market Estimates & Forecast, 2020 – 2027

6.4 Long QT Syndrome Type 3 (LQT3)

Market Estimates & Forecast, 2020 – 2027

6.5 Others

Chapter 7. Global Long QT Syndrome Market, by Diagnosis

7.1 Introduction

7.2 Tests

Market Estimates & Forecast, 2020 – 2027

7.2.1 Serum Potassium Level Tests

7.2.2 Magnesium Level Tests

7.2.3 Others

7.3 Electrocardiogram (ECG)

Market Estimates & Forecast, 2020 – 2027

7.3.1 Holter Monitor

7.3.2 Event Monitor

7.3.3 Others

7.4 Genetic Testing

Market Estimates & Forecast, 2020 – 2027

7.5 Others

Chapter 8. Global Long QT Syndrome Market, by Treatment

8.1 Introduction

8.2 Medications

Market Estimates & Forecast, 2020 – 2027

8.2.1 Beta Blockers

8.2.1.1 Nadolol

8.2.1.2 Propranolol

8.2.1.3 Others

8.2.2 Mexiletine

8.2.3 Others

8.3 Surgical Procedures

Market Estimates & Forecast, 2020 – 2027

8.3.1 Left Cardiac Sympathetic Denervation Surgery

8.3.2 Implantable Cardioverter-Defibrillator (ICD)

8.3.3 Others

8.4 Others

Chapter 9 Global Long QT Syndrome Market, by End User

9.1 Introduction

9.2 Hospitals & Clinics

Market Estimates & Forecast, 2020 – 2027

9.3 Diagnostic Labs

Market Estimates & Forecast, 2020 – 2027

9.4 Research Organizations

Market Estimates & Forecast, 2020 – 2027

9.5 Others

Chapter 10. Global Long QT Syndrome Market, by Region

10.1 Introduction

10.2 Americas

10.2.1 North America

10.2.1.1 U.S.

10.2.1.2 Canada

10.2.2 South America

10.3 Europe

10.3.1 Western Europe

10.3.1.1 Germany

10.3.1.2 France

10.3.1.3 Italy

10.3.1.4 Spain

10.3.1.5 U.K

10.3.1.6 Rest of Western Europe

10.3.2 Eastern Europe

10.4 Asia Pacific

10.4.1 Japan

10.4.2 China

10.4.3 India

10.4.4 Australia

10.4.5 Republic of Korea

10.4.6 Rest of Asia Pacific

10.5 The Middle East & Africa

10.5.1 United Arab Emirates

10.5.2 Saudi Arabia

10.5.3 Oman

10.5.4 Kuwait

10.5.5 Qatar

10.5.6 Rest of the Middle East & Africa

Chapter 11 Company Landscape

11.1 Introduction

11.2 Market Share Analysis

11.3 Key Development & Strategies

11.3.1 Key Developments

Chapter 12 Company Profiles

12.1 Aralez Pharmaceuticals Inc.

12.1.1 Company Overview

12.1.2 Product Overview

12.1.3 Financials Overview \

12.1.4 Key Developments

12.1.5 SWOT Analysis

12.2 Asper Biogene

12.2.1 Company Overview

12.2.2 Product Overview

12.2.3 Financial Overview

12.2.4 Key Developments

12.2.5 SWOT Analysis

12.3 AstraZeneca

12.3.1 Company Overview

12.3.2 Product Overview

12.3.3 Financial Overview

12.3.4 Key Development

12.3.5 SWOT Analysis

12.4 Boston Scientific Corporation

12.4.1 Company Overview

12.4.2 Product/Business Segment Overview

12.4.3 Financial Overview

12.4.4 Key Development

12.4.5 SWOT Analysis

12.5 Cipla Inc.

12.5.1 Company Overview

12.5.2 Product Overview

12.5.3 Financial overview

12.5.4 Key Developments

12.5.5 SWOT Analysis

12.6 GeneDx.

12.6.1 Company Overview

12.6.2 Product Overview

12.6.3 Financial Overview

12.6.4 Key Developments

12.6.5 SWOT Analysis

12.7 Invitae Corporation

12.7.1 Overview

12.7.2 Product Overview

12.7.3 Financials

12.7.4 Key Developments

12.7.5 SWOT Analysis

12.8 Laboratory Corporation of America Holdings

12.8.1 Overview

12.8.2 Product Overview

12.8.3 Financials

12.8.4 Key Developments

12.8.5 SWOT Analysis

12.9 Lupin Pharmaceuticals, Inc.

12.9.1 Overview

12.9.2 Product Overview

12.9.3 Financials

12.9.4 Key Developments

12.9.5 SWOT Analysis

12.10 Mylan N.V.

12.10.1 Overview

12.10.2 Product Overview

12.10.3 Financials

12.10.4 Key Developments

12.10.5 SWOT Analysis

12.11 Pfizer Inc.

12.11.1 Overview

12.11.2 Product Overview

12.11.3 Financials

12.11.4 Key Developments

12.11.5 SWOT Analysis

12.12 Teva Pharmaceutical Industries Ltd.

12.12.1 Overview

12.12.2 Product Overview

12.12.3 Financials

12.12.4 Key Developments

12.12.5 SWOT Analysis

12.13 Torrent Pharmaceuticals Limited

12.13.1 Overview

12.13.2 Product Overview

12.13.3 Financials

12.13.4 Key Developments

12.13.5 SWOT Analysis

12.14 Zydus Pharmaceuticals, Inc.

12.14.1 Overview

12.14.2 Product Overview

12.14.3 Financials

12.14.4 Key Developments

12.14.5 SWOT Analysis

12.15 Others

Chapter 13 MRFR Conclusion

13.1 Key Findings

13.1.1 From CEO’s View Point

13.1.2 Unmet Needs of the Market

13.2 Key Companies to Watch

13.3 Prediction of Long QT Syndrome Industry

Chapter 14 Appendix

LIST OF TABLES

Table 1 Long QT Syndrome Industry Synopsis, 2020 – 2027

Table 2 Global Long QT Syndrome Market Estimates and Forecast, 2020 – 2027, (USD Million)

Table 3 Global Long QT Syndrome Market by Region, 2020 – 2027, (USD Million)

Table 4 Global Long QT Syndrome Market by Type, 2020 – 2027, (USD Million)

Table 5 Global Long QT Syndrome Market by Diagnosis, 2020 – 2027, (USD Million)

Table 6 Global Long QT Syndrome Market by Treatment, 2020 – 2027, (USD Million)

Table 7 Global Long QT Syndrome Market by End User, 2020 – 2027, (USD Million)

Table 8 North America Long QT Syndrome Market by Type, 2020 – 2027, (USD Million)

Table 9 North America Long QT Syndrome Market by Diagnosis, 2020 – 2027, (USD Million)

Table 10 North America Long QT Syndrome Market by Treatment, 2020 – 2027, (USD Million)

Table 11 North America Long QT Syndrome Market by End User, 2020 – 2027, (USD Million)

Table 12 U.S. Long QT Syndrome Market by Type, 2020 – 2027, (USD Million)

Table 13 U.S. Long QT Syndrome Market by Diagnosis, 2020 – 2027, (USD Million)

Table 14 U.S. Long QT Syndrome Market by Treatment, 2020 – 2027, (USD Million)

Table 15 U.S. Long QT Syndrome Market by End User, 2020 – 2027, (USD Million)

Table 16 Canada Long QT Syndrome Market by Type, 2020 – 2027, (USD Million)

Table 17 Canada Long QT Syndrome Market by Diagnosis, 2020 – 2027, (USD Million)

Table 18 Canada Long QT Syndrome Market by Treatment, 2020 – 2027, (USD Million)

Table 19 Canada Long QT Syndrome Market by End User, 2020 – 2027, (USD Million)

Table 20 South America Long QT Syndrome Market by Type, 2020 – 2027, (USD Million)

Table 21 South America Long QT Syndrome Market by Diagnosis, 2020 – 2027, (USD Million)

Table 22 South America Long QT Syndrome Market by Treatment, 2020 – 2027, (USD Million)

Table 23 South America Long QT Syndrome Market by End User, 2020 – 2027, (USD Million)

Table 24 Europe Long QT Syndrome Market by Type, 2020 – 2027, (USD Million)

Table 25 Europe Long QT Syndrome Market by Diagnosis, 2020 – 2027, (USD Million)

Table 26 Europe Long QT Syndrome Market by Treatment, 2020 – 2027, (USD Million)

Table 27 Europe Long QT Syndrome Market by End User, 2020 – 2027, (USD Million)

Table 28 Western Europe Long QT Syndrome Market by Type, 2020 – 2027, (USD Million)

Table 29 Western Europe Long QT Syndrome Market by Diagnosis, 2020 – 2027, (USD Million)

Table 30 Western Europe Long QT Syndrome Market by Treatment, 2020 – 2027, (USD Million)

Table 31 Western Europe Long QT Syndrome Market by End User, 2020 – 2027, (USD Million)

Table 32 Eastern Europe Market by Type, 2020 – 2027, (USD Million)

Table 33 Eastern Europe Long QT Syndrome Market by Diagnosis, 2020 – 2027, (USD Million)

Table 34 Eastern Europe Long QT Syndrome Market by Treatment, 2020 – 2027, (USD Million)

Table 35 Eastern Europe Long QT Syndrome Market by End User, 2020 – 2027, (USD Million)

Table 36 Asia Pacific Long QT Syndrome Market by Type, 2020 – 2027, (USD Million)

Table 37 Asia Pacific Long QT Syndrome Market by Diagnosis, 2020 – 2027, (USD Million)

Table 38 Asia Pacific Long QT Syndrome Market by Treatment, 2020 – 2027, (USD Million)

Table 39 Asia Pacific Long QT Syndrome Market by End User, 2020 – 2027, (USD Million)

Table 40 Middle East & Africa Long QT Syndrome Market by Type, 2020 – 2027, (USD Million)

Table 41 Middle East & Africa Long QT Syndrome Market by Diagnosis, 2020 – 2027, (USD Million)

Table 42 Middle East & Africa Long QT Syndrome Market by Treatment, 2020 – 2027, (USD Million)

Table 43 Middle East & Africa Long QT Syndrome Market by End User, 2020 – 2027, (USD Million)

LIST OF FIGURES

Figure 1 Research Process

Figure 2 Segmentation for Global Long QT Syndrome Market

Figure 3 Market Dynamics for Global Long QT Syndrome Market

Figure 4 Global Long QT Syndrome Market Share, by Type 2020

Figure 5 Global Long QT Syndrome Market Share, by Diagnosis 2020

Figure 6 Global Long QT Syndrome Market Share, by Treatment 2020

Figure 7 Global Long QT Syndrome Market Share, by End User, 2020

Figure 8 Global Long QT Syndrome Market Share, by Region, 2020

Figure 9 North America Long QT Syndrome Market Share, by Country, 2020

Figure 10 Europe Long QT Syndrome Market Share, by Country, 2020

Figure 11 Asia Pacific Long QT Syndrome Market Share, by Country, 2020

Figure 12 Middle East & Africa Long QT Syndrome Market Share, by Country, 2020

Figure 13 Global Long QT Syndrome Market: Company Share Analysis, 2020 (%)

Figure 14 Aralez Pharmaceuticals Inc.: Key Financials

Figure 15 Aralez Pharmaceuticals Inc.: Segmental Revenue

Figure 16 Aralez Pharmaceuticals Inc.: Geographical Revenue

Figure 17 Asper Biogene: Key Financials

Figure 18 Asper Biogene: Segmental Revenue

Figure 19 Asper Biogene: Geographical Revenue

Figure 20 AstraZeneca: Key Financials

Figure 21 AstraZeneca: Segmental Revenue

Figure 22 AstraZeneca: Geographical Revenue

Figure 23 Boston Scientific Corporation: Key Financials

Figure 24 Boston Scientific Corporation: Segmental Revenue

Figure 25 Boston Scientific Corporation: Geographical Revenue

Figure 26 Cipla Inc.: Key Financials

Figure 27 Cipla Inc.: Segmental Revenue

Figure 28 Cipla Inc.: Geographical Revenue

Figure 29 GeneDx.: Key Financials

Figure 30 GeneDx.: Segmental Revenue

Figure 31 GeneDx.: Geographical Revenue

Figure 32 Invitae Corporation: Key Financials

Figure 33 Invitae Corporation: Segmental Revenue

Figure 34 Invitae Corporation: Geographical Revenue

Figure 35 Laboratory Corporation of America Holdings: Key Financials

Figure 36 Laboratory Corporation of America Holdings: Segmental Revenue

Figure 37 Laboratory Corporation of America Holdings: Geographical Revenue

Figure 38 Lupin Pharmaceuticals, Inc.: Key Financials

Figure 39 Lupin Pharmaceuticals, Inc.: Segmental Revenue

Figure 40 Lupin Pharmaceuticals, Inc.: Geographical Revenue

Figure 41 Mylan N.V.: Key Financials

Figure 42 Mylan N.V.: Segmental Revenue

Figure 43 Mylan N.V.: Geographical Revenue

Figure 44 Pfizer Inc.: Key Financials

Figure 45 Pfizer Inc.: Segmental Revenue

Figure 46 Pfizer Inc.: Geographical Revenue

Figure 47 Teva Pharmaceutical Industries Ltd.: Key Financials

Figure 48 Teva Pharmaceutical Industries Ltd.: Segmental Revenue

Figure 49 Teva Pharmaceutical Industries Ltd.: Geographical Revenue

Figure 50 Torrent Pharmaceuticals Limited: Key Financials

Figure 51 Torrent Pharmaceuticals Limited: Segmental Revenue

Figure 52 Torrent Pharmaceuticals Limited: Geographical Revenue

Figure 53 Zydus Pharmaceuticals, Inc.: Key Financials

Figure 54 Zydus Pharmaceuticals, Inc.: Segmental Revenue

Figure 55 Zydus Pharmaceuticals, Inc.: Geographical Revenue

Leading companies partner with us for data-driven Insights.
Report List icon Report List icon Report List icon Report List icon Report List icon Report List icon Report List icon Report List icon Report List icon Report List icon Report List icon

Kindly complete the form below to receive a free sample of this Report

Please fill in Business Email for Quick Response
Invalid