Liquid Nitrogen Market

Key Players: Linde plc, Air Liquide S.A., Air Products & Chemicals, Taiyo Nippon Sanso (Nippon Sanso Holdings), Messer Group, SOL Group, Gulf Cryo, Buzwair Group

Liquid Nitrogen Market

Liquid Nitrogen Market Research Report: By Storage (Cryogenic Cylinders & Packaged Gas, Tonnage), By Technology (Cryogenic Distillation, Pressure Swing Adsorption), By End-Use Industry (Chemical, Healthcare, Food & Beverages, Foundry) and By Regional (North America, Europe, South America, Asia Pacific, Middle East and Africa) - Forecast to 2035.
ID: MRFR/CnM/1591-HCR
111 Pages
Chitranshi Jaiswal
Last Updated: June 16, 2026

Liquid Nitrogen Market Summary

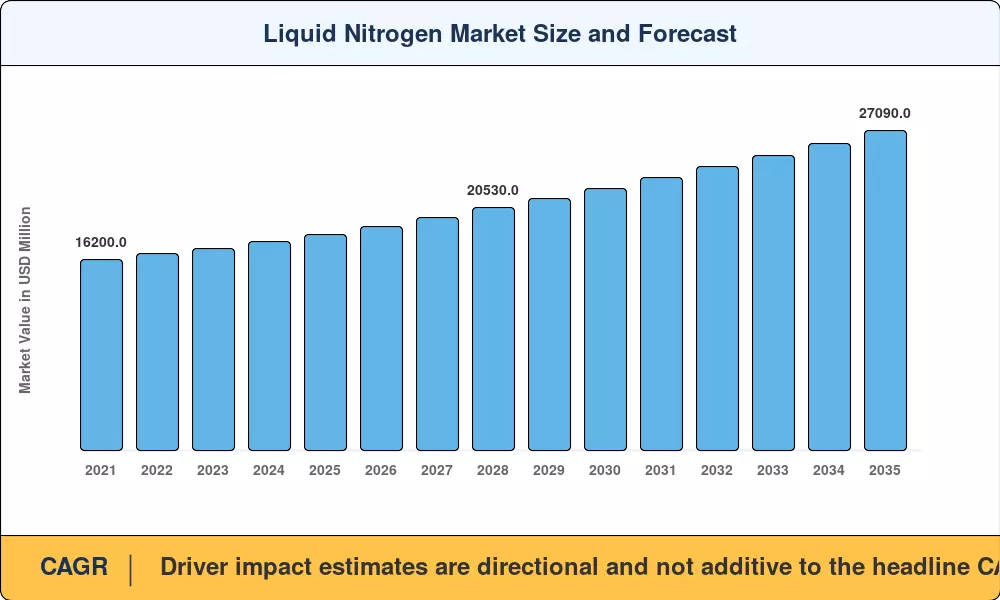
The Liquid Nitrogen Market reached an estimated USD 18,250 Million in 2025 and is projected to grow from USD 18,980 Million in 2026 to USD 27,090 Million by 2035, registering a CAGR of 4.01% during the forecast period. Demand for cryogenic gases continues to accelerate as healthcare cold-chain mandates expand, semiconductor fabs multiply across Asia, and food processors invest in rapid-freeze technologies that extend shelf life while preserving nutritional profiles. Government-backed biostorage programs — including the U.S. BARDA strategic stockpiling initiative and the EU's Pharmaceutical Strategy roadmap — are locking in multi-year nitrogen supply contracts that underpin baseline volume growth [2].

The Liquid Nitrogen Market is undergoing a notable technology shift. Legacy bulk-delivery logistics are giving way to on-site cryogenic generation systems paired with IoT-enabled telemetry, cutting waste by up to 18% per facility according to a 2024 Linde sustainability disclosure [3]. Air-separation unit operators are deploying energy-efficient distillation columns that lower specific energy consumption below 0.35 kWh per cubic meter of nitrogen, making industrial nitrogen gas production more cost-competitive against alternative cooling methods. Capital commitments to new air-separation capacity exceeded USD 4.2 billion globally in 2024, a figure that signals continued confidence in long-cycle demand for cryogenic cooling solutions [4].

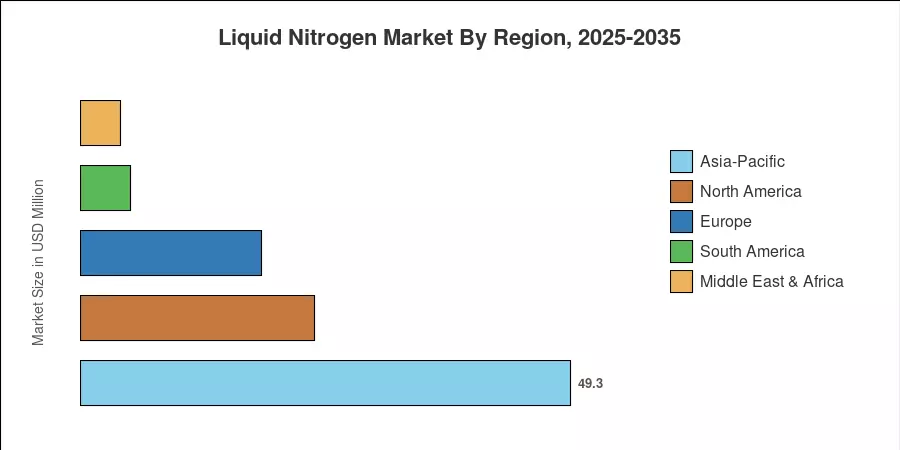
Asia-Pacific dominates the Liquid Nitrogen Market with approximately 49.3% revenue share, propelled by China's semiconductor build-out and India's expanding biologics manufacturing base. The region also posts the fastest CAGR at 4.70% through 2035. North America holds roughly 23.5% share, anchored by pharmaceutical cold-chain investments and outpatient oncology clinics that rely on medical cryogenic gases for dermatological and surgical procedures. Europe trails at 18.2%, with demand driven by food freezing gases adoption in convenience-food manufacturing and the continent's regulatory push toward low-GWP refrigerants. The Liquid Nitrogen Market outlook remains structurally positive as downstream industries deepen their reliance on ultra-cold storage solutions for mission-critical processes.


Key Report Takeaways — Liquid Nitrogen Market

By Storage Type

  • Packaged gas accounted for roughly 70.0% of the Liquid Nitrogen Market share in 2025, driven by widespread adoption across healthcare and electronics manufacturing.
  • Cylinder storage is anticipated to expand at a 4.48% CAGR through 2035, fueled by rising demand from specialty industrial gases distributors serving laboratory and small-batch food processing customers.

By Function

  • Coolant applications commanded approximately 61.8% of the Liquid Nitrogen Market revenue in 2025, reflecting entrenched usage in cryogenic cooling solutions for semiconductor wafer processing and pharmaceutical freeze-drying.
  • Refrigerant use is advancing at a 5.00% CAGR to 2035, as food processors and logistics firms scale nitrogen freezing systems for rapid temperature reduction.

By End-User Industry

  • The chemical and pharmaceutical segment represented about 28.5% of the Liquid Nitrogen Market in 2025, supported by biologics cold-chain expansion and active pharmaceutical ingredient synthesis.
  • Food and beverage is the fastest-growing end-user vertical at a 5.20% CAGR, with demand centered on food freezing gases for tunnel freezers, IQF systems, and modified-atmosphere packaging.

By Region

  • Asia-Pacific led the Liquid Nitrogen Market with 49.3% revenue share in 2025 and is forecast to grow at 4.70% CAGR to 2035, led by semiconductor and biologics expansion.
  • North America maintained the second-largest share at 23.5%, anchored by industrial gas applications in healthcare and aerospace.


Liquid Nitrogen Market Size and Forecast (2021–2035)

MRFR's market sizing combines bottom-up supply-side modeling of air-separation unit capacity with top-down demand validation across industrial nitrogen gas consumption databases, trade statistics, and proprietary interviews with industrial gas distributors. Historical figures (2021–2024) reflect reported industry data; forecast figures (2026–2035) apply the calibrated 4.01% CAGR with year-specific adjustments for capacity additions and regulatory milestones[5].

Liquid Nitrogen Market Size and Forecast
Our Impact
Enabled $4.3B Revenue Impact for Fortune 500 and Leading Multinationals
Partnering with 2000+ Global Organizations Each Year
30K+ Citations by Top-Tier Firms in the Industry

Driver Impact Analysis

Driver ~% Impact on CAGR Geographic Relevance Impact Timeline
Semiconductor fab expansion +0.9% Asia-Pacific, North America Medium-term (2–4 yr)
Biologics & vaccine cold-chain scaling +0.7% Global Short-term (≤2 yr)
Quick-freeze food processing adoption +0.6% Europe, Asia-Pacific Medium-term (2–4 yr)
Low-GWP refrigerant regulations +0.5% Europe, North America Short-term (≤2 yr)
On-site nitrogen generation technology +0.4% Global Long-term (≥4 yr)
Quantum computing & superconducting infrastructure +0.3% North America, Europe Long-term (≥4 yr)
Medical cryotherapy & dermatology growth +0.2% North America, Europe Short-term (≤2 yr)


Semiconductor Fabrication Expansion

China's National Integrated Circuit Industry Investment Fund ("Big Fund") Phase III deployed over USD 47 billion in 2024, with a significant portion directed toward advanced-node fabs requiring industrial nitrogen gas for wafer purging, chamber inerting, and thermal management [6]. Each new 300mm fab consumes an estimated 2,000–3,500 tons of cryogenic gases annually, creating captive demand locked under 10–15 year take-or-pay contracts. Taiwan, South Korea, and the United States are matching this build-out through their respective CHIPS Act programs, collectively adding over 30 fabs by 2028 — each representing a multi-decade nitrogen offtake commitment that stabilizes the Liquid Nitrogen Market baseline.

Biologics Cold-Chain and Vaccine Storage

The global biologics pipeline exceeded 8,000 molecules in clinical development as of Q1 2025, per Pharma Intelligence data, and the majority require ultra cold storage solutions at –80 °C to –196 °C during manufacture, transport, and administration [2]. BARDA's USD 1.2 billion Strategic National Stockpile modernization earmarked roughly USD 190 million for cryogenic storage infrastructure between 2024 and 2027. India's Department of Biotechnology simultaneously invested INR 1,500 crore in biorepository infrastructure, reinforcing demand for medical cryogenic gases across the Asia-Pacific Liquid Nitrogen Market [8].

Quick-Freeze Food Processing

The EU Farm-to-Fork strategy mandates a 50% reduction in food waste by 2030, incentivizing rapid-freeze technologies that preserve texture and nutrient content [11]. Tunnel freezers and individually quick-frozen (IQF) lines using food freezing gases are displacing mechanical blast freezers, which consume 25–40% more energy per ton of product. Europe's frozen-food sector invested an estimated EUR 2.8 billion in nitrogen-based freezing systems between 2022 and 2024, and similar adoption is accelerating across Southeast Asia and Latin America as cold-chain logistics mature.

Low-GWP Refrigerant Regulations

The EU F-Gas Regulation revision (2024/573) phases down hydrofluorocarbon quotas by 95% relative to the 2015 baseline by 2030, pushing industrial refrigeration operators toward nitrogen-based alternatives with zero global warming potential [7]. In North America, the AIM Act directs an 85% HFC reduction by 2036. These regulatory tailwinds make refrigerated gas products — including liquid nitrogen — the default cooling medium in sectors where synthetic refrigerants face mounting compliance risk, directly benefiting the Liquid Nitrogen Market growth trajectory.


Restraints Impact Analysis

Restraint impacts reflect estimated dampening effects on baseline growth. They are directional and should not be netted against the drivers to derive the headline CAGR.

Restraint ~% Impact on CAGR Geographic Relevance Impact Timeline
Energy-intensive production process –0.4% Global Long-term (≥4 yr)
Hazardous handling & asphyxiation risk –0.3% Global Short-term (≤2 yr)
On-site generation cannibalization –0.3% North America, Europe Medium-term (2–4 yr)
Transport & storage logistics cost –0.2% Emerging markets Medium-term (2–4 yr)
Alternative cooling technology competition –0.2% Asia-Pacific Long-term (≥4 yr)


Energy-Intensive Production Economics

Cryogenic air separation consumes approximately 0.3–0.5 kWh per normal cubic meter of nitrogen, and electricity accounts for 50–60% of the delivered cost for industrial nitrogen gas [14]. In regions with volatile energy pricing — particularly Europe post-2022 — this cost structure squeezes margins and can slow capacity additions. The IEA's 2024 World Energy Outlook flagged industrial gas production among sectors facing a 12–18% energy cost increase under the Stated Policies Scenario through 2030, tempering Liquid Nitrogen Market expansion in energy-exposed geographies.

Handling Safety and Regulatory Compliance

Liquid nitrogen poses well-documented asphyxiation and cryogenic burn hazards that impose rigorous safety compliance costs. OSHA's 29 CFR 1910.101 and the European CLP Regulation require engineering controls, ventilation systems, and personnel training that raise operational overhead by an estimated 8–12% for smaller distributors [15]. In price-sensitive emerging markets, these compliance costs can slow adoption of cryogenic gases, particularly among small food processors and laboratories evaluating nitrogen freezing systems against less hazardous alternatives.

On-Site Nitrogen Generation Cannibalization

Pressure swing adsorption (PSA) and membrane nitrogen generators increasingly enable end users to produce gaseous nitrogen on-site, bypassing the liquid supply chain entirely [3]. While on-site systems generate lower-purity nitrogen unsuitable for cryogenic applications, they capture a growing share of inerting and blanketing demand that historically consumed industrial nitrogen gas in liquid form. This partial demand substitution constrains the addressable volume for liquid-state delivery, moderating overall Liquid Nitrogen Market growth by redirecting approximately 4–6% of non-critical applications to in-house generation.


Liquid Nitrogen Market Opportunities

Quantum Computing and Superconducting Infrastructure

Quantum processors have to be continuously cooled to near absolute zero, and dilution refrigerators employ liquid nitrogen at the outer thermal stage. IBM, Google, and several national labs possess more than 200 quantum systems that require annual restocking of cryogenic gases [10]. As quantum technology moves from hundreds to thousands of qubits, the Liquid Nitrogen Market could grab a premium application area where supply reliability is more important than price sensitivity.


Emerging-Market Cold-Chain Buildout

World Bank investigation [16] indicates that cold-chain gaps cause losses of an estimated 30–40% of perishable food production in sub-Saharan Africa and Southeast Asia. Governments in Nigeria, Kenya, Vietnam and the Philippines are directing development funds into food freezing gases infrastructure generating greenfield demand for industrial gas uses. This gives a structural onramp for mid-sized nitrogen suppliers to seek volume expansion outside of saturated Western markets.


Nitrogen-as-a-Service and Digital Distribution Models

Several regional distributors have begun to supply nitrogen on a consumption-metered basis with IoT-enabled cryogenic tanks that automate ordering and billing, a concept similar to the pay-per-use economics in cloud computing [3]. These platforms reduce the hurdles for small and mid-sized buyers of specialty industrial gases and create recurring income streams that enhance supplier visibility. These digitally enabled service models can help the Liquid Nitrogen Market increase its potential client base by 15–20%.


Cryogenic Energy Storage

Liquid air energy storage (LAES) technology, demonstrated at commercial scale by Highview Power’s 50 MW / 250 MWh facility in the UK, has liquid nitrogen as its working medium [18]. LAES is being considered by grid operators looking for alternatives to lithium-ion batteries for long-duration storage as a spatially unconstrained option that might add thousands of tons of yearly cryogenic gases demand per plant. This new application could transform the Liquid Nitrogen Market by generating a new class of anchor customers in the energy transition ecosystem.


Aesthetic and Regenerative Medicine

Cryotherapy clinics grew at a 12% annual rate between 2021 and 2024, with whole-body cryotherapy and localized cryosurgery applications driving recurring demand for medical cryogenic gases [13]. The global wellness industry's trajectory toward evidence-based treatments is expected to sustain this growth vector, especially in North America and Europe, where outpatient procedure volumes are rising.


Liquid Nitrogen Market Future Outlook

Digital Supply Chain and AI-Optimized Logistics

The Liquid Nitrogen Market is rapidly integrating digital twins, machine learning demand forecasting, and IoT-equipped cryogenic tanks that report fill levels in real time. Air Liquide's 2024 Annual Report disclosed that its digital logistics platform reduced unscheduled deliveries by 22% and cut fleet emissions by 14% [3]. By 2030, MRFR expects over 60% of large-volume nitrogen contracts to include digitally enabled service-level agreements, transforming the market from a commodity-delivery model to a managed-service model for industrial nitrogen gas.

Electrification Supercycle and Grid-Scale Cryogenics

The IEA projects global electricity demand to grow 3.4% annually through 2035, driven by datacenter proliferation, EV charging infrastructure, and industrial electrification [14]. Superconducting cables cooled by liquid nitrogen can transmit 5–10× the power of conventional copper at comparable voltage, and pilot deployments in Essen (Germany) and Long Island (United States) have validated commercial viability [12]. Broad adoption of superconducting grid infrastructure would create a new structural demand layer for the Liquid Nitrogen Market, independent of traditional industrial consumption cycles.

Sustainability and Carbon-Intensity Reduction

Industrial gas producers face mounting ESG scrutiny, with Scope 1 and 2 emissions from air-separation units increasingly subject to carbon pricing mechanisms. Linde, Air Products, and Air Liquide have each committed to 30–35% carbon intensity reductions by 2035 [3][4]. These targets are driving investment in renewable-powered electrolysis, waste-heat recovery, and modular plant designs that lower the carbon footprint of cryogenic gases production. Buyers of specialty industrial gases are incorporating supplier carbon metrics into procurement decisions, creating a competitive moat for early movers.

Convergence of Healthcare and Cryopreservation

Cell and gene therapies — a market projected to reach USD 40 billion by 2032 per Alliance for Regenerative Medicine estimates — depend on cryogenic preservation at every stage from donor collection to patient administration [13]. This convergence positions the Liquid Nitrogen Market as essential infrastructure for precision medicine, with ultra cold storage solutions embedded into hospital, biobank, and manufacturing facility design. Regulatory requirements for validated cold-chain traceability will further entrench liquid nitrogen as the default cryogen over mechanical alternatives.


Liquid Nitrogen Market Segmentation

By Storage Type

Segment Key Metric Primary Demand Driver
Packaged Gas 70.0% share (2025) Hospital, laboratory, and electronics fab delivery
Cylinder 4.48% CAGR (2026–2035) Specialty industrial gases for small-batch users


Packaged gas dominates the Liquid Nitrogen Market by storage type, reflecting established logistics networks that deliver bulk cryogenic gases via vacuum-insulated tankers to hospitals, semiconductor fabs, and food processing plants. This format benefits from economies of scale and long-term supply agreements with anchor customers. Cylinder storage, while a smaller share, is expanding faster as laboratory services, cosmetic cryotherapy clinics, and artisanal food producers drive demand for portable, on-demand nitrogen freezing systems. Distributors are investing in lightweight composite cylinders that improve handling safety and extend hold time for medical cryogenic gases.

By Function

Segment Key Metric Primary Demand Driver
Coolant 61.8% share (2025) Semiconductor processing; pharmaceutical lyophilization
Refrigerant 5.00% CAGR (2026–2035) Food freezing gases; cold-chain logistics


Coolant applications account for the majority of the Liquid Nitrogen Market by function, with entrenched usage in electronics manufacturing, thermal management, pharmaceutical freeze-drying, and metals treatment. Semiconductor fabs alone consume thousands of tons annually, using cryogenic cooling solutions for chamber purging and wafer thermal cycling. The refrigerant segment is gaining ground rapidly as food processors replace synthetic refrigerants with nitrogen-based rapid-freeze systems that comply with low-GWP regulations. This function-driven shift toward refrigerated gas products is expected to narrow the gap between the two segments over the forecast period.

By End-User Industry

Segment Key Metric Primary Demand Driver
Chemical & Pharmaceutical 28.5% share (2025) Biologics cold-chain; API synthesis inerting
Transportation 14.2% share (2025) Cryogenic fuel systems; cold-chain trucking
Food & Beverage 5.20% CAGR (2026–2035) IQF systems; food freezing gases for export compliance
Electronics & Semiconductor USD 3,100 Million (2025) Wafer fab inerting; display manufacturing
Other End-User Industries 3.60% CAGR (2026–2035) Metal fabrication; aerospace; mining


Chemical and pharmaceutical end users anchor the largest share of the Liquid Nitrogen Market, where industrial nitrogen gas serves dual roles as a process coolant and an inert atmosphere provider. Biologics manufacturers depend on ultra-cold storage solutions for cell-line preservation, lyophilization, and transport, making nitrogen an operationally non-negotiable input. The food and beverage segment is the fastest-growing vertical, powered by global consumer preference for frozen convenience foods and tightening export-market regulations that require nitrogen freezing systems to meet pathogen-reduction standards. Industrial gas applications in this segment span tunnel freezers, spiral freezers, and cryogenic immersion lines.


Regional Market Share Analysis

Region Key Metric Primary Investment Themes
Asia-Pacific 49.3% share (2025) Semiconductor fabs; biologics cold-chain; cryogenic gases for electronics
North America 23.5% share (2025) Pharmaceutical storage; aerospace; medical cryogenic gases
Europe 18.2% share (2025) Food freezing gases; F-gas replacement; nitrogen freezing systems
South America 5.0% share (2025) Food export processing; mining applications
Middle East & Africa 4.0% share (2025) Oil & gas inerting; emerging cold-chain for refrigerated gas products
Total 100%

The Liquid Nitrogen Market displays a clear Asia-Pacific center of gravity, but demand for cryogenic cooling solutions, food freezing gases, and industrial nitrogen gas is expanding across all five major regions. Regional supply dynamics vary significantly based on energy cost, air-separation unit density, and downstream industrial mix.


North America

Country Key Metric Key Driver
United States 4.12% CAGR (2026–2035) Pharma cold-chain, CHIPS Act fab build-out
Canada USD 790 Million (2025) Liquefied natural gas plant co-production
Mexico 3.85% CAGR (2026–2035) Nearshoring-driven food processing expansion


The United States accounts for the majority of North American demand for the Liquid Nitrogen Market, driven by pharmaceutical ultra cold storage solutions and a resurgent semiconductor sector. The CHIPS and Science Act has catalyzed over USD 200 billion in announced fab investments since 2022, each facility anchoring long-term nitrogen supply contracts [6]. Canada's participation centers on co-production from large-scale LNG and petrochemical complexes in Alberta and British Columbia, while Mexico's growing food export industry is integrating food freezing gases into processing lines to meet U.S. FDA and USDA safety standards.

Europe

Country Key Metric Key Driver
Germany 28.4% of regional share Automotive and chemical industry nitrogen usage
United Kingdom 3.95% CAGR (2026–2035) Biotech cold-chain; cryogenic energy storage
France USD 540 Million (2025) Aerospace manufacturing; nuclear sector inerting
Italy 3.80% CAGR (2026–2035) Frozen food manufacturing
Spain USD 310 Million (2025) Agri-food export processing
Nordic Countries 4.10% CAGR (2026–2035) Aquaculture and seafood freezing
Russia USD 380 Million (2025) Metals processing; oil and gas applications
Rest of Europe 12.1% of regional share Diversified industrial gas applications


Europe's Liquid Nitrogen Market is shaped by the EU's F-Gas Regulation and Farm-to-Fork targets that incentivize nitrogen-based cooling over synthetic refrigerants. Germany leads regional consumption thanks to its dense chemical, automotive, and pharmaceutical manufacturing base. The UK stands out for its cryogenic energy storage pilot programs, while the Nordics leverage nitrogen freezing systems for high-value seafood exports. Overall, the European Liquid Nitrogen Market benefits from strict regulatory frameworks that entrench cryogenic gases as compliant cooling solutions.

Asia-Pacific

Country Key Metric Key Driver
China 38.2% of regional share Semiconductor and electronics fab expansion
India 5.10% CAGR (2026–2035) Biologics manufacturing and vaccine cold-chain
Japan USD 1,150 Million (2025) Advanced materials processing; quantum research
South Korea 4.65% CAGR (2026–2035) Memory chip fabrication; display manufacturing
ASEAN USD 820 Million (2025) Food processing for export; cold-chain buildout
Rest of Asia-Pacific 3.90% CAGR (2026–2035) General industrialization demand


Asia-Pacific's dominance in the Liquid Nitrogen Market reflects the region's outsized concentration of semiconductor, electronics, and pharmaceutical production. China alone commissioned 18 new wafer fabs between 2023 and 2025, each requiring dedicated industrial nitrogen gas supply infrastructure. India's Liquid Nitrogen Market growth accelerated after the Department of Biotechnology's INR 1,500 crore biorepository initiative expanded demand for ultra cold storage solutions in vaccine and biologics distribution. South Korea and Japan contribute high-value consumption through advanced materials, display fabrication, and emerging quantum computing cryogenic requirements.

South America

Country Key Metric Key Driver
Brazil 58.3% of regional share Food export processing; petrochemical inerting
Argentina USD 130 Million (2025) Agricultural cold-chain; lithium mining
Rest of South America 3.70% CAGR (2026–2035) Mining and general industrialization


Brazil is the principal consumption hub within South America's Liquid Nitrogen Market, where food freezing gases are integral to the country's massive protein export supply chain. Argentina's emerging lithium mining sector and growing agricultural processing industry add incremental demand for cryogenic gases, while Chile and Colombia are developing early-stage cold-chain networks with support from multilateral development banks.

Middle East & Africa

Country Key Metric Key Driver
Saudi Arabia 31.5% of regional share Oil & gas inerting; Vision 2030 industrial diversification
UAE 4.25% CAGR (2026–2035) Logistics hub cold-chain; pharma FTZ operations
South Africa USD 95 Million (2025) Mining; healthcare infrastructure
Egypt 3.65% CAGR (2026–2035) Industrial growth; food processing
Rest of MEA 25.0% of regional share Oil & gas and general industrial demand


The Middle East & Africa Liquid Nitrogen Market remains the smallest regional segment but offers disproportionate growth potential. Saudi Arabia's Vision 2030 industrial diversification agenda is channeling investment into pharmaceutical manufacturing and food self-sufficiency programs that require refrigerated gas products. The UAE leverages its position as a global logistics hub to serve re-export cold-chain operations, while Sub-Saharan African nations are early-stage targets for development-financed cold-chain infrastructure serving industrial gas applications.


Liquid Nitrogen Market By Region, 2025-2035

Competitive Benchmarking

The Liquid Nitrogen Market exhibits medium concentration, with the top five players collectively commanding an estimated 55–65% of global revenue. Vertically integrated majors — operating air-separation units, distribution networks, and on-site generation services — compete on delivered cost, reliability, and digital service capabilities. Mid-tier regional firms maintain competitive positions in specialty industrial gases niches, particularly in food processing and laboratory supply. The estimated HHI index for the sector sits between 800 and 1,200, consistent with a moderately consolidated structure.

Company Est. Revenue Share Range Key Offerings for Liquid Nitrogen Market Strategic Positioning
Linde plc ~12–16% Bulk & packaged cryogenic gases; on-site generation Global leader with integrated digital logistics platform
Air Liquide S.A. ~11–15% Medical cryogenic gases; electronics-grade nitrogen Strong pharma and semiconductor positioning
Air Products & Chemicals ~8–12% Industrial nitrogen gas; gasification-integrated supply Energy-sector anchor with large-scale ASU capacity
Taiyo Nippon Sanso (Nippon Sanso Holdings) ~6–9% Specialty industrial gases; electronics process gases Asia-Pacific leader with Japan/Korea fab relationships
Messer Group ~4–7% Packaged gas; food freezing gases European mid-market champion with food-sector focus
SOL Group ~2–4% Medical and homecare cryogenic gases Southern European healthcare specialist
Gulf Cryo ~2–4% Bulk industrial nitrogen gas; cylinder distribution Middle East regional leader
Buzwair Group ~1–3% Industrial gas applications; specialty gas blends Qatar/GCC focused with oil & gas clientele
Yingde Gases Group ~3–5% Large-scale ASU operation; bulk industrial supply China market leader with steel and chemical customer base
Ellenbarrie Industrial Gases ~1–2% Cylinder and packaged gas distribution India market specialist in medical and lab segments


Recent News & Developments


  • Air Liquide (July 2024) put into service a new air separation unit (ASU) in Kosi, Uttar Pradesh, India, strengthening healthcare and industrial merchant activities. This ASU has a daily output capability of more than 300 tonnes of liquid and medicinal oxygen, circa 45 tonnes of liquid nitrogen and 12 tonnes of liquid argon.


  • Highview Power (June 2024 ): Secured GBP 100 million in project finance for a second liquid air energy storage facility, underscoring growing demand for cryogenic gases in grid storage applications [18].


Liquid Nitrogen Market Report Scope

Item Detail
Market Scope Global Liquid Nitrogen Market by Storage Type, Function, End-User Industry, and Geography
Study Period 2021–2035
Historical Period 2021–2024
Base Year 2025
Forecast Period 2026–2035
CAGR (2026–2035) 4.01%
Market Size (2025) USD 18,250 Million
Market Size (2035) USD 27,090 Million
Fastest Growing Segment Food & Beverage (5.20% CAGR)
Fastest Growing Region Asia-Pacific (4.70% CAGR)
Companies Profiled 10 (Linde, Air Liquide, Air Products, Taiyo Nippon Sanso, Messer, SOL Group, Gulf Cryo, Buzwair, Yingde Gases, Ellenbarrie)
Valuation Currency USD Million
CAGR Driver Disclaimer Driver impact estimates are directional and not additive to the headline CAGR figure


Author
Author
Author Profile
Chitranshi Jaiswal LinkedIn
Team Lead - Research
Chitranshi is a Team Leader in the Chemicals & Materials (CnM) and Energy & Power (EnP) domains, with 6+ years of experience in market research. She leads and mentors teams to deliver cross-domain projects that equip clients with actionable insights and growth strategies. She is skilled in market estimation, forecasting, competitive benchmarking, and both primary & secondary research, enabling her to turn complex data into decision-ready insights. An engineer and MBA professional, she combines technical expertise with strategic acumen to solve dynamic market challenges. Chitranshi has successfully managed projects that support market entry, investment planning, and competitive positioning, while building strong client relationships. Certified in Advanced Excel & Power BI she leverages data-driven approaches to ensure accuracy, clarity, and impactful outcomes.

Research Approach


Secondary Research

The secondary research process involved comprehensive analysis of regulatory databases, industry safety standards, peer-reviewed engineering journals, and authoritative industrial gas associations. Key sources included the Occupational Safety and Health Administration (OSHA), Environmental Protection Agency (EPA), U.S. Department of Transportation (DOT), Food and Drug Administration (FDA), Chemical Safety Board (CSB), American Society of Mechanical Engineers (ASME), National Institute for Occupational Safety and Health (NIOSH), Compressed Gas Association (CGA), European Industrial Gases Association (EIGA), Cryogenic Society of America, British Cryogenics Council, International Organization for Standardization (ISO), National Fire Protection Association (NFPA), gasworld Business Intelligence, Eurostat Industrial Production Database, U.S. Energy Information Administration (EIA), and National Center for Biotechnology Information (NCBI/PubMed). These sources were used to collect production capacity statistics, safety incident data, regulatory compliance standards (OSHA 1910.101, CGA P-12, ASME Section VIII), air separation unit (ASU) utilization rates, and end-user consumption patterns across cryogenic distillation, pressure swing adsorption, and membrane separation technologies.


Primary Research

To gather both qualitative and quantitative information, the primary research process involved interviewing players from both the supply and demand sides. Executives from industrial gas majors and regional distributors, as well as heads of regulatory affairs and plant managers from air separation plants, were among the supply-side sources. Members of the demand side included plant directors responsible for procurement in the food and beverage industry, leaders of pharmaceutical manufacture, managers of biobanking facilities, engineers specializing in semiconductor fabrication, cryosurgery, and metal fabrication operations. The market segmentation is based on cryogenic grades: cryogenic, industrial, medical/pharmaceutical, food, and research/laboratory. The expansion timelines of ASU were confirmed through primary research. We also learned about the preferences of merchants versus on-site generators, the dynamics of bulk versus packaged gas distribution, and the rates of adoption of cryogenic storage equipment.

Primary Respondent Breakdown:

By Designation: C-level Primaries (32%), Director Level (38%), Others (30%)

By Region: North America (32%), Europe (30%), Asia-Pacific (33%), Rest of World (5%)


Market Size Estimation

Global market valuation was derived through revenue mapping and production volume analysis. The methodology included:

Identification of 40+ key manufacturers across industrial gas majors (Linde, Air Liquide, Air Products, Messer, Taiyo Nippon Sanso), regional independents, and cryogenic vessel/equipment suppliers

Product mapping across cryogenic distillation systems, PSA units, liquid nitrogen grades (Cryogenic, Industrial, Medical, Food, Research), and storage/distribution formats (bulk tanks, microbulk, cylinders/dewars, on-site ASUs)

Analysis of reported and modeled annual revenues specific to liquid nitrogen portfolios, including merchant liquid sales, on-site supply contracts, and packaged gas distribution

Coverage of manufacturers and distributors representing 75-80% of global market share in 2024

Extrapolation using bottom-up (production volume × ASP by country/application) and top-down (manufacturer revenue validation) approaches to derive segment-specific valuations across coolant, refrigerant, cryopreservation agent, and inert gas applications

Integration of capacity utilization data from Air Separation Units (ASUs) and regional energy cost differentials impacting production economics

Download Free Sample

Kindly complete the form below to receive a free sample of this Report

Download PDF ×

We do not share your information with anyone. However, we may send you emails based on your report interest from time to time. You may contact us at any time to opt-out.