Linear Alkyl Benzene Market (2026 - 2035)

ID: MRFR/CnM/4616-CR 191 Pages Chitranshi Jaiswal Last Updated: October 17, 2026
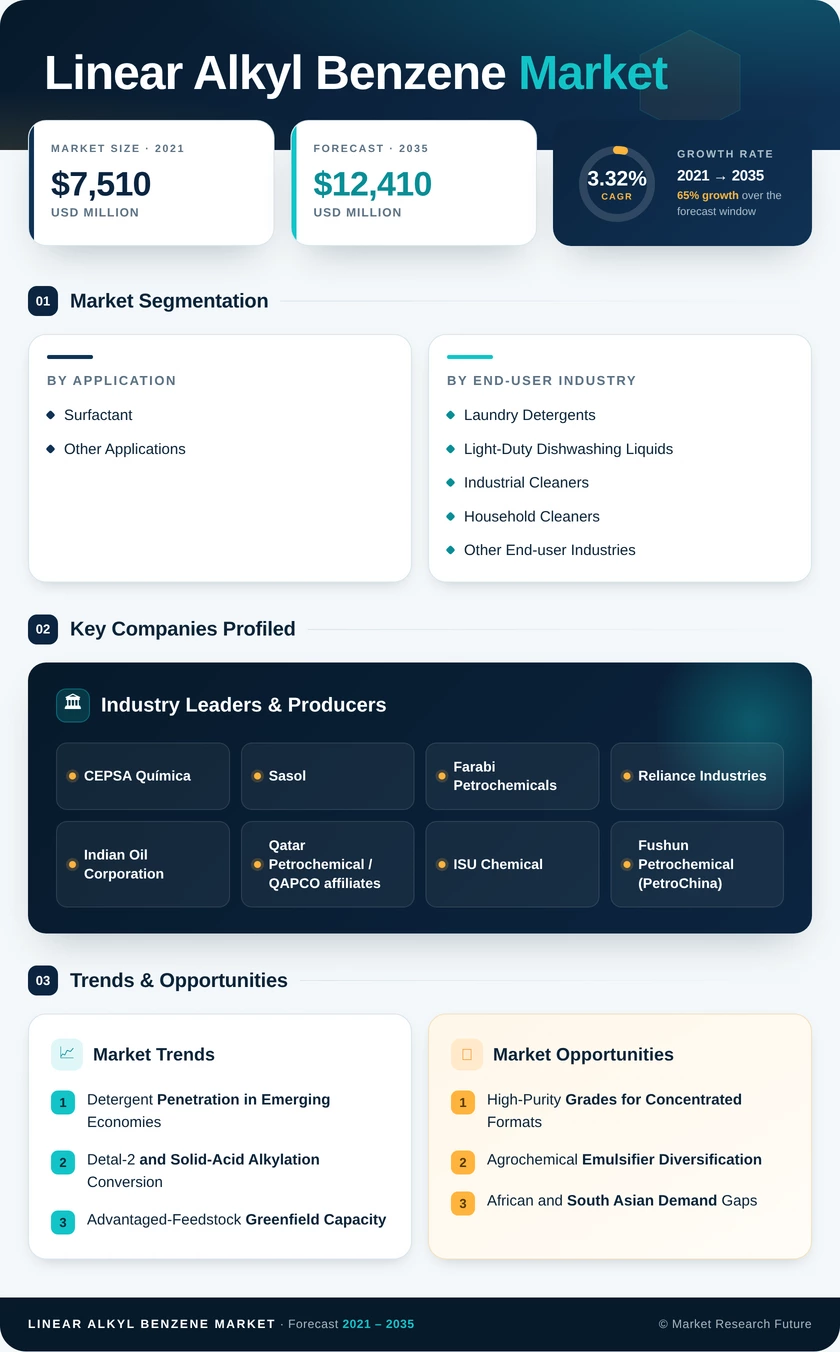
Linear Alkyl Benzene Market Research Report Information By Application (Surfactant and Other Applications), By End-User Industry (Laundry Detergents, Light-Duty Dishwashing Liquids, Industrial Cleaners, Household Cleaners, and Other End-user Industries) – Forecast Till 2035.
Linear Alkyl Benzene Market
Market Size
Forecast Period2026-2035
CAGR (2026-2035)3.32%
2025 Market SizeUSD 8,940.0 Million
2035 Market SizeUSD 12,410.0 Million
Key Players
CEPSA Química
Sasol
Farabi Petrochemicals
Reliance Industries
Indian Oil Corporation
Qatar Petrochemical / QAPCO affiliates
Opportunities
  • High-Purity Grades for Concentrated Formats
  • Agrochemical Emulsifier Diversification
  • African and South Asian Demand Gaps
  1. 1 Market Summary | |
    1. 1.1 Study Assumptions & Market Definition | |
    2. 1.2 Scope of the Study | |
    3. 1.3 Research Methodology | |
  2. 2 Key Report Takeaways | |
    1. 2.1 By Application | |
    2. 2.2 By End-User Industry | |
    3. 2.3 By Region | |
  3. 3 Market Size and Forecast (2021–2035) | |
    1. 3.1 Historical Market Size (2021–2025) | |
    2. 3.2 Current & Forecast Market Size (2026–2035) | |
    3. 3.3 Market Size by Revenue (USD Million) | |
    4. 3.4 Year-over-Year Growth Analysis | |
  4. 4 Driver Impact Analysis | |
    1. 4.1 Detergent Penetration in Emerging Economies | |
    2. 4.2 Detal-2 and Solid-Acid Alkylation Conversion | |
    3. 4.3 Advantageous-Feedstock Greenfield Capacity | |
    4. 4.4 Liquid Detergent Format Migration | |
    5. 4.5 Institutional and Hygiene Cleaning Demand | |
    6. 4.6 Cold-Water and Concentrated Formulation Shift | |
    7. 4.7 Predictive-Maintenance Driven Capacity Uplift | |
  5. 5 Restraints Impact Analysis | |
    1. 5.1 Benzene and n-Paraffin Price Volatility | |
    2. 5.2 SAF-Driven Kerosene Diversion | |
    3. 5.3 HF-Route Liability and Insurance Costs | |
    4. 5.4 Bio-Based Surfactant Substitution | |
    5. 5.5 Overcapacity and Import Price Pressure | |
  6. 6 Opportunities | |
    1. 6.1 High-Purity Grades for Concentrated Formats | |
    2. 6.2 Agrochemical Emulsifier Diversification | |
    3. 6.3 African and South Asian Demand Gaps | |
    4. 6.4 Reliability Analytics as a Commercial Service | |
    5. 6.5 Low-Carbon Product Certification | |
  7. 7 Regional Market Share and Country-Level Analysis | |
    1. 7.1 Asia-Pacific | | |
      1. 7.1.1 China | | |
      2. 7.1.2 India | | |
      3. 7.1.3 Japan | | |
      4. 7.1.4 South Korea | | |
      5. 7.1.5 Rest of Asia-Pacific | |
    2. 7.2 Middle East and Africa | | |
      1. 7.2.1 Saudi Arabia | | |
      2. 7.2.2 South Africa | | |
      3. 7.2.3 Rest of Middle East and Africa | |
    3. 7.3 Europe | | |
      1. 7.3.1 Germany | | |
      2. 7.3.2 United Kingdom | | |
      3. 7.3.3 France | | |
      4. 7.3.4 Italy | | |
      5. 7.3.5 Russia | | |
      6. 7.3.6 Rest of Europe | |
    4. 7.4 North America | | |
      1. 7.4.1 United States | | |
      2. 7.4.2 Canada | | |
      3. 7.4.3 Mexico | |
    5. 7.5 South America | | |
      1. 7.5.1 Brazil | | |
      2. 7.5.2 Argentina | | |
      3. 7.5.3 Rest of South America | |
  8. 8 Future Outlook (2026–2035) | |
    1. 8.1 Process Digitalisation and Autonomous Operations | |
    2. 8.2 Feedstock Reconfiguration and Circular Inputs | |
    3. 8.3 Sustainability Disclosure and Product Carbon Accounting | |
    4. 8.4 Supply Geography Rebalancing | |
  9. 9 Segmentation Analysis | |
    1. 9.1 By Application | | |
      1. 9.1.1 Surfactant | | |
      2. 9.1.2 Other Applications | |
    2. 9.2 By End-User Industry | | |
      1. 9.2.1 Laundry Detergents | | |
      2. 9.2.2 Light-Duty Dishwashing Liquids | | |
      3. 9.2.3 Industrial Cleaners | | |
      4. 9.2.4 Household Cleaners | | |
      5. 9.2.5 Other End-user Industries | |
  10. 10 Competitive Landscape | |
    1. 10.1 Market Share Analysis (2026) | |
    2. 10.2 Competitive Benchmarking Matrix | |
    3. 10.3 Company Profiles | | |
      1. 10.3.1 CEPSA Química | | |
      2. 10.3.2 Sasol | | |
      3. 10.3.3 Farabi Petrochemicals | | |
      4. 10.3.4 Reliance Industries | | |
      5. 10.3.5 Indian Oil Corporation | | |
      6. 10.3.6 Qatar Petrochemical / QAPCO affiliates | | |
      7. 10.3.7 ISU Chemical | | |
      8. 10.3.8 Fushun Petrochemical (PetroChina) | | |
      9. 10.3.9 Deten Química | | |
      10. 10.3.10 Honeywell UOP | | |
      11. 10.3.11 Tamimi Group / Saudi affiliates | |
  11. 11 Recent News & Developments | |
  12. 12 Report Scope and Methodology | |
    1. 12.1 Study Period & Base Year | |
    2. 12.2 Data Sources & Citations | |
    3. 12.3 Abbreviations | |
  13. 13 Detailed Sources and Citations | |
  14. 14 Frequently Asked Questions (FAQs) | | LIST OF TABLES | |
  15. TABLE 1 Global Linear Alkyl Benzene Market Size & Forecast, by Revenue (USD Million), 2021–2035 | |
  16. TABLE 2 Global Linear Alkyl Benzene Market – Year-over-Year Growth Analysis, 2021–2035 | |
  17. TABLE 3 Driver Impact Analysis – Linear Alkyl Benzene Market, 2026–2035 | |
  18. TABLE 4 Restraint Impact Analysis – Linear Alkyl Benzene Market, 2026–2035 | |
  19. TABLE 5 Global Linear Alkyl Benzene Market Size, by Region, 2021–2035 (USD Million) | |
  20. TABLE 6 Asia-Pacific Linear Alkyl Benzene Market Size, by Country, 2021–2035 (USD Million) | |
  21. TABLE 7 Middle East and Africa Linear Alkyl Benzene Market Size, by Country, 2021–2035 (USD Million) | |
  22. TABLE 8 Europe Linear Alkyl Benzene Market Size, by Country, 2021–2035 (USD Million) | |
  23. TABLE 9 North America Linear Alkyl Benzene Market Size, by Country, 2021–2035 (USD Million) | |
  24. TABLE 10 South America Linear Alkyl Benzene Market Size, by Country, 2021–2035 (USD Million) | |
  25. TABLE 11 Global Linear Alkyl Benzene Market Size, by Application, 2021–2035 (USD Million) | |
  26. TABLE 12 Global Linear Alkyl Benzene Market Size, by End-User Industry, 2021–2035 (USD Million) | |
  27. TABLE 13 Asia-Pacific Linear Alkyl Benzene Market Size, by Application, 2021–2035 (USD Million) | |
  28. TABLE 14 Asia-Pacific Linear Alkyl Benzene Market Size, by End-User Industry, 2021–2035 (USD Million) | |
  29. TABLE 15 Europe Linear Alkyl Benzene Market Size, by Application, 2021–2035 (USD Million) | |
  30. TABLE 16 Europe Linear Alkyl Benzene Market Size, by End-User Industry, 2021–2035 (USD Million) | |
  31. TABLE 17 North America Linear Alkyl Benzene Market Size, by Application, 2021–2035 (USD Million) | |
  32. TABLE 18 North America Linear Alkyl Benzene Market Size, by End-User Industry, 2021–2035 (USD Million) | |
  33. TABLE 19 Middle East and Africa Linear Alkyl Benzene Market Size, by Application, 2021–2035 (USD Million) | |
  34. TABLE 20 Middle East and Africa Linear Alkyl Benzene Market Size, by End-User Industry, 2021–2035 (USD Million) | |
  35. TABLE 21 South America Linear Alkyl Benzene Market Size, by Application, 2021–2035 (USD Million) | |
  36. TABLE 22 South America Linear Alkyl Benzene Market Size, by End-User Industry, 2021–2035 (USD Million) | |
  37. TABLE 23 Competitive Benchmarking Matrix – Linear Alkyl Benzene Market, 2026 | |
  38. TABLE 24 Company Profiles – Key Players, Linear Alkyl Benzene Market | |
  39. TABLE 25 Recent Developments & Strategic Announcements, 2023–2025 | |
  40. TABLE 26 Report Scope & Methodology Summary | |
  41. TABLE 27 Detailed Sources and Citations | | LIST OF FIGURES | |
  42. FIGURE 1 Linear Alkyl Benzene Market – Market Dynamics Overview (Drivers, Restraints, Opportunities) | |
  43. FIGURE 2 Linear Alkyl Benzene Market – Industry Value Chain Analysis | |
  44. FIGURE 3 Linear Alkyl Benzene Market – Porter's Five Forces Analysis | |
  45. FIGURE 4 Global Market Size Trend and Forecast, 2021–2035 (USD Million) | |
  46. FIGURE 5 Year-over-Year Growth Trend, 2022–2035 (%) | |
  47. FIGURE 6 Market Share by Application, 2025 vs 2035 (%) | |
  48. FIGURE 7 Market Share by End-User Industry, 2025 (%) | |
  49. FIGURE 8 Segment CAGR Comparison, 2026–2035 (%) | |
  50. FIGURE 9 Regional Market Share Distribution, 2025 (%) | |
  51. FIGURE 10 Regional CAGR Comparison, 2026–2035 (%) | |
  52. FIGURE 11 Asia-Pacific Country-Level Share Distribution, 2025 (%) | |
  53. FIGURE 12 Competitive Landscape – Estimated Revenue Share Bands, 2026 | |
  54. FIGURE 13 Feedstock Cost Structure and Margin Sensitivity Analysis | |
  55. FIGURE 14 Technology Adoption Curve – HF Route vs Solid-Acid Alkylation, 2021–2035

Segmentation Quick Reference

DimensionSub-SegmentsDominant SegmentFastest Growing Segment
By ApplicationSurfactant; Other ApplicationsSurfactant (90.4% share)Other Applications (4.87% CAGR)
By End-User IndustryLaundry Detergents; Light-Duty Dishwashing Liquids; Industrial Cleaners; Household Cleaners; Other End-user IndustriesLaundry Detergents (66.9% share)Light-Duty Dishwashing Liquids (4.19% CAGR)


Market Segmentation Overview

By Application

Sub-SegmentKey Trend
SurfactantSulfonated LAB retains cost-to-performance advantage over alcohol ethoxysulfates across household, institutional and industrial cleaning
Other ApplicationsAgrochemical emulsifiers, textile auxiliaries and water-based coatings drive faster growth from a small base


Surfactant use holds 90.4% of application volume because formulators cannot match LABSA's cost per unit of cleaning performance at commodity scale, and sulfonation assets are already installed near every major detergent hub. Other Applications grow fastest at 4.87% CAGR as agrochemical customers qualify LAB-derived emulsifiers for tank-mix stability in herbicide concentrates, a specification-led purchase that prices on performance rather than benzene indices. The two segments compete for different capacity profiles: high-purity, narrow-distribution grades serve the niche pool, while standard grades feed the surfactant bulk.

By End-User Industry

Sub-SegmentKey Trend
Laundry DetergentsPowder and liquid volume growth concentrated in India, Indonesia and Vietnam
Light-Duty Dishwashing LiquidsRural households transitioning from bar soap as piped water access expands
Industrial CleanersRetained post-pandemic sanitation protocols in healthcare, logistics and food service
Household CleanersMulti-surface and hard-surface cleaner proliferation in urban retail channels
Other End-user IndustriesTextile processing and niche oilfield formulations with long qualification cycles


Laundry detergents lead at 66.9% of volume, reflecting LABSA's role in both powder formulations with lower 2-phenyl content and liquid formulations requiring higher foam stability. Light-duty dishwashing liquids grow fastest at 4.19% CAGR because the segment starts small and benefits directly from piped-water expansion across emerging Asia. Producers are responding with flexible sulfonation capacity that switches between powder-grade and liquid-grade runs, since the two end-uses now pull in opposite specification directions and neither justifies a dedicated asset alone.




Download PDF ×

We do not share your information with anyone. However, we may send you emails based on your report interest from time to time. You may contact us at any time to opt-out.