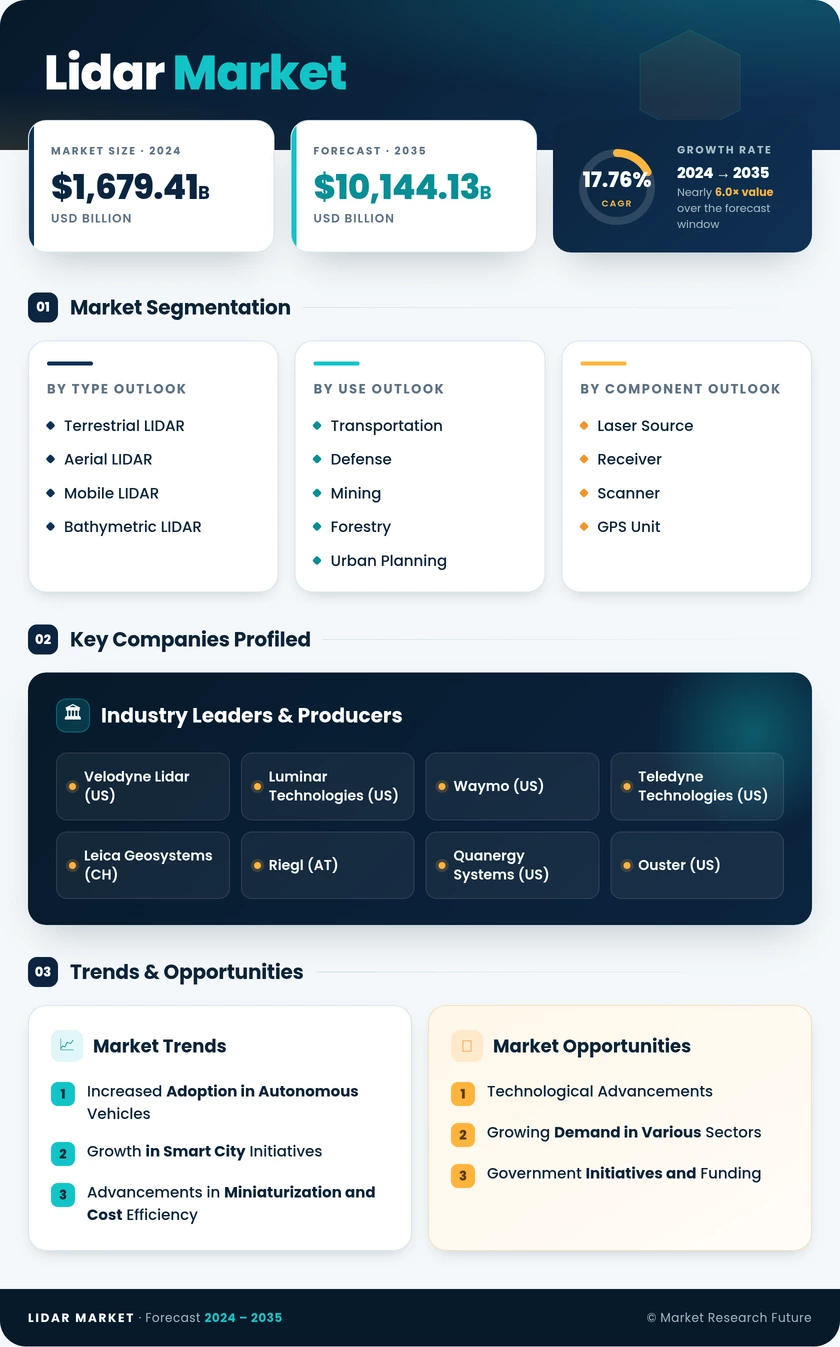
LiDAR Market (2026 – 2035)

ID: MRFR/SEM/1827-CR 108 Pages Nirmit Biswas Last Updated: November 13, 2026
LiDAR Market Size, Share and Research Report By Product/Technology (Mechanical, Solid-State), By Component (Laser Scanner, Navigation and Positioning Systems, Software and Analytics, Other Components), By Range (Short (200 m)), By Application (Corridor Mapping, ADAS and Autonomous Driving, Robotic Vehicle, Civil Engineering, Seismology, Exploration and Detection, Other Applications), By Type (Aerial, Terrestrial), By End-User Industry (Automotive, Aerospace and Defense, Energy and Utilities, Construction, Industrial and Robotics, Other End-User Industries) and By Regional (North America, Europe, South America, Asia Pacific, Middle East and Africa) - Industry Forecast to 2035.
LiDAR Market
Market Size
Forecast Period2026-2035
CAGR (2026-2035)17.60%
2025 Market SizeUSD 3.06 Billion
2035 Market SizeUSD 15.70 Billion
Key Players
Hesai Group
RoboSense Technology
Hexagon AB
Teledyne Technologies
Valeo
Trimble
Opportunities
  • Emerging-Market Geospatial and Mobility Programs
  • Perception Software and Data Services
  • Roadside and Smart-Infrastructure Sensing
  1. 1 Market Summary | |
  2. 2 Key Report Takeaways | |
    1. 2.1 By Product/Technology | |
    2. 2.2 By Component | |
    3. 2.3 By Range | |
    4. 2.4 By Application | |
    5. 2.5 By Type | |
    6. 2.6 By End-User Industry | |
    7. 2.7 By Region | |
  3. 3 Market Size and Forecast (2021–2035) | |
  4. 4 Driver Impact Analysis | |
    1. 4.1 Automotive Safety Mandates and Level 3 Approvals | |
    2. 4.2 China's Rapid Adoption of Highway and Urban NOA | |
    3. 4.3 Solid-State and SPAD Cost Curve | |
    4. 4.4 Public Investment in Elevation and Infrastructure Mapping | |
    5. 4.5 Robotics, Logistics and Industrial Automation | |
    6. 4.6 Renewable Energy and Utility Asset Monitoring | |
  5. 5 Restraints Impact Analysis | |
    1. 5.1 Cost Pressure Versus Camera–Radar Stacks | |
    2. 5.2 Geopolitical and Security Restrictions on Chinese Suppliers | |
    3. 5.3 Supplier Consolidation and Financial Distress | |
    4. 5.4 Laser Eye-Safety and Wavelength Constraints | |
    5. 5.5 Adverse Weather Performance and Compute Load | |
  6. 6 Opportunities | |
    1. 6.1 Emerging-Market Geospatial and Mobility Programs | |
    2. 6.2 Perception Software and Data Services | |
    3. 6.3 Roadside and Smart-Infrastructure Sensing | |
    4. 6.4 Warehouse, Port and Agricultural Autonomy | |
    5. 6.5 Utility Digital Twins and Climate Resilience | |
  7. 7 Regional Market Share and Country-Level Analysis | |
    1. 7.1 North America | | |
      1. 7.1.1 US | | |
      2. 7.1.2 Canada | | |
      3. 7.1.3 Mexico | |
    2. 7.2 Europe | | |
      1. 7.2.1 Germany | | |
      2. 7.2.2 UK | | |
      3. 7.2.3 France | | |
      4. 7.2.4 Italy | | |
      5. 7.2.5 Spain | | |
      6. 7.2.6 Nordic Countries | | |
      7. 7.2.7 Russia | | |
      8. 7.2.8 Rest of Europe | |
    3. 7.3 Asia-Pacific | | |
      1. 7.3.1 China | | |
      2. 7.3.2 India | | |
      3. 7.3.3 Japan | | |
      4. 7.3.4 South Korea | | |
      5. 7.3.5 ASEAN | | |
      6. 7.3.6 Rest of Asia-Pacific | |
    4. 7.4 South America | | |
      1. 7.4.1 Brazil | | |
      2. 7.4.2 Argentina | | |
      3. 7.4.3 Rest of South America | |
    5. 7.5 Middle East & Africa | | |
      1. 7.5.1 Saudi Arabia | | |
      2. 7.5.2 UAE | | |
      3. 7.5.3 South Africa | | |
      4. 7.5.4 Egypt | | |
      5. 7.5.5 Rest of MEA | |
  8. 8 Future Outlook (2026–2035) | |
    1. 8.1 AI-Native Perception and Sensor Fusion | |
    2. 8.2 FMCW and 4D Velocity Sensing | |
    3. 8.3 Software-Defined Vehicles and Platform Economics | |
    4. 8.4 Climate Resilience and Geospatial Digital Twins | |
  9. 9 Segmentation Analysis | |
    1. 9.1 By Product/Technology | | |
      1. 9.1.1 Mechanical | | |
      2. 9.1.2 Solid-State | |
    2. 9.2 By Component | | |
      1. 9.2.1 Laser Scanner | | |
      2. 9.2.2 Navigation and Positioning Systems | | |
      3. 9.2.3 Software and Analytics | | |
      4. 9.2.4 Other Components | |
    3. 9.3 By Range | | |
      1. 9.3.1 Short (200 m) | |
    4. 9.4 By Application | | |
      1. 9.4.1 Corridor Mapping | | |
      2. 9.4.2 ADAS and Autonomous Driving | | |
      3. 9.4.3 Robotic Vehicle | | |
      4. 9.4.4 Civil Engineering | | |
      5. 9.4.5 Seismology | | |
      6. 9.4.6 Exploration and Detection | | |
      7. 9.4.7 Other Applications | |
    5. 9.5 By Type | | |
      1. 9.5.1 Aerial | | |
      2. 9.5.2 Terrestrial | |
    6. 9.6 By End-User Industry | | |
      1. 9.6.1 Automotive | | |
      2. 9.6.2 Aerospace and Defense | | |
      3. 9.6.3 Energy and Utilities | | |
      4. 9.6.4 Construction | | |
      5. 9.6.5 Industrial and Robotics | | |
      6. 9.6.6 Other End-User Industries | |
  10. 10 Competitive Landscape | |
  11. 11 Recent News & Developments | |
  12. 12 Report Scope and Methodology | |
  13. 13 Detailed Sources and Citations | |
  14. 14 Frequently Asked Questions (FAQs) | | LIST OF TABLES | |
  15. TABLE 1 Global Market Size & Forecast, by Revenue (USD Billion), 2021–2035 | |
  16. TABLE 2 Year-over-Year Growth Analysis, 2021–2035 | |
  17. TABLE 3 Driver Impact Analysis | |
  18. TABLE 4 Restraints Impact Analysis | |
  19. TABLE 5 Regional Summary, by Region, 2025 | |
  20. TABLE 6 North America Market, by Country | |
  21. TABLE 7 Europe Market, by Country | |
  22. TABLE 8 Asia-Pacific Market, by Country | |
  23. TABLE 9 South America Market, by Country | |
  24. TABLE 10 Middle East & Africa Market, by Country | |
  25. TABLE 11 Market Segmentation, by Product/Technology | |
  26. TABLE 12 Market Segmentation, by Component | |
  27. TABLE 13 Market Segmentation, by Range | |
  28. TABLE 14 Market Segmentation, by Application | |
  29. TABLE 15 Market Segmentation, by Type | |
  30. TABLE 16 Market Segmentation, by End-User Industry | |
  31. TABLE 17 Competitive Benchmarking Matrix, 2025 | |
  32. TABLE 18 Report Scope and Methodology | |
  33. TABLE 19 Detailed Sources and Citations | |
  34. TABLE 20 Segmentation Quick Reference | | LIST OF FIGURES | |
  35. FIGURE 1 Market Dynamics Overview (Drivers, Restraints, Opportunities) | |
  36. FIGURE 2 Industry Value Chain Analysis | |
  37. FIGURE 3 Porter's Five Forces Analysis | |
  38. FIGURE 4 Global Market Size Trend, 2021–2035 (USD Billion) | |
  39. FIGURE 5 Market Share, by Product/Technology, 2025 | |
  40. FIGURE 6 Market Share, by Component, 2025 | |
  41. FIGURE 7 Market Share, by Range, 2025 | |
  42. FIGURE 8 Market Share, by Application, 2025 | |
  43. FIGURE 9 Market Share, by Type, 2025 | |
  44. FIGURE 10 Market Share, by End-User Industry, 2025 | |
  45. FIGURE 11 Regional Market Share, 2025 | |
  46. FIGURE 12 Competitive Landscape – Estimated Revenue Share Ranges, 2025

Segmentation Quick Reference

DimensionSub-SegmentsDominant SegmentFastest Growing Segment
By Product/TechnologyMechanical; Solid-StateSolid-State — 77.4% share (2025)Solid-State — 77.4% share (2025), segment-leading growth
By ComponentLaser Scanner; Navigation and Positioning Systems; Software and Analytics; Other ComponentsLaser Scanner — 48.3% share (2025)Software and Analytics — 20.6% CAGR (2026–2035)
By RangeShort (<100 m); Medium (100–200 m); Long (>200 m)Short (<100 m) — 51.2% share (2025)Long (>200 m) — 22.7% CAGR (2026–2035)
By ApplicationCorridor Mapping; ADAS and Autonomous Driving; Robotic Vehicle; Civil Engineering; Seismology; Exploration and Detection; Other ApplicationsCorridor Mapping — 34.9% share (2025)ADAS and Autonomous Driving — 24.3% CAGR (2026–2035)
By TypeAerial; Terrestrial (Mobile, Static)Aerial — 40.1% share (2025)Terrestrial (Mobile) — 21.5% CAGR (2026–2035)
By End-User IndustryAutomotive; Aerospace and Defense; Energy and Utilities; Construction; Industrial and Robotics; Other End-User IndustriesAutomotive — 33.6% share (2025)Industrial and Robotics — 21.9% CAGR (2026–2035)
By RegionNorth America; Europe; Asia-Pacific; South America; Middle East & AfricaAsia-Pacific — 41.5% share (2025)Asia-Pacific — 19.4% CAGR (2026–2035)


Market Segmentation Overview

By Product/Technology

Sub-SegmentKey Trend
MechanicalRetained for 360-degree, ultra-high-resolution survey and robotaxi use
Solid-StateMEMS, flash, and FMCW architectures scaling into series vehicles


Solid-State leads this dimension and also posts the strongest growth, because automakers need sensors with no rotating parts that meet 15-year durability targets. Mechanical units keep a foothold where full 360-degree coverage and maximum resolution outweigh cost. As wafer-level beam steering matures, mechanical volumes will continue to shrink toward specialist survey niches.

By Component

Sub-SegmentKey Trend
Laser ScannerEmitter–receiver integration on single chips lowers unit cost
Navigation and Positioning SystemsGNSS–IMU fusion remains mandatory for survey accuracy
Software and AnalyticsSubscription perception and calibration services expand.
Other ComponentsCleaning, heating, and optics modules gain content per vehicle.


Laser Scanner modules account for the largest share of component revenue because the emitter and receiver remain the costliest parts of every unit. Software and Analytics grows fastest as integrators charge recurring fees for detection algorithms and fleet calibration. Navigation and Positioning Systems hold steady, since survey-grade output depends on accurate GNSS and inertial fusion.

By Range

Sub-SegmentKey Trend
Short (<100 m)High-volume parking, blind-spot, and robot navigation
Medium (100–200 m)Urban driver assistance on mid-priced vehicles
Long (>200 m)Highway pilot and Level 3 at up to 130 km/h


Short (<100 m) sensors lead on volume because parking assist and warehouse robots need wide fields of view at close distances. Long (>200 m) units grow fastest, as Level 3 approvals at highway speeds require detection well beyond 200 m. Eye-safety limits at 905 nm keep 1550 nm designs competitive in the long-range tier.

By Application

Sub-SegmentKey Trend
Corridor MappingInfrastructure and climate-adaptation surveys
ADAS and Autonomous DrivingRegulatory mandates turn perception into a compliance item.
Robotic VehicleDelivery robots and robotaxi fleets
Civil EngineeringConstruction progress and as-built verification
SeismologyFault-line and landslide monitoring
Exploration and DetectionMining and resource surveys
Other ApplicationsForestry, heritage documentation, and security


Corridor Mapping remains the largest application because highway, rail, and utility agencies fund recurring surveys under public infrastructure budgets. ADAS and Autonomous Driving grow fastest as FMVSS No. 127 and UN R157 push automakers to add redundant perception. Civil Engineering and Seismology depend on centimeter-grade accuracy, keeping demand steady for high-precision instruments.

By Type

Sub-SegmentKey Trend
AerialSingle-photon sensors cut flight time for national-scale surveys
TerrestrialMobile vehicle-mounted scanning and static plant surveys.


Aerial platforms lead because one mission covers large areas for flood, forestry, and elevation programs. Within Terrestrial, mobile systems grow fastest as road agencies and HD-map providers scan networks repeatedly. Static terrestrial units remain the tool of choice for tunnels, plants, and building interiors where aircraft cannot reach.

By End-User Industry

Sub-SegmentKey Trend
AutomotiveMulti-year sourcing contracts for ADAS and Level 3
Aerospace and DefenseHigh-specification targeting and terrain sensing
Energy and UtilitiesVegetation management and renewable-site surveys
ConstructionBIM integration and progress tracking
Industrial and RoboticsAMRs, autonomous forklifts, and port automation
Other End-User IndustriesAgriculture, forestry, and retail analytics


Automotive buyers hold the largest share, and their temperature and lifecycle specifications now shape supplier roadmaps. Industrial and Robotics grows fastest as warehouses and ports deploy autonomous machines that need safety-certified compact sensors. Aerospace and Defense buys fewer units but pays premium prices for high-specification performance.


 

Download PDF ×

We do not share your information with anyone. However, we may send you emails based on your report interest from time to time. You may contact us at any time to opt-out.