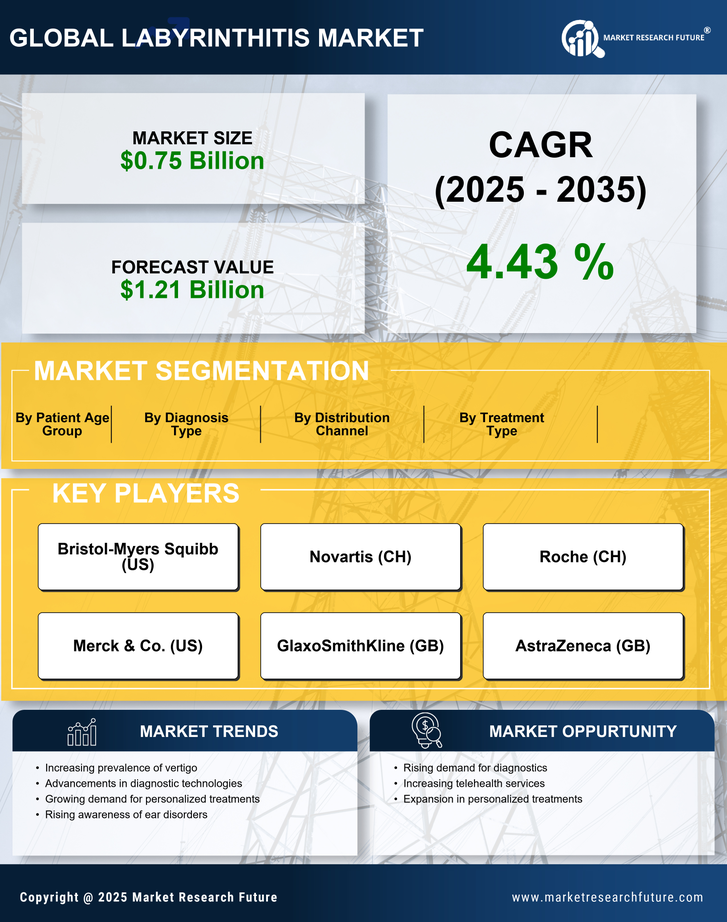
Certified Global Research Member
Isomar fd.webp Wcrc 57.webp
Key Questions Answered
  • Global Market Outlook
  • In-depth analysis of global and regional trends
  • Analyze and identify the major players in the market, their market share, key developments, etc.
  • To understand the capability of the major players based on products offered, financials, and strategies.
  • Identify disrupting products, companies, and trends.
  • To identify opportunities in the market.
  • Analyze the key challenges in the market.
  • Analyze the regional penetration of players, products, and services in the market.
  • Comparison of major players’ financial performance.
  • Evaluate strategies adopted by major players.
  • Recommendations
Why Choose Market Research Future?
  • Vigorous research methodologies for specific market.
  • Knowledge partners across the globe
  • Large network of partner consultants.
  • Ever-increasing/ Escalating data base with quarterly monitoring of various markets
  • Trusted by fortune 500 companies/startups/ universities/organizations
  • Large database of 5000+ markets reports.
  • Effective and prompt pre- and post-sales support.

Labyrinthitis Market Growth And Trends Analysis By Type (Autoimmune Labyrinthitis, Infective Labyrinthitis), Diagnosis (Blood Test, Magnetic Resonance Imaging (Mri) & Computed Tomography), And Treatment (Drug (Antibiotics), Therapy End-User - Forecast Till 2030


ID: MRFR/Pharma/3202-HCR | 110 Pages | Author: Rahul Gotadki| April 2024
Leading companies partner with us for data-driven Insights
client_1 client_2 client_3 client_4 client_5 client_6 client_7 client_8 client_9 client_10
Please fill in Business Email for Quick Response

Table of Content

1. Report Prologue

2. Market Introduction

2.1 Definition

2.2 Scope of the Study

2.2.1 Research Objective

2.2.2 Assumptions

2.2.3 Limitations

3. Research Methodology

3.1 Introduction

3.2 Primary Research

3.3 Secondary research

3.4 Market Size Estimation

4. Market Dynamics

4.1 Drivers

4.2 Restrains

4.3 Opportunities

4.4 Challenges

4.5 Macroeconomic Indicators

4.6 Technology Trends & Assessment

5. Market Factor Analysis

5.1 Porters Five Forces Analysis

5.2 Value Chain Analysis

5.3 Investment Feasibility Analysis

5.4 Pricing Analysis

6. Global Labyrinthitis Market, by Types

6.1 Introduction

6.2 Autoimmune Labyrinthitis

6.2.1 Market Estimates & Forecast, 2020-2027

6.3 Infective Labyrinthitis

6.3.1 Market Estimates & Forecast, 2020-2027

6.4 Other

6.4.1 Market Estimates & Forecast, 2020-2027

7. Global Labyrinthitis Market, by Diagnosis

7.1 Introduction

7.2 Physical Examination

7.2.1 Market Estimates & Forecast, 2020-2027

7.3 Blood Test

7.3.1 Market Estimates & Forecast, 2020-2027

7.4 Magnetic Resonance Imaging and Computed Tomography

7.4.1 Market Estimates & Forecast, 2020-2027

7.4 Electroencephalogram (EEG) and Electronystagmography (ENG)

7.4.1 Market Estimates & Forecast, 2020-2027

7.5 Electroencephalogram (EEG) and Electronystagmography (ENG)

7.5.1 Market Estimates & Forecast, 2020-2027

8. Global Labyrinthitis Market, by Treatment

8.1 Introduction

8.2 Drugs

8.2.1 Market Estimates & Forecast, 2020-2027

8.3 Therapy

8.3.1 Market Estimates & Forecast, 2020-2027

8.4 Others

8.4.1 Market Estimates & Forecast, 2020-2027

9. Global Labyrinthitis Market, by End User

9.1 Introduction

9.2 Hospitals & Clinics

9.2.1 Market Estimates & Forecast, 2020-2027

9.3 Academic and Research Institutes

9.3.1 Market Estimates & Forecast, 2020-2027

9.4 Others

9.4.1 Market Estimates & Forecast, 2020-2027

10. Global Labyrinthitis Market, by Region

10.1 Introduction

10.2 Americas

10.2.1 North America

10.2.1.1 US

10.2.1.2 Canada

10.2.2 South America

10.3 Europe

10.3.1 Western Europe

10.3.1.1 Germany

10.3.1.2 France

10.3.1.3 UK

10.3.1.4 Italy

10.3.1.5 Spain

10.3.1.6 Rest of Western Europe

10.3.2 Eastern Europe

10.4 Asia Pacific

10.4.1 Japan

10.4.2 China

10.4.3 India

10.4.4 Australia

10.4.5 Republic of Korea

10.4.6 Rest of Asia Pacific

10.5 The Middle East & Africa

10.5.1 United Arab Emirates

10.5.2 Saudi Arabia

10.5.3 Oman

10.5.4 Kuwait

10.5.5 Qatar

10.5.6 Rest of the Middle East & Africa

11 Company Landscape

11.1 Introduction

11.2 Market Share Analysis

11.3 Key Development & Strategies

11.3.1 Key Developments

12 Company Profiles

12.1 Merck & Co., Inc.

12.1.1 Overview

12.1.2 Product Overview

12.1.3 Financials

12.1.4 Key Developments

12.2 Sanofi S.A.

12.2.1 Overview

12.2.2 Product Overview

12.2.3 Financials

12.2.4 Key Developments

12.3 Teva Pharmaceutical Industries Ltd.

12.3.1 Overview

12.3.2 Product Overview

12.3.3 Financials

12.3.4 Key Development

12.4 Mylan Pharms Inc.,

12.4.1 Overview

12.4.2 Product Overview

12.4.3 Financials

12.4.4 Key Development

12.5 Eli Lilly and Company

12.5.1 Overview

12.5.2 Product Overview

12.5.3 Financials

12.5.4 Key Development

12.6 Sun Pharmaceutical Industries Ltd.

12.6.1 Overview

12.6.2 Product Overview

12.6.3 Financials

12.6.4 Key Development

12.7 Shandong Taihua Bio &Tech Co.

12.7.1 Overview

12.7.2 Product Overview

12.7.3 Financials

12.7.4 Key Development

12.8 Cipla Inc.

12.8.1 Overview

12.8.2 Product Overview

12.8.3 Financials

12.8.4 Key Development

12.9 Others

12.9.1 Overview

12.9.2 Product Overview

12.9.3 Financials

12.9.4 Key Development

13 MRFR Conclusion

13.1 Key Findings

13.1.1 From CEO’s View Point

13.1.2 Unmet Needs of the Market

13.2 Key Companies to Watch

13.3 Prediction of Labyrinthitis Treatment Industry

14 Appendix

List of Tables

TABLE 1 GLOBAL LABYRINTHITIS MARKET, BY TYPES, 2020-2027 (USD MILLION)

TABLE 2 AUTOIMMUNE LABYRINTHITIS FOR LABYRINTHITIS MARKET, BY REGION, 2020-2027 (USD MILLION)

TABLE 3 INFECTIVE LABYRINTHITIS FOR LABYRINTHITIS MARKET, BY REGION 2020-2027 (USD

MILLION)

TABLE 4 OTHER MARKET, BY REGION 2020-2027 (USD MILLION)

TABLE 5 OTHER FOR LABYRINTHITIS MARKET, BY REGION 2020-2027 (USD MILLION)

TABLE 6 GLOBAL LABYRINTHITIS MARKET, BY DIAGNOSIS, 2020-2027 (USD MILLION)

TABLE 7 PHYSICAL EXAMINATION FOR LABYRINTHITIS MARKET, BY REGION, 2020-2027 (USD MILLION)

TABLE 8 BLOOD TEST FOR LABYRINTHITIS MARKET, BY REGION 2020-2027 (USD MILLION)

TABLE 9 MAGNETIC RESONANCE IMAGING AND COMPUTED TOMOGRAPHY FOR LABYRINTHITIS MARKET, BY REGION 2020-2027 (USD MILLION)

TABLE 10 ELECTROENCEPHALOGRAM (EEG) AND ELECTRONYSTAGMOGRAPHY (ENG) FOR LABYRINTHITIS MARKET, BY REGION 2020-2027 (USD MILLION)

TABLE 11 OTHER FOR LABYRINTHITIS MARKET, BY REGION 2020-2027 (USD MILLION)

TABLE 12 GLOBAL LABYRINTHITIS MARKET, BY TREATMENT, 2020-2027 (USD MILLION)

TABLE 13 DRUGS FOR LABYRINTHITIS MARKET, BY REGION, 2020-2027 (USD MILLION)

TABLE 14 THERAPY FOR LABYRINTHITIS MARKET, BY REGION 2020-2027 (USD MILLION)

TABLE 15 OTHERS FOR LABYRINTHITIS MARKET, BY REGION 2020-2027 (USD MILLION)

TABLE 16 GLOBAL LABYRINTHITIS MARKET, BY END USER, 2020-2027 (USD MILLION)

TABLE 17 NORTH AMERICA LABYRINTHITIS MARKET, BY COUNTRY 2020-2027 (USD MILLION)

TABLE 18 NORTH AMERICA LABYRINTHITIS MARKET, BY TYPES 2020-2027 (USD MILLION)

TABLE 19 NORTH AMERICA LABYRINTHITIS MARKET, BY DIAGNOSIS 2020-2027 (USD MILLION)

TABLE 20 NORTH AMERICA LABYRINTHITIS MARKET, BY TREATMENT 2020-2027 (USD MILLION)

TABLE 21 NORTH AMERICA LABYRINTHITIS MARKET, BY END USER, 2020-2027 (USD MILLION)

TABLE 22 NORTH AMERICA LABYRINTHITIS MARKET BY REGION 2020-2027 (USD MILLION

TABLE 23 EUROPE LABYRINTHITIS MARKET BY COUNTRY 2020-2027 (USD MILLION)

TABLE 24 EUROPE LABYRINTHITIS MARKET, BY TYPES 2020-2027 (USD MILLION)

TABLE 25 EUROPE LABYRINTHITIS MARKET, BY DIAGNOSIS 2020-2027 (USD MILLION)

TABLE 26 EUROPE LABYRINTHITIS MARKET, BY TREATMENT 2020-2027 (USD MILLION)

TABLE 27 EUROPE LABYRINTHITIS MARKET, BY END USER, 2020-2027 (USD MILLION)

TABLE 28 EUROPE LABYRINTHITIS MARKET, BY REGION 2020-2027 (USD MILLION)

TABLE 29 ASIA PACIFIC LABYRINTHITIS MARKET BY COUNTRY 2020-2027 (USD MILLION)

TABLE 30 ASIA PACIFIC LABYRINTHITIS MARKET, BY TYPES 2020-2027 (USD MILLION)

TABLE 31 ASIA PACIFIC LABYRINTHITIS MARKET, BY DIAGNOSIS 2020-2027 (USD MILLION)

TABLE 32 ASIA PACIFIC LABYRINTHITIS MARKET, BY TREATMENT 2020-2027 (USD MILLION)

TABLE 33 ASIA PACIFIC LABYRINTHITIS MARKET, BY END USER, 2020-2027 (USD MILLION)

TABLE 34 ASIA PACIFIC LABYRINTHITIS MARKET, BY REGION 2020-2027 (USD MILLION)

TABLE 35 MIDDLE EAST & AFRICA LABYRINTHITIS MARKET, BY REGION 2020-2027 (USD MILLION)

TABLE 36 MIDDLE EAST & AFRICA LABYRINTHITIS MARKET BY COUNTRY 2020-2027 (USD MILLION)

TABLE 37 MIDDLE EAST & AFRICA LABYRINTHITIS MARKET, BY TYPES 2020-2027 (USD MILLION)

TABLE 38 MIDDLE EAST & AFRICA LABYRINTHITIS MARKET, BY DIAGNOSIS 2020-2027 (USD MILLION)

TABLE 39 MIDDLE EAST & AFRICA LABYRINTHITIS MARKET, BY TREATMENT 2020-2027 (USD MILLION)

TABLE 40 MIDDLE EAST & AFRICA LABYRINTHITIS MARKET, BY END USER, 2020-2027 (USD MILLION)

TABLE 41 MIDDLE EAST & AFRICA LABYRINTHITIS MARKET, BY REGION 2020-2027 (USD MILLION)

List of Figures

FIGURE 1 RESEARCH PROCESS

FIGURE 2 MARKET DYNAMICS FOR GLOBAL LABYRINTHITIS MARKET

FIGURE 3 GLOBAL LABYRINTHITIS MAKRET, BY SEGMENT, 2020

FIGURE 4 GLOBAL LABYRINTHITIS SUCCESS MARKET, BY REGION

FIGURE 5 GLOBAL LABYRINTHITIS MARKET SHARE, BY TYPES 2020

FIGURE 6 GLOBAL LABYRINTHITIS MARKET SHARE, BY DIAGNOSIS 2020

FIGURE 7 GLOBAL LABYRINTHITIS MARKET SHARE, BY TREATMENT 2020

FIGURE 8 GLOBAL LABYRINTHITIS MARKET SHARE, BY END USER, 2020

FIGURE 9 GLOBAL LABYRINTHITIS MARKET SHARE, 2020

FIGURE 10 GLOBAL LABYRINTHITIS MARKET SHARE, BY REGION, 2020

FIGURE 11 NORTH AMERICA LABYRINTHITIS MARKET SHARE, BY COUNTRY, 2020

FIGURE 12 EUROPE LABYRINTHITIS MARKET SHARE, BY COUNTRY, 2020

FIGURE 13 ASIA PACIFIC LABYRINTHITIS MARKET SHARE, BY COUNTRY, 2020

FIGURE 14 MIDDLE EAST & AFRICA LABYRINTHITIS MARKET, BY REGION, 2020

FIGURE 15 GLOBAL LABYRINTHITIS MARKET: COMPANY SHARE ANALYSIS, 2020 (%)

FIGURE 16 PFIZER INC.: KEY FINANCIALS

FIGURE 17 PFIZER INC.: SEGMENTAL REVENUE

FIGURE 18 PFIZER INC.: GEOGRAPHICAL REVENUE

FIGURE 19 NOVARTIS AG: KEY FINANCIALS

FIGURE 20 NOVARTIS AG: SEGMENTAL REVENUE

FIGURE 21 NOVARTIS AG: GEOGRAPHICAL REVENUE

FIGURE 22 MERCK & CO.: KEY FINANCIALS

FIGURE 23 MERCK & CO.: SEGMENTAL REVENUE

FIGURE 24 MERCK & CO.: GEOGRAPHICAL REVENUE

FIGURE 25 ELI LILLY AND COMPANY: KEY FINANCIALS

FIGURE 26 ELI LILLY AND COMPANY: SEGMENTAL REVENUE

FIGURE 27 ELI LILLY AND COMPANY: GEOGRAPHICAL REVENUE

FIGURE 28 SANOFI S.A.: FINANCIAL REVENUE

FIGURE 29 SANOFI S.A.: SEGMENTAL REVENUE

FIGURE 30 SANOFI S.A.: GEOGRPAHICAL REVENUE

Purchase Option
Single User $ 4,950
Multiuser License $ 5,950
Enterprise User $ 7,250
Compare Licenses
Tailored for You
  • Dedicated Research on any specifics segment or region.
  • Focused Research on specific players in the market.
  • Custom Report based only on your requirements.
  • Flexibility to add or subtract any chapter in the study.
  • Historic data from 2014 and forecasts outlook till 2040.
  • Flexibility of providing data/insights in formats (PDF, PPT, Excel).
  • Provide cross segmentation in applicable scenario/markets.