Kaolin Market (2026 - 2035)

ID: MRFR/CnM/4409-CR 150 Pages Anshula Mandaokar Last Updated: September 18, 2026
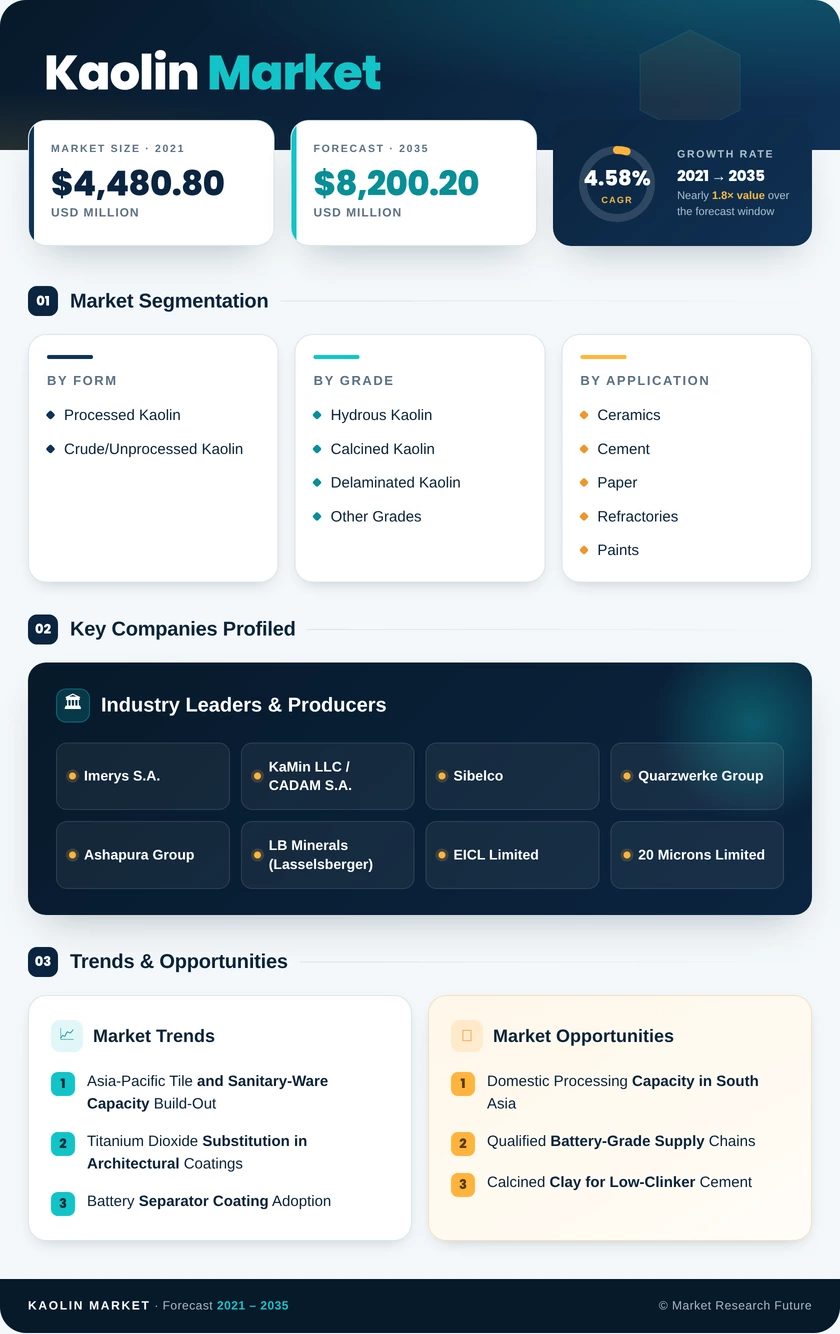
Kaolin Market Research Report Information By Form (Processed Kaolin and Crude/Unprocessed Kaolin), By Grade (Hydrous Kaolin, Calcined Kaolin, Delaminated Kaolin, and Other Grades), and By Application (Ceramics, Cement, Paper, Refractories, Paints and Coatings, Plastics, and Other Applications) – Forecast Till 2035
Kaolin Market
Market Size
Forecast Period2026-2035
CAGR (2026-2035)4.58%
2025 Market SizeUSD 5,240.0 Million
2035 Market SizeUSD 8,200.2 Million
Key Players
Imerys S.A.
KaMin LLC / CADAM S.A.
Sibelco
Quarzwerke Group
Ashapura Group
LB Minerals
Opportunities
  • Domestic Processing Capacity in South Asia
  • Qualified Battery-Grade Supply Chains
  • Calcined Clay for Low-Clinker Cement
  1. 1 Market Summary | |
    1. 1.1 Study Assumptions & Market Definition | |
    2. 1.2 Scope of the Study | |
    3. 1.3 Research Methodology | |
  2. 2 Key Report Takeaways | |
    1. 2.1 By Form | |
    2. 2.2 By Grade | |
    3. 2.3 By Application | |
    4. 2.4 By Region | |
  3. 3 Market Size and Forecast (2021–2035) | |
    1. 3.1 Historical Market Size (2021–2025) | |
    2. 3.2 Current & Forecast Market Size (2026–2035) | |
    3. 3.3 Year-over-Year Growth Analysis | |
  4. 4 Driver Impact Analysis | |
    1. 4.1 Asia-Pacific Tile and Sanitary-Ware Capacity Build-Out | |
    2. 4.2 Titanium Dioxide Substitution in Architectural Coatings | |
    3. 4.3 Battery Separator Coating Adoption | |
    4. 4.4 Beneficiation and Calcination Capacity Investment | |
    5. 4.5 Calcined Pozzolan Use Under Green-Building Codes | |
    6. 4.6 Specialty and Barrier Packaging Demand | |
    7. 4.7 Private-Equity Recapitalization of Mineral Assets | |
  5. 5 Restraints Impact Analysis | |
    1. 5.1 Structural Decline in Graphic Paper Demand | |
    2. 5.2 Energy Cost Inflation for Calcination | |
    3. 5.3 Ground Calcium Carbonate Substitution | |
    4. 5.4 Permitting and Effluent Compliance Delays | |
    5. 5.5 Bulk Freight and Logistics Volatility | |
  6. 6 Opportunities | |
    1. 6.1 Domestic Processing Capacity in South Asia | |
    2. 6.2 Qualified Battery-Grade Supply Chains | |
    3. 6.3 Calcined Clay for Low-Clinker Cement | |
    4. 6.4 Tolling and Specialty Service Models | |
    5. 6.5 Digital Traceability and Grade Data Monetization | |
  7. 7 Regional Market Share and Country-Level Analysis | |
    1. 7.1 North America | | |
      1. 7.1.1 United States | | |
      2. 7.1.2 Canada | |
    2. 7.2 Europe | | |
      1. 7.2.1 Germany | | |
      2. 7.2.2 United Kingdom | | |
      3. 7.2.3 France | | |
      4. 7.2.4 Rest of Europe | |
    3. 7.3 Asia-Pacific | | |
      1. 7.3.1 China | | |
      2. 7.3.2 India | | |
      3. 7.3.3 Japan | | |
      4. 7.3.4 South Korea | | |
      5. 7.3.5 Rest of Asia-Pacific | |
    4. 7.4 South America | | |
      1. 7.4.1 Brazil | | |
      2. 7.4.2 Rest of South America | |
    5. 7.5 Middle East & Africa | | |
      1. 7.5.1 Saudi Arabia | | |
      2. 7.5.2 South Africa | | |
      3. 7.5.3 Rest of Middle East & Africa | |
  8. 8 Future Outlook (2026–2035) | |
    1. 8.1 Beneficiation Automation and Process Analytics | |
    2. 8.2 Energy Transition in Thermal Processing | |
    3. 8.3 Clinker Substitution at Scale | |
    4. 8.4 Supply Chain Resilience and Sourcing Policy | |
  9. 9 Segmentation Analysis | |
    1. 9.1 By Form | | |
      1. 9.1.1 Processed Kaolin | | |
      2. 9.1.2 Crude/Unprocessed Kaolin | |
    2. 9.2 By Grade | | |
      1. 9.2.1 Hydrous Kaolin | | |
      2. 9.2.2 Calcined Kaolin | | |
      3. 9.2.3 Delaminated Kaolin | | |
      4. 9.2.4 Other Grades | |
    3. 9.3 By Application | | |
      1. 9.3.1 Ceramics | | |
      2. 9.3.2 Cement | | |
      3. 9.3.3 Paper | | |
      4. 9.3.4 Refractories | | |
      5. 9.3.5 Paints and Coatings | | |
      6. 9.3.6 Plastics | | |
      7. 9.3.7 Other Applications | |
  10. 10 Competitive Landscape | |
    1. 10.1 Market Share Analysis (2026) | |
    2. 10.2 Competitive Benchmarking Matrix | |
    3. 10.3 Company Profiles | |
  11. 11 Recent News & Developments | |
  12. 12 Report Scope and Methodology | |
  13. 13 Detailed Sources and Citations | |
  14. 14 Frequently Asked Questions | | LIST OF TABLES | |
  15. TABLE 1 Global Kaolin Market Size & Forecast (USD Million), 2021–2035 | |
  16. TABLE 2 Global Kaolin Market — Year-over-Year Growth Analysis, 2021–2035 | |
  17. TABLE 3 Driver Impact Analysis Matrix, 2026–2035 | |
  18. TABLE 4 Restraint Impact Analysis Matrix, 2026–2035 | |
  19. TABLE 5 Global Kaolin Market Size, by Region (USD Million), 2021–2035 | |
  20. TABLE 6 North America Kaolin Market Size, by Country, 2021–2035 | |
  21. TABLE 7 Europe Kaolin Market Size, by Country, 2021–2035 | |
  22. TABLE 8 Asia-Pacific Kaolin Market Size, by Country, 2021–2035 | |
  23. TABLE 9 South America Kaolin Market Size, by Country, 2021–2035 | |
  24. TABLE 10 Middle East & Africa Kaolin Market Size, by Country, 2021–2035 | |
  25. TABLE 11 Global Kaolin Market Size, by Form, 2021–2035 | |
  26. TABLE 12 Global Kaolin Market Size, by Grade, 2021–2035 | |
  27. TABLE 13 Global Kaolin Market Size, by Application, 2021–2035 | |
  28. TABLE 14 Competitive Benchmarking Matrix, 2026 | |
  29. TABLE 15 Recent Developments & Strategic Announcements, 2023–2025 | |
  30. TABLE 16 Report Scope & Methodology Summary | |
  31. TABLE 17 Detailed Sources and Citations Index | | LIST OF FIGURES | |
  32. FIGURE 1 Kaolin Market Dynamics — Drivers, Restraints, and Opportunities | |
  33. FIGURE 2 Industry Value Chain Analysis — Mining to Downstream Application | |
  34. FIGURE 3 Porter's Five Forces Analysis | |
  35. FIGURE 4 Global Market Size Trend and Forecast, 2021–2035 | |
  36. FIGURE 5 Market Share by Form, 2025 | |
  37. FIGURE 6 Market Share by Grade, 2025 | |
  38. FIGURE 7 Market Share by Application, 2025 | |
  39. FIGURE 8 Regional Share Distribution, 2025 | |
  40. FIGURE 9 Asia-Pacific Country-Level Share Split, 2025 | |
  41. FIGURE 10 Competitive Landscape — Estimated Revenue Share Positioning, 2026

Segmentation Quick Reference

DimensionSub-SegmentsDominant SegmentFastest Growing Segment
By FormProcessed Kaolin; Crude/Unprocessed KaolinProcessed Kaolin (65.2% share, 2025)Crude/Unprocessed Kaolin (5.23% CAGR)
By GradeHydrous Kaolin; Calcined Kaolin; Delaminated Kaolin; Other GradesHydrous Kaolin (51.6% share, 2025)Calcined Kaolin (5.13% CAGR)
By ApplicationCeramics; Cement; Paper; Refractories; Paints and Coatings; Plastics; Other ApplicationsCeramics (37.4% share, 2025)Paints and Coatings (5.05% CAGR)


Market Segmentation Overview

By Form

Sub-SegmentKey Trend
Processed KaolinMulti-stage separation and spray drying lock in premium end-use qualification
Crude/Unprocessed KaolinEmerging-market buyers integrate backward to secure feedstock


Processed Kaolin leads because ceramic, packaging, and battery buyers write brightness and iron limits into purchase specifications that raw clay cannot meet without beneficiation. Crude/Unprocessed Kaolin grows faster, driven by South Asian and Southeast Asian producers who mine abundant reserves but lack processing lines, and by cement and brick buyers who tolerate wider variability. The commercial spread between the two now exceeds three times on a per-ton basis, which is exactly why processing capital keeps flowing toward the crude side of the chain.

By Grade

Sub-SegmentKey Trend
Hydrous KaolinVolume filler base under carbonate substitution pressure
Calcined KaolinBrightness and thermal stability unlock coatings and separator demand
Delaminated KaolinPlatelet geometry commands premiums in barrier packaging
Other GradesSurface-treated and airfloat specialties serve narrow formulations


Hydrous Kaolin retains the largest share because it remains the default filler across paper, cement, and general ceramic bodies, but it absorbs the bulk of carbonate substitution in digital-print grades. Calcined Kaolin grows fastest, since dehydroxylation lifts brightness into the 90–95% range that pigment-extension and lithium-ion separator specifications demand. Delaminated Kaolin sits between them, defended by platelet coverage performance that competing extenders cannot replicate at equivalent cost.

By Application

Sub-SegmentKey Trend
CeramicsTile and sanitary-ware capacity additions anchor structural demand
CementLow-clinker standards open a large-volume outlet for calcined feed
PaperPackaging and filtration grades offset graphic decline
RefractoriesDemand tracks blast-furnace and kiln relining cycles
Paints and CoatingsPigment extension reduces titanium dioxide loadings
PlasticsReinforcement and cable-compound performance sustain niche volumes
Other ApplicationsCosmetics, rubber, agriculture, and filtration diversify offtake


Ceramics holds the leading position because clay is a body constituent rather than an additive, making it non-substitutable in tile and sanitary-ware manufacture — and Asian capacity additions keep that base expanding. Paints and Coatings grows fastest as formulators replace 12–18% of pigment volume with calcined grades while holding opacity within specification. Paper still ranks second on share but delivers negative incremental volume as graphic machines close, leaving packaging and filtration grades to cushion the decline.




Download PDF ×

We do not share your information with anyone. However, we may send you emails based on your report interest from time to time. You may contact us at any time to opt-out.