Request Free Sample ×

Kindly complete the form below to receive a free sample of this Report

* Please use a valid business email

Leading companies partner with us for data-driven Insights

clients tt-cursor
Hero Background

Japan Veterinary Laboratory Testing Market

ID: MRFR/HC/48999-HCR
200 Pages
Rahul Gotadki
Last Updated: April 24, 2026

Japan Veterinary Laboratory Testing Market Research Report: Size, Share, Trend Analysis By Animal Type (Companion, Livestock Animals), By Technology (Clinical Biochemistry, Molecular Diagnostics, Others) and By Product (Consumables, Instruments) - Growth Outlook & Industry Forecast 2025 To 2035

Share:
Download PDF ×

We do not share your information with anyone. However, we may send you emails based on your report interest from time to time. You may contact us at any time to opt-out.

Japan Veterinary Laboratory Testing Market Infographic
Purchase Options
  1. 1 SECTION I: EXECUTIVE SUMMARY AND KEY HIGHLIGHTS
    1. 1.1 EXECUTIVE SUMMARY
      1. 1.1.1 Market Overview
      2. 1.1.2 Key Findings
      3. 1.1.3 Market Segmentation
      4. 1.1.4 Competitive Landscape
      5. 1.1.5 Challenges and Opportunities
      6. 1.1.6 Future Outlook
  2. 2 SECTION II: SCOPING, METHODOLOGY AND MARKET STRUCTURE
    1. 2.1 MARKET INTRODUCTION
      1. 2.1.1 Definition
      2. 2.1.2 Scope of the study
        1. 2.1.2.1 Research Objective
        2. 2.1.2.2 Assumption
        3. 2.1.2.3 Limitations
    2. 2.2 RESEARCH METHODOLOGY
      1. 2.2.1 Overview
      2. 2.2.2 Data Mining
      3. 2.2.3 Secondary Research
      4. 2.2.4 Primary Research
        1. 2.2.4.1 Primary Interviews and Information Gathering Process
        2. 2.2.4.2 Breakdown of Primary Respondents
      5. 2.2.5 Forecasting Model
      6. 2.2.6 Market Size Estimation
        1. 2.2.6.1 Bottom-Up Approach
        2. 2.2.6.2 Top-Down Approach
      7. 2.2.7 Data Triangulation
      8. 2.2.8 Validation
  3. 3 SECTION III: QUALITATIVE ANALYSIS
    1. 3.1 MARKET DYNAMICS
      1. 3.1.1 Overview
      2. 3.1.2 Drivers
      3. 3.1.3 Restraints
      4. 3.1.4 Opportunities
    2. 3.2 MARKET FACTOR ANALYSIS
      1. 3.2.1 Value chain Analysis
      2. 3.2.2 Porter's Five Forces Analysis
        1. 3.2.2.1 Bargaining Power of Suppliers
        2. 3.2.2.2 Bargaining Power of Buyers
        3. 3.2.2.3 Threat of New Entrants
        4. 3.2.2.4 Threat of Substitutes
        5. 3.2.2.5 Intensity of Rivalry
      3. 3.2.3 COVID-19 Impact Analysis
        1. 3.2.3.1 Market Impact Analysis
        2. 3.2.3.2 Regional Impact
        3. 3.2.3.3 Opportunity and Threat Analysis
  4. 4 SECTION IV: QUANTITATIVE ANALYSIS
    1. 4.1 Industrial Automation & Equipment, BY Animal Type (USD Million)
      1. 4.1.1 Companion Animals
      2. 4.1.2 Livestock Animals
    2. 4.2 Industrial Automation & Equipment, BY Technology (USD Million)
      1. 4.2.1 Clinical Biochemistry
      2. 4.2.2 Immunodiagnostics
      3. 4.2.3 Hematology
      4. 4.2.4 Molecular Diagnostics
      5. 4.2.5 Urinalysis
    3. 4.3 Industrial Automation & Equipment, BY Product (USD Million)
      1. 4.3.1 Consumables
      2. 4.3.2 Instruments
    4. 4.4 Industrial Automation & Equipment, BY End User (USD Million)
      1. 4.4.1 Veterinary Hospitals & Clinics
      2. 4.4.2 In-House Testing
      3. 4.4.3 Research Institutes
      4. 4.4.4 Diagnostic Laboratories
  5. 5 SECTION V: COMPETITIVE ANALYSIS
    1. 5.1 Competitive Landscape
      1. 5.1.1 Overview
      2. 5.1.2 Competitive Analysis
      3. 5.1.3 Market share Analysis
      4. 5.1.4 Major Growth Strategy in the Industrial Automation & Equipment
      5. 5.1.5 Competitive Benchmarking
      6. 5.1.6 Leading Players in Terms of Number of Developments in the Industrial Automation & Equipment
      7. 5.1.7 Key developments and growth strategies
        1. 5.1.7.1 New Product Launch/Service Deployment
        2. 5.1.7.2 Merger & Acquisitions
        3. 5.1.7.3 Joint Ventures
      8. 5.1.8 Major Players Financial Matrix
        1. 5.1.8.1 Sales and Operating Income
        2. 5.1.8.2 Major Players R&D Expenditure. 2023
    2. 5.2 Company Profiles
      1. 5.2.1 Idexx Laboratories (US)
        1. 5.2.1.1 Financial Overview
        2. 5.2.1.2 Products Offered
        3. 5.2.1.3 Key Developments
        4. 5.2.1.4 SWOT Analysis
        5. 5.2.1.5 Key Strategies
      2. 5.2.2 Zoetis (US)
        1. 5.2.2.1 Financial Overview
        2. 5.2.2.2 Products Offered
        3. 5.2.2.3 Key Developments
        4. 5.2.2.4 SWOT Analysis
        5. 5.2.2.5 Key Strategies
      3. 5.2.3 Neogen Corporation (US)
        1. 5.2.3.1 Financial Overview
        2. 5.2.3.2 Products Offered
        3. 5.2.3.3 Key Developments
        4. 5.2.3.4 SWOT Analysis
        5. 5.2.3.5 Key Strategies
      4. 5.2.4 Virbac (FR)
        1. 5.2.4.1 Financial Overview
        2. 5.2.4.2 Products Offered
        3. 5.2.4.3 Key Developments
        4. 5.2.4.4 SWOT Analysis
        5. 5.2.4.5 Key Strategies
      5. 5.2.5 Heska Corporation (US)
        1. 5.2.5.1 Financial Overview
        2. 5.2.5.2 Products Offered
        3. 5.2.5.3 Key Developments
        4. 5.2.5.4 SWOT Analysis
        5. 5.2.5.5 Key Strategies
      6. 5.2.6 Thermo Fisher Scientific (US)
        1. 5.2.6.1 Financial Overview
        2. 5.2.6.2 Products Offered
        3. 5.2.6.3 Key Developments
        4. 5.2.6.4 SWOT Analysis
        5. 5.2.6.5 Key Strategies
      7. 5.2.7 Randox Laboratories (GB)
        1. 5.2.7.1 Financial Overview
        2. 5.2.7.2 Products Offered
        3. 5.2.7.3 Key Developments
        4. 5.2.7.4 SWOT Analysis
        5. 5.2.7.5 Key Strategies
      8. 5.2.8 Boehringer Ingelheim (DE)
        1. 5.2.8.1 Financial Overview
        2. 5.2.8.2 Products Offered
        3. 5.2.8.3 Key Developments
        4. 5.2.8.4 SWOT Analysis
        5. 5.2.8.5 Key Strategies
      9. 5.2.9 MediVet (AU)
        1. 5.2.9.1 Financial Overview
        2. 5.2.9.2 Products Offered
        3. 5.2.9.3 Key Developments
        4. 5.2.9.4 SWOT Analysis
        5. 5.2.9.5 Key Strategies
    3. 5.3 Appendix
      1. 5.3.1 References
      2. 5.3.2 Related Reports
  6. 6 LIST OF FIGURES
    1. 6.1 MARKET SYNOPSIS
    2. 6.2 JAPAN MARKET ANALYSIS BY ANIMAL TYPE
    3. 6.3 JAPAN MARKET ANALYSIS BY TECHNOLOGY
    4. 6.4 JAPAN MARKET ANALYSIS BY PRODUCT
    5. 6.5 JAPAN MARKET ANALYSIS BY END USER
    6. 6.6 KEY BUYING CRITERIA OF INDUSTRIAL AUTOMATION & EQUIPMENT
    7. 6.7 RESEARCH PROCESS OF MRFR
    8. 6.8 DRO ANALYSIS OF INDUSTRIAL AUTOMATION & EQUIPMENT
    9. 6.9 DRIVERS IMPACT ANALYSIS: INDUSTRIAL AUTOMATION & EQUIPMENT
    10. 6.10 RESTRAINTS IMPACT ANALYSIS: INDUSTRIAL AUTOMATION & EQUIPMENT
    11. 6.11 SUPPLY / VALUE CHAIN: INDUSTRIAL AUTOMATION & EQUIPMENT
    12. 6.12 INDUSTRIAL AUTOMATION & EQUIPMENT, BY ANIMAL TYPE, 2024 (% SHARE)
    13. 6.13 INDUSTRIAL AUTOMATION & EQUIPMENT, BY ANIMAL TYPE, 2024 TO 2035 (USD Million)
    14. 6.14 INDUSTRIAL AUTOMATION & EQUIPMENT, BY TECHNOLOGY, 2024 (% SHARE)
    15. 6.15 INDUSTRIAL AUTOMATION & EQUIPMENT, BY TECHNOLOGY, 2024 TO 2035 (USD Million)
    16. 6.16 INDUSTRIAL AUTOMATION & EQUIPMENT, BY PRODUCT, 2024 (% SHARE)
    17. 6.17 INDUSTRIAL AUTOMATION & EQUIPMENT, BY PRODUCT, 2024 TO 2035 (USD Million)
    18. 6.18 INDUSTRIAL AUTOMATION & EQUIPMENT, BY END USER, 2024 (% SHARE)
    19. 6.19 INDUSTRIAL AUTOMATION & EQUIPMENT, BY END USER, 2024 TO 2035 (USD Million)
    20. 6.20 BENCHMARKING OF MAJOR COMPETITORS
  7. 7 LIST OF TABLES
    1. 7.1 LIST OF ASSUMPTIONS
  8. 7.1.1
    1. 7.2 Japan MARKET SIZE ESTIMATES; FORECAST
      1. 7.2.1 BY ANIMAL TYPE, 2025-2035 (USD Million)
      2. 7.2.2 BY TECHNOLOGY, 2025-2035 (USD Million)
      3. 7.2.3 BY PRODUCT, 2025-2035 (USD Million)
      4. 7.2.4 BY END USER, 2025-2035 (USD Million)
    2. 7.3 PRODUCT LAUNCH/PRODUCT DEVELOPMENT/APPROVAL
  9. 7.3.1
    1. 7.4 ACQUISITION/PARTNERSHIP
  10. 7.4.1

Japan Industrial Automation & Equipment Market Segmentation

Industrial Automation & Equipment By Animal Type (USD Million, 2025-2035)
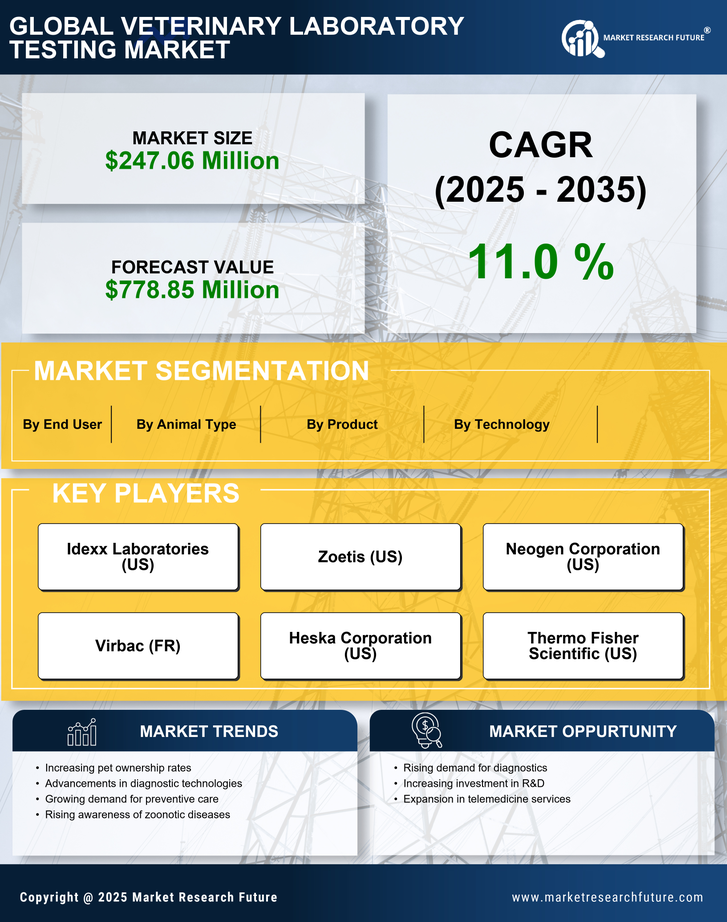
  • Companion Animals
  • Livestock Animals

Industrial Automation & Equipment By Technology (USD Million, 2025-2035)

  • Clinical Biochemistry
  • Immunodiagnostics
  • Hematology
  • Molecular Diagnostics
  • Urinalysis

Industrial Automation & Equipment By Product (USD Million, 2025-2035)

  • Consumables
  • Instruments

Industrial Automation & Equipment By End User (USD Million, 2025-2035)

  • Veterinary Hospitals & Clinics
  • In-House Testing
  • Research Institutes
  • Diagnostic Laboratories

Compare Licence

×
Features License Type
Single User Multiuser License Enterprise User
Price $4,950 $5,950 $7,250
Maximum User Access Limit 1 User Upto 10 Users Unrestricted Access Throughout the Organization
Free Customization
Direct Access to Analyst
Deliverable Format
Platform Access
Discount on Next Purchase 10% 15% 15%
Printable Versions