

Italy Industrial Automation & Equipment Market Segmentation
Industrial Automation & Equipment By Type (USD Million, 2025-2035)
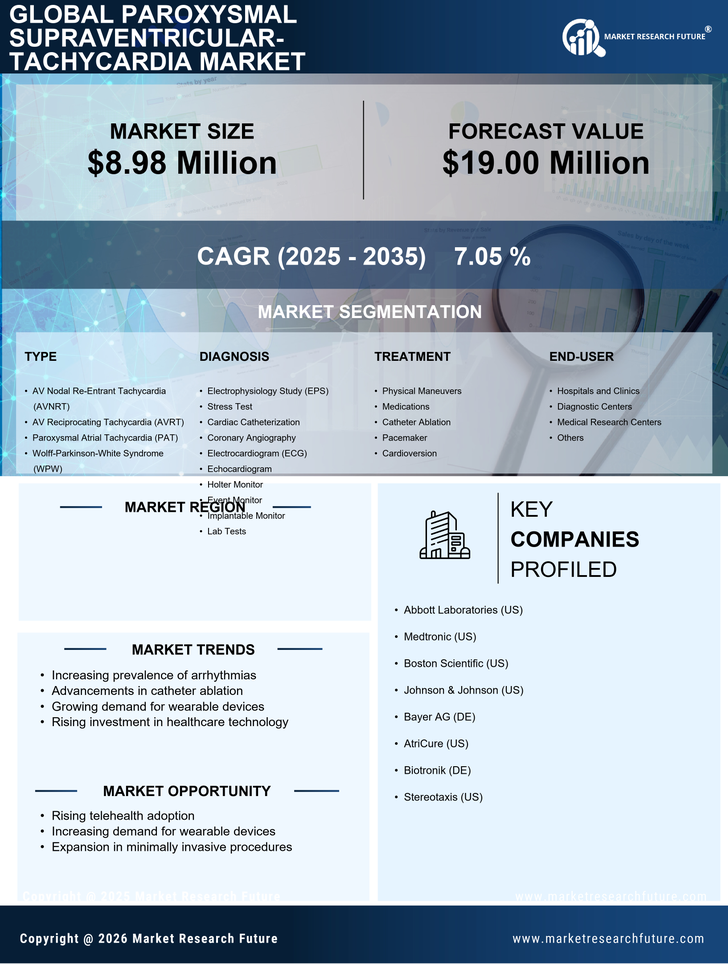
- AV Nodal Re-Entrant Tachycardia (AVNRT)
- AV Reciprocating Tachycardia (AVRT)
- Paroxysmal Atrial Tachycardia (PAT)
- Wolff-Parkinson-White Syndrome (WPW)
Industrial Automation & Equipment By Diagnosis (USD Million, 2025-2035)
- Electrophysiology Study (EPS)
- Stress Test
- Cardiac Catheterization
- Coronary Angiography
- Electrocardiogram (ECG)
- Echocardiogram
- Holter Monitor
- Event Monitor
- Implantable Monitor
- Lab Tests
Industrial Automation & Equipment By Treatment (USD Million, 2025-2035)
- Physical Maneuvers
- Medications
- Catheter Ablation
- Pacemaker
- Cardioversion
Industrial Automation & Equipment By End-User (USD Million, 2025-2035)
- Hospitals and Clinics
- Diagnostic Centers
- Medical Research Centers
- Others


