Request Free Sample ×

Kindly complete the form below to receive a free sample of this Report

* Please use a valid business email

Leading companies partner with us for data-driven Insights

clients tt-cursor
Hero Background

Italy Opioids Market

ID: MRFR/HC/51510-HCR
200 Pages
Rahul Gotadki
Last Updated: February 06, 2026

Italy Opioids Market Research Report: Size, Share, Trend Analysis By Types (Natural Opioids, Semi-Synthetic Opioids, Fully Synthetic Opioids), By Applications (Pain Management, Anesthesia, Cough Suppression, Diarrhea Treatment), By Route of Administration (Oral, Injectable, Transdermal, Topical) and By Distribution Channel (Hospital Pharmacy, Retail Pharmacy, Online Pharmacy) - Growth Outlook & Industry Forecast 2025 To 2035

Share:
Download PDF ×

We do not share your information with anyone. However, we may send you emails based on your report interest from time to time. You may contact us at any time to opt-out.

  1. 1 SECTION I: EXECUTIVE SUMMARY AND KEY HIGHLIGHTS
    1. 1.1 EXECUTIVE SUMMARY
      1. 1.1.1 Market Overview
      2. 1.1.2 Key Findings
      3. 1.1.3 Market Segmentation
      4. 1.1.4 Competitive Landscape
      5. 1.1.5 Challenges and Opportunities
      6. 1.1.6 Future Outlook
  2. 2 SECTION II: SCOPING, METHODOLOGY AND MARKET STRUCTURE
    1. 2.1 MARKET INTRODUCTION
      1. 2.1.1 Definition
      2. 2.1.2 Scope of the study
        1. 2.1.2.1 Research Objective
        2. 2.1.2.2 Assumption
        3. 2.1.2.3 Limitations
    2. 2.2 RESEARCH METHODOLOGY
      1. 2.2.1 Overview
      2. 2.2.2 Data Mining
      3. 2.2.3 Secondary Research
      4. 2.2.4 Primary Research
        1. 2.2.4.1 Primary Interviews and Information Gathering Process
        2. 2.2.4.2 Breakdown of Primary Respondents
      5. 2.2.5 Forecasting Model
      6. 2.2.6 Market Size Estimation
        1. 2.2.6.1 Bottom-Up Approach
        2. 2.2.6.2 Top-Down Approach
      7. 2.2.7 Data Triangulation
      8. 2.2.8 Validation
  3. 3 SECTION III: QUALITATIVE ANALYSIS
    1. 3.1 MARKET DYNAMICS
      1. 3.1.1 Overview
      2. 3.1.2 Drivers
      3. 3.1.3 Restraints
      4. 3.1.4 Opportunities
    2. 3.2 MARKET FACTOR ANALYSIS
      1. 3.2.1 Value chain Analysis
      2. 3.2.2 Porter's Five Forces Analysis
        1. 3.2.2.1 Bargaining Power of Suppliers
        2. 3.2.2.2 Bargaining Power of Buyers
        3. 3.2.2.3 Threat of New Entrants
        4. 3.2.2.4 Threat of Substitutes
        5. 3.2.2.5 Intensity of Rivalry
      3. 3.2.3 COVID-19 Impact Analysis
        1. 3.2.3.1 Market Impact Analysis
        2. 3.2.3.2 Regional Impact
        3. 3.2.3.3 Opportunity and Threat Analysis
  4. 4 SECTION IV: QUANTITATIVE ANALYSIS
    1. 4.1 Life Sciences, BY Type (USD Million)
      1. 4.1.1 Natural Opioids
      2. 4.1.2 Semi-synthetic Opioids
      3. 4.1.3 Fully Synthetic Opioids
      4. 4.1.4 Opioid Derivatives
    2. 4.2 Life Sciences, BY Route of Administration (USD Million)
      1. 4.2.1 Oral
      2. 4.2.2 Injectable
      3. 4.2.3 Transdermal
      4. 4.2.4 Rectal
      5. 4.2.5 Nasal
    3. 4.3 Life Sciences, BY Therapeutic Application (USD Million)
      1. 4.3.1 Pain Management
      2. 4.3.2 Cough Suppression
      3. 4.3.3 Diarrhea Treatment
      4. 4.3.4 Anesthesia
    4. 4.4 Life Sciences, BY Patient Population (USD Million)
      1. 4.4.1 Chronic Pain Patients
      2. 4.4.2 Postoperative Pain Patients
      3. 4.4.3 Cancer Patients
      4. 4.4.4 Palliative Care Patients
  5. 5 SECTION V: COMPETITIVE ANALYSIS
    1. 5.1 Competitive Landscape
      1. 5.1.1 Overview
      2. 5.1.2 Competitive Analysis
      3. 5.1.3 Market share Analysis
      4. 5.1.4 Major Growth Strategy in the Life Sciences
      5. 5.1.5 Competitive Benchmarking
      6. 5.1.6 Leading Players in Terms of Number of Developments in the Life Sciences
      7. 5.1.7 Key developments and growth strategies
        1. 5.1.7.1 New Product Launch/Service Deployment
        2. 5.1.7.2 Merger & Acquisitions
        3. 5.1.7.3 Joint Ventures
      8. 5.1.8 Major Players Financial Matrix
        1. 5.1.8.1 Sales and Operating Income
        2. 5.1.8.2 Major Players R&D Expenditure. 2023
    2. 5.2 Company Profiles
      1. 5.2.1 Purdue Pharma (US)
        1. 5.2.1.1 Financial Overview
        2. 5.2.1.2 Products Offered
        3. 5.2.1.3 Key Developments
        4. 5.2.1.4 SWOT Analysis
        5. 5.2.1.5 Key Strategies
      2. 5.2.2 Johnson & Johnson (US)
        1. 5.2.2.1 Financial Overview
        2. 5.2.2.2 Products Offered
        3. 5.2.2.3 Key Developments
        4. 5.2.2.4 SWOT Analysis
        5. 5.2.2.5 Key Strategies
      3. 5.2.3 Teva Pharmaceutical Industries (IL)
        1. 5.2.3.1 Financial Overview
        2. 5.2.3.2 Products Offered
        3. 5.2.3.3 Key Developments
        4. 5.2.3.4 SWOT Analysis
        5. 5.2.3.5 Key Strategies
      4. 5.2.4 Mylan N.V. (US)
        1. 5.2.4.1 Financial Overview
        2. 5.2.4.2 Products Offered
        3. 5.2.4.3 Key Developments
        4. 5.2.4.4 SWOT Analysis
        5. 5.2.4.5 Key Strategies
      5. 5.2.5 Endo International (IE)
        1. 5.2.5.1 Financial Overview
        2. 5.2.5.2 Products Offered
        3. 5.2.5.3 Key Developments
        4. 5.2.5.4 SWOT Analysis
        5. 5.2.5.5 Key Strategies
      6. 5.2.6 Mallinckrodt Pharmaceuticals (IE)
        1. 5.2.6.1 Financial Overview
        2. 5.2.6.2 Products Offered
        3. 5.2.6.3 Key Developments
        4. 5.2.6.4 SWOT Analysis
        5. 5.2.6.5 Key Strategies
      7. 5.2.7 Amgen Inc. (US)
        1. 5.2.7.1 Financial Overview
        2. 5.2.7.2 Products Offered
        3. 5.2.7.3 Key Developments
        4. 5.2.7.4 SWOT Analysis
        5. 5.2.7.5 Key Strategies
      8. 5.2.8 Boehringer Ingelheim (DE)
        1. 5.2.8.1 Financial Overview
        2. 5.2.8.2 Products Offered
        3. 5.2.8.3 Key Developments
        4. 5.2.8.4 SWOT Analysis
        5. 5.2.8.5 Key Strategies
    3. 5.3 Appendix
      1. 5.3.1 References
      2. 5.3.2 Related Reports
  6. 6 LIST OF FIGURES
    1. 6.1 MARKET SYNOPSIS
    2. 6.2 ITALY MARKET ANALYSIS BY TYPE
    3. 6.3 ITALY MARKET ANALYSIS BY ROUTE OF ADMINISTRATION
    4. 6.4 ITALY MARKET ANALYSIS BY THERAPEUTIC APPLICATION
    5. 6.5 ITALY MARKET ANALYSIS BY PATIENT POPULATION
    6. 6.6 KEY BUYING CRITERIA OF LIFE SCIENCES
    7. 6.7 RESEARCH PROCESS OF MRFR
    8. 6.8 DRO ANALYSIS OF LIFE SCIENCES
    9. 6.9 DRIVERS IMPACT ANALYSIS: LIFE SCIENCES
    10. 6.10 RESTRAINTS IMPACT ANALYSIS: LIFE SCIENCES
    11. 6.11 SUPPLY / VALUE CHAIN: LIFE SCIENCES
    12. 6.12 LIFE SCIENCES, BY TYPE, 2024 (% SHARE)
    13. 6.13 LIFE SCIENCES, BY TYPE, 2024 TO 2035 (USD Million)
    14. 6.14 LIFE SCIENCES, BY ROUTE OF ADMINISTRATION, 2024 (% SHARE)
    15. 6.15 LIFE SCIENCES, BY ROUTE OF ADMINISTRATION, 2024 TO 2035 (USD Million)
    16. 6.16 LIFE SCIENCES, BY THERAPEUTIC APPLICATION, 2024 (% SHARE)
    17. 6.17 LIFE SCIENCES, BY THERAPEUTIC APPLICATION, 2024 TO 2035 (USD Million)
    18. 6.18 LIFE SCIENCES, BY PATIENT POPULATION, 2024 (% SHARE)
    19. 6.19 LIFE SCIENCES, BY PATIENT POPULATION, 2024 TO 2035 (USD Million)
    20. 6.20 BENCHMARKING OF MAJOR COMPETITORS
  7. 7 LIST OF TABLES
    1. 7.1 LIST OF ASSUMPTIONS
  8. 7.1.1
    1. 7.2 Italy MARKET SIZE ESTIMATES; FORECAST
      1. 7.2.1 BY TYPE, 2025-2035 (USD Million)
      2. 7.2.2 BY ROUTE OF ADMINISTRATION, 2025-2035 (USD Million)
      3. 7.2.3 BY THERAPEUTIC APPLICATION, 2025-2035 (USD Million)
      4. 7.2.4 BY PATIENT POPULATION, 2025-2035 (USD Million)
    2. 7.3 PRODUCT LAUNCH/PRODUCT DEVELOPMENT/APPROVAL
  9. 7.3.1
    1. 7.4 ACQUISITION/PARTNERSHIP
  10. 7.4.1

Italy Life Sciences Market Segmentation

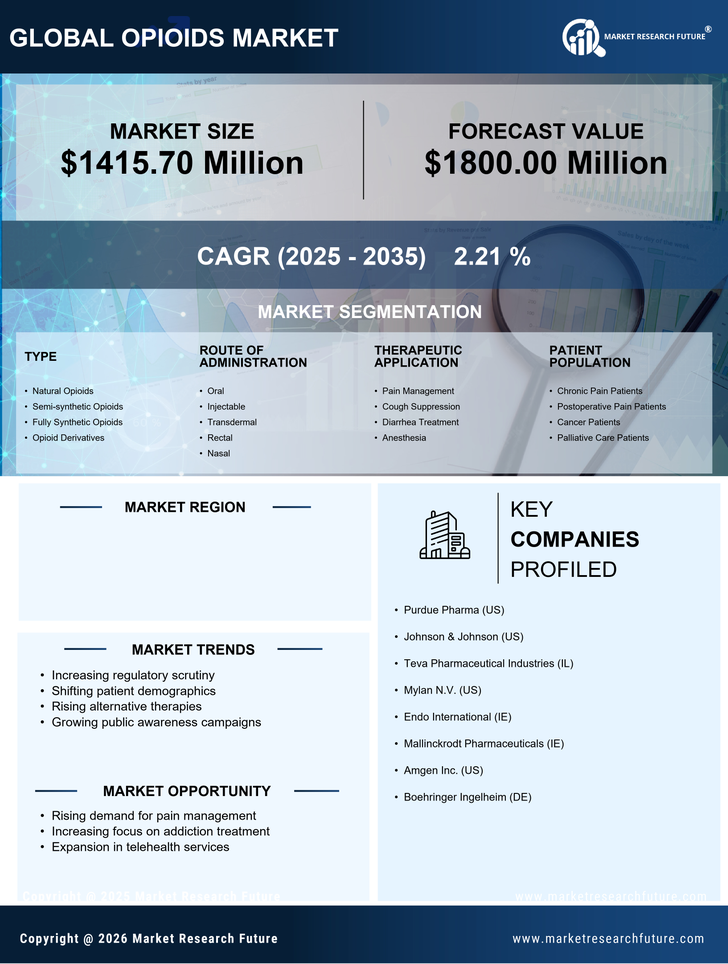
Life Sciences By Type (USD Million, 2025-2035)

  • Natural Opioids
  • Semi-synthetic Opioids
  • Fully Synthetic Opioids
  • Opioid Derivatives

Life Sciences By Route of Administration (USD Million, 2025-2035)

  • Oral
  • Injectable
  • Transdermal
  • Rectal
  • Nasal

Life Sciences By Therapeutic Application (USD Million, 2025-2035)

  • Pain Management
  • Cough Suppression
  • Diarrhea Treatment
  • Anesthesia

Life Sciences By Patient Population (USD Million, 2025-2035)

  • Chronic Pain Patients
  • Postoperative Pain Patients
  • Cancer Patients
  • Palliative Care Patients

Compare Licence

×
Features License Type
Single User Multiuser License Enterprise User
Price $4,950 $5,950 $7,250
Maximum User Access Limit 1 User Upto 10 Users Unrestricted Access Throughout the Organization
Free Customization
Direct Access to Analyst
Deliverable Format
Platform Access
Discount on Next Purchase 10% 15% 15%
Printable Versions