Request Free Sample ×

Kindly complete the form below to receive a free sample of this Report

* Please use a valid business email

Leading companies partner with us for data-driven Insights

clients tt-cursor
Hero Background

Italy Hemangioblastoma Market

ID: MRFR/HC/54543-HCR
200 Pages
Rahul Gotadki
Last Updated: April 06, 2026

Italy Hemangioblastoma Market Research Report By Tumor Site (Brain, Spinal Cord, Retina), By Diagnosis (CT Scan, MRI Scan, Others) and By Treatment (Surgery, Chemotherapy, Radiotherapy, Corticosteroids, Anticonvulsants, Others) - Growth & Industry Forecast 2025 To 2035

Share:
Download PDF ×

We do not share your information with anyone. However, we may send you emails based on your report interest from time to time. You may contact us at any time to opt-out.

Italy Hemangioblastoma Market Infographic
Purchase Options
  1. 1 SECTION I: EXECUTIVE SUMMARY AND KEY HIGHLIGHTS
  2.   1.1 EXECUTIVE SUMMARY
  3.     1.1.1 Market Overview
  4.     1.1.2 Key Findings
  5.     1.1.3 Market Segmentation
  6.     1.1.4 Competitive Landscape
  7.     1.1.5 Challenges and Opportunities
  8.     1.1.6 Future Outlook
  9. 2 SECTION II: SCOPING, METHODOLOGY AND MARKET STRUCTURE
  10.   2.1 MARKET INTRODUCTION
  11.     2.1.1 Definition
  12.     2.1.2 Scope of the study
  13.       2.1.2.1 Research Objective
  14.       2.1.2.2 Assumption
  15.       2.1.2.3 Limitations
  16.   2.2 RESEARCH METHODOLOGY
  17.     2.2.1 Overview
  18.     2.2.2 Data Mining
  19.     2.2.3 Secondary Research
  20.     2.2.4 Primary Research
  21.       2.2.4.1 Primary Interviews and Information Gathering Process
  22.       2.2.4.2 Breakdown of Primary Respondents
  23.     2.2.5 Forecasting Model
  24.     2.2.6 Market Size Estimation
  25.       2.2.6.1 Bottom-Up Approach
  26.       2.2.6.2 Top-Down Approach
  27.     2.2.7 Data Triangulation
  28.     2.2.8 Validation
  29. 3 SECTION III: QUALITATIVE ANALYSIS
  30.   3.1 MARKET DYNAMICS
  31.     3.1.1 Overview
  32.     3.1.2 Drivers
  33.     3.1.3 Restraints
  34.     3.1.4 Opportunities
  35.   3.2 MARKET FACTOR ANALYSIS
  36.     3.2.1 Value chain Analysis
  37.     3.2.2 Porter's Five Forces Analysis
  38.       3.2.2.1 Bargaining Power of Suppliers
  39.       3.2.2.2 Bargaining Power of Buyers
  40.       3.2.2.3 Threat of New Entrants
  41.       3.2.2.4 Threat of Substitutes
  42.       3.2.2.5 Intensity of Rivalry
  43.     3.2.3 COVID-19 Impact Analysis
  44.       3.2.3.1 Market Impact Analysis
  45.       3.2.3.2 Regional Impact
  46.       3.2.3.3 Opportunity and Threat Analysis
  47. 4 SECTION IV: QUANTITATIVE ANALYSIS
  48.   4.1 Food, Beverages & Nutrition, BY Tumor Site (USD Million)
  49.     4.1.1 Brain
  50.     4.1.2 Spinal Cord
  51.     4.1.3 Retina
  52.   4.2 Food, Beverages & Nutrition, BY Diagnosis (USD Million)
  53.     4.2.1 CT Scan
  54.     4.2.2 MRI Scan
  55.     4.2.3 Angiogram
  56.   4.3 Food, Beverages & Nutrition, BY Treatment (USD Million)
  57.     4.3.1 Surgery
  58.     4.3.2 Chemotherapy
  59.     4.3.3 Radiotherapy
  60.     4.3.4 Corticosteroids
  61.     4.3.5 Anticonvulsants
  62.   4.4 Food, Beverages & Nutrition, BY Radiotherapy (USD Million)
  63.     4.4.1 Conformal Radiotherapy
  64.     4.4.2 Intensity Modulated Radiotherapy (IMRT)
  65.     4.4.3 Stereotactic Radiotherapy
  66.     4.4.4 Radiosurgery
  67.   4.5 Food, Beverages & Nutrition, BY Corticosteroids (USD Million)
  68.     4.5.1 Hydrocortisone
  69.     4.5.2 Dexamethasone
  70.     4.5.3 Methylprednisolone
  71.     4.5.4 Prednisolone
  72.   4.6 Food, Beverages & Nutrition, BY Anticonvulsants (USD Million)
  73.     4.6.1 Carbamazepine
  74.     4.6.2 Lamotrigine
  75.     4.6.3 Levetiracetam
  76.     4.6.4 Phenytoin
  77.     4.6.5 Sodium Valproate
  78. 5 SECTION V: COMPETITIVE ANALYSIS
  79.   5.1 Competitive Landscape
  80.     5.1.1 Overview
  81.     5.1.2 Competitive Analysis
  82.     5.1.3 Market share Analysis
  83.     5.1.4 Major Growth Strategy in the Food, Beverages & Nutrition
  84.     5.1.5 Competitive Benchmarking
  85.     5.1.6 Leading Players in Terms of Number of Developments in the Food, Beverages & Nutrition
  86.     5.1.7 Key developments and growth strategies
  87.       5.1.7.1 New Product Launch/Service Deployment
  88.       5.1.7.2 Merger & Acquisitions
  89.       5.1.7.3 Joint Ventures
  90.     5.1.8 Major Players Financial Matrix
  91.       5.1.8.1 Sales and Operating Income
  92.       5.1.8.2 Major Players R&D Expenditure. 2023
  93.   5.2 Company Profiles
  94.     5.2.1 Roche (CH)
  95.       5.2.1.1 Financial Overview
  96.       5.2.1.2 Products Offered
  97.       5.2.1.3 Key Developments
  98.       5.2.1.4 SWOT Analysis
  99.       5.2.1.5 Key Strategies
  100.     5.2.2 Novartis (CH)
  101.       5.2.2.1 Financial Overview
  102.       5.2.2.2 Products Offered
  103.       5.2.2.3 Key Developments
  104.       5.2.2.4 SWOT Analysis
  105.       5.2.2.5 Key Strategies
  106.     5.2.3 Bristol-Myers Squibb (US)
  107.       5.2.3.1 Financial Overview
  108.       5.2.3.2 Products Offered
  109.       5.2.3.3 Key Developments
  110.       5.2.3.4 SWOT Analysis
  111.       5.2.3.5 Key Strategies
  112.     5.2.4 Merck (US)
  113.       5.2.4.1 Financial Overview
  114.       5.2.4.2 Products Offered
  115.       5.2.4.3 Key Developments
  116.       5.2.4.4 SWOT Analysis
  117.       5.2.4.5 Key Strategies
  118.     5.2.5 Pfizer (US)
  119.       5.2.5.1 Financial Overview
  120.       5.2.5.2 Products Offered
  121.       5.2.5.3 Key Developments
  122.       5.2.5.4 SWOT Analysis
  123.       5.2.5.5 Key Strategies
  124.     5.2.6 Eli Lilly (US)
  125.       5.2.6.1 Financial Overview
  126.       5.2.6.2 Products Offered
  127.       5.2.6.3 Key Developments
  128.       5.2.6.4 SWOT Analysis
  129.       5.2.6.5 Key Strategies
  130.     5.2.7 Amgen (US)
  131.       5.2.7.1 Financial Overview
  132.       5.2.7.2 Products Offered
  133.       5.2.7.3 Key Developments
  134.       5.2.7.4 SWOT Analysis
  135.       5.2.7.5 Key Strategies
  136.     5.2.8 AstraZeneca (GB)
  137.       5.2.8.1 Financial Overview
  138.       5.2.8.2 Products Offered
  139.       5.2.8.3 Key Developments
  140.       5.2.8.4 SWOT Analysis
  141.       5.2.8.5 Key Strategies
  142.   5.3 Appendix
  143.     5.3.1 References
  144.     5.3.2 Related Reports
  145. 6 LIST OF FIGURES
  146.   6.1 MARKET SYNOPSIS
  147.   6.2 ITALY MARKET ANALYSIS BY TUMOR SITE
  148.   6.3 ITALY MARKET ANALYSIS BY DIAGNOSIS
  149.   6.4 ITALY MARKET ANALYSIS BY TREATMENT
  150.   6.5 ITALY MARKET ANALYSIS BY RADIOTHERAPY
  151.   6.6 ITALY MARKET ANALYSIS BY CORTICOSTEROIDS
  152.   6.7 ITALY MARKET ANALYSIS BY ANTICONVULSANTS
  153.   6.8 KEY BUYING CRITERIA OF FOOD, BEVERAGES & NUTRITION
  154.   6.9 RESEARCH PROCESS OF MRFR
  155.   6.10 DRO ANALYSIS OF FOOD, BEVERAGES & NUTRITION
  156.   6.11 DRIVERS IMPACT ANALYSIS: FOOD, BEVERAGES & NUTRITION
  157.   6.12 RESTRAINTS IMPACT ANALYSIS: FOOD, BEVERAGES & NUTRITION
  158.   6.13 SUPPLY / VALUE CHAIN: FOOD, BEVERAGES & NUTRITION
  159.   6.14 FOOD, BEVERAGES & NUTRITION, BY TUMOR SITE, 2024 (% SHARE)
  160.   6.15 FOOD, BEVERAGES & NUTRITION, BY TUMOR SITE, 2024 TO 2035 (USD Million)
  161.   6.16 FOOD, BEVERAGES & NUTRITION, BY DIAGNOSIS, 2024 (% SHARE)
  162.   6.17 FOOD, BEVERAGES & NUTRITION, BY DIAGNOSIS, 2024 TO 2035 (USD Million)
  163.   6.18 FOOD, BEVERAGES & NUTRITION, BY TREATMENT, 2024 (% SHARE)
  164.   6.19 FOOD, BEVERAGES & NUTRITION, BY TREATMENT, 2024 TO 2035 (USD Million)
  165.   6.20 FOOD, BEVERAGES & NUTRITION, BY RADIOTHERAPY, 2024 (% SHARE)
  166.   6.21 FOOD, BEVERAGES & NUTRITION, BY RADIOTHERAPY, 2024 TO 2035 (USD Million)
  167.   6.22 FOOD, BEVERAGES & NUTRITION, BY CORTICOSTEROIDS, 2024 (% SHARE)
  168.   6.23 FOOD, BEVERAGES & NUTRITION, BY CORTICOSTEROIDS, 2024 TO 2035 (USD Million)
  169.   6.24 FOOD, BEVERAGES & NUTRITION, BY ANTICONVULSANTS, 2024 (% SHARE)
  170.   6.25 FOOD, BEVERAGES & NUTRITION, BY ANTICONVULSANTS, 2024 TO 2035 (USD Million)
  171.   6.26 BENCHMARKING OF MAJOR COMPETITORS
  172. 7 LIST OF TABLES
  173.   7.1 LIST OF ASSUMPTIONS
  174.     7.1.1
  175.   7.2 Italy MARKET SIZE ESTIMATES; FORECAST
  176.     7.2.1 BY TUMOR SITE, 2025-2035 (USD Million)
  177.     7.2.2 BY DIAGNOSIS, 2025-2035 (USD Million)
  178.     7.2.3 BY TREATMENT, 2025-2035 (USD Million)
  179.     7.2.4 BY RADIOTHERAPY, 2025-2035 (USD Million)
  180.     7.2.5 BY CORTICOSTEROIDS, 2025-2035 (USD Million)
  181.     7.2.6 BY ANTICONVULSANTS, 2025-2035 (USD Million)
  182.   7.3 PRODUCT LAUNCH/PRODUCT DEVELOPMENT/APPROVAL
  183.     7.3.1
  184.   7.4 ACQUISITION/PARTNERSHIP
  185.     7.4.1

Italy Food, Beverages & Nutrition Market Segmentation

Food, Beverages & Nutrition By Tumor Site (USD Million, 2025-2035)
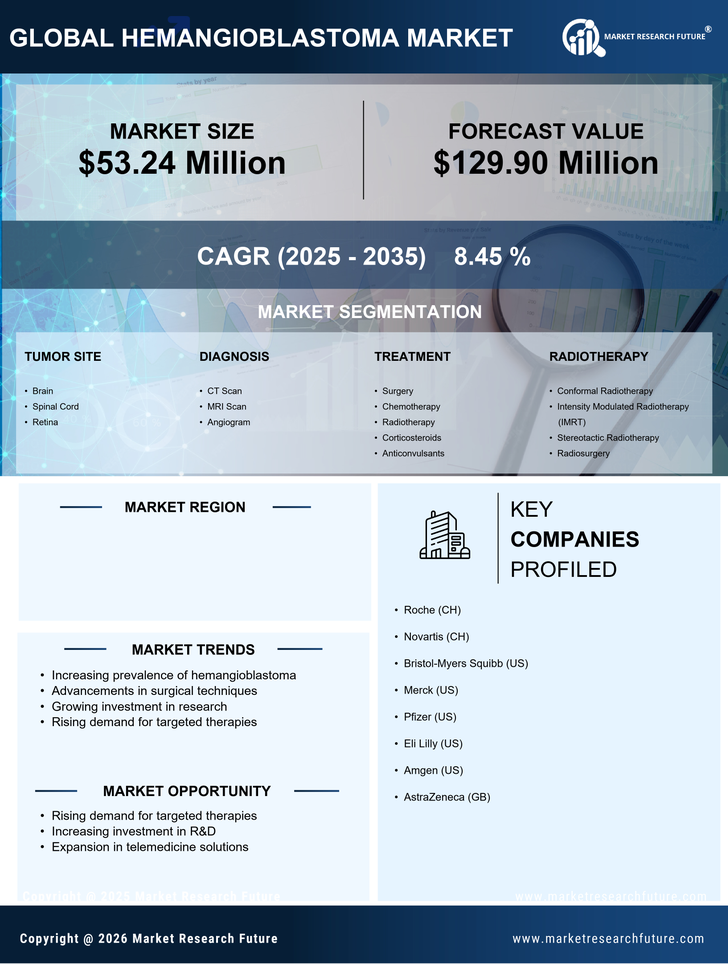
  • Brain
  • Spinal Cord
  • Retina

Food, Beverages & Nutrition By Diagnosis (USD Million, 2025-2035)

  • CT Scan
  • MRI Scan
  • Angiogram

Food, Beverages & Nutrition By Treatment (USD Million, 2025-2035)

  • Surgery
  • Chemotherapy
  • Radiotherapy
  • Corticosteroids
  • Anticonvulsants

Food, Beverages & Nutrition By Radiotherapy (USD Million, 2025-2035)

  • Conformal Radiotherapy
  • Intensity Modulated Radiotherapy (IMRT)
  • Stereotactic Radiotherapy
  • Radiosurgery

Food, Beverages & Nutrition By Corticosteroids (USD Million, 2025-2035)

  • Hydrocortisone
  • Dexamethasone
  • Methylprednisolone
  • Prednisolone

Food, Beverages & Nutrition By Anticonvulsants (USD Million, 2025-2035)

  • Carbamazepine
  • Lamotrigine
  • Levetiracetam
  • Phenytoin
  • Sodium Valproate

Compare Licence

×
Features License Type
Single User Multiuser License Enterprise User
Price $4,950 $5,950 $7,250
Maximum User Access Limit 1 User Upto 10 Users Unrestricted Access Throughout the Organization
Free Customization
Direct Access to Analyst
Deliverable Format
Platform Access
Discount on Next Purchase 10% 15% 15%
Printable Versions