Isocyanate Market

ID: MRFR/CnM/0458-CR
274 Pages
Chitranshi Jaiswal
Last Updated: June 25, 2026
Isocyanates Market Research Report Information By Type (Aromatic Diisocyanate and Aliphatic), By Application (Rigid Foam, Flexible Foam, Paints and Coatings, Adhesives and Sealants, Elastomers, Binders, and Others), By End Use (Building & Construction, Furniture, Automotive, Electronics, Packaging, Footwear, and Others), and By Region (North America, Europe, Asia-Pacific, and Rest Of The World) – Market Forecast Till 2035
Download PDF ×

We do not share your information with anyone. However, we may send you emails based on your report interest from time to time. You may contact us at any time to opt-out.

Isocyanate Market

Market Size

Forecast Period2026-2035
CAGR (2026-2035)5.72%
2026 Market SizeUSD 36,210 Million
2035 Market SizeUSD 59,740 Million

Key Players

BASF SE
Covestro AG
Wanhua Chemical Group
Dow Inc.
Huntsman Corporation
Tosoh Corporation
Opportunities
  • Non-Phosgene and Bio-Based Isocyanate Pathways
  • Cold-Chain Logistics and Refrigerated Packaging
  • Digital Platform Models for Polyurethane System Houses
  1. 1 Market Overview |
    1. 1.1 Study Assumptions & Market Definition |
    2. 1.2 Scope of the Study |
    3. 1.3 Research Methodology
  2. 2 Market Summary & Key Takeaways
  3. 3 Market Dynamics |
    1. 3.1 Market Drivers Analysis | |
      1. 3.1.1 Tighter Building-Energy Insulation Codes | |
      2. 3.1.2 EV Lightweighting and Battery-Pack Encapsulation | |
      3. 3.1.3 Asia-Pacific Urbanization and Construction Expansion | |
      4. 3.1.4 Aliphatic Isocyanate Adoption in Coatings | |
      5. 3.1.5 Cold-Chain and Refrigerated-Logistics Expansion | |
      6. 3.1.6 GCC Downstream Diversification Investment | |
      7. 3.1.7 Appliance Energy-Efficiency Labeling Upgrades |
    2. 3.2 Market Restraints Analysis | |
      1. 3.2.1 Benzene and Aniline Feedstock Price Volatility | |
      2. 3.2.2 REACH/EPA Regulatory Tightening on Diisocyanate Exposure | |
      3. 3.2.3 Bio-Based and Non-Isocyanate Polyurethane Substitution | |
      4. 3.2.4 Overcapacity Risk from Concurrent Mega-Plant Commissioning | |
      5. 3.2.5 Downstream Recycling Mandates Reducing Virgin Demand |
    3. 3.3 Market Opportunity Analysis | |
      1. 3.3.1 Non-Phosgene and Bio-Based Isocyanate Pathways | |
      2. 3.3.2 Cold-Chain Logistics and Refrigerated Packaging | |
      3. 3.3.3 Digital Platform Models for Polyurethane System Houses | |
      4. 3.3.4 GCC and Southeast Asian Downstream Diversification | |
      5. 3.3.5 Circular Economy and Chemical Recycling of Polyurethane |
    4. 3.4 Industry Value Chain Analysis |
    5. 3.5 Porter's Five Forces Analysis
  4. 4 Global Isocyanates Market Size & Forecast (2021–2035) |
    1. 4.1 Historical Market Size (2021–2025) |
    2. 4.2 Current & Forecast Market Size (2026–2035) |
    3. 4.3 Market Size by Revenue (USD Million) |
    4. 4.4 Year-over-Year Growth Analysis
  5. 5 Segmentation Analysis |
    1. 5.1 By Type | |
      1. 5.1.1 MDI | |
      2. 5.1.2 TDI | |
      3. 5.1.3 Aliphatic | |
      4. 5.1.4 Other Types |
    2. 5.2 By Application | |
      1. 5.2.1 Rigid Foam | |
      2. 5.2.2 Flexible Foam | |
      3. 5.2.3 Paints and Coatings | |
      4. 5.2.4 Adhesives and Sealants | |
      5. 5.2.5 Elastomers | |
      6. 5.2.6 Binders | |
      7. 5.2.7 Other Applications |
    3. 5.3 By End-User Industry | |
      1. 5.3.1 Building and Construction | |
      2. 5.3.2 Automotive | |
      3. 5.3.3 Healthcare | |
      4. 5.3.4 Furniture | |
      5. 5.3.5 Other End-Users
  6. 6 Regional Analysis |
    1. 6.1 North America | |
      1. 6.1.1 United States | |
      2. 6.1.2 Canada | |
      3. 6.1.3 Mexico |
    2. 6.2 Europe | |
      1. 6.2.1 Germany | |
      2. 6.2.2 United Kingdom | |
      3. 6.2.3 France | |
      4. 6.2.4 Italy | |
      5. 6.2.5 Spain | |
      6. 6.2.6 Nordic Countries | |
      7. 6.2.7 Russia | |
      8. 6.2.8 Rest of Europe |
    3. 6.3 Asia-Pacific | |
      1. 6.3.1 China | |
      2. 6.3.2 India | |
      3. 6.3.3 Japan | |
      4. 6.3.4 South Korea | |
      5. 6.3.5 ASEAN | |
      6. 6.3.6 Rest of Asia-Pacific |
    4. 6.4 South America | |
      1. 6.4.1 Brazil | |
      2. 6.4.2 Argentina | |
      3. 6.4.3 Rest of South America |
    5. 6.5 Middle East & Africa | |
      1. 6.5.1 Saudi Arabia | |
      2. 6.5.2 UAE | |
      3. 6.5.3 South Africa | |
      4. 6.5.4 Egypt | |
      5. 6.5.5 Rest of MEA
  7. 7 Competitive Landscape |
    1. 7.1 Market Share Analysis (2025) |
    2. 7.2 Competitive Benchmarking Matrix |
    3. 7.3 Company Profiles | |
      1. 7.3.1 BASF SE | |
      2. 7.3.2 Covestro AG | |
      3. 7.3.3 Wanhua Chemical Group | |
      4. 7.3.4 Dow Inc. | |
      5. 7.3.5 Huntsman Corporation | |
      6. 7.3.6 Tosoh Corporation | |
      7. 7.3.7 Mitsui Chemicals | |
      8. 7.3.8 Kumho Mitsui Chemicals | |
      9. 7.3.9 Sadara Chemical Company | |
      10. 7.3.10 Vencorex
  8. 8 Future Outlook & Strategic Recommendations (2026–2035) |
    1. 8.1 Electrification Supercycle and Material Substitution |
    2. 8.2 Sustainability Reporting and ESG-Driven Procurement |
    3. 8.3 Digital and AI-Optimized Production |
    4. 8.4 Regional Capacity Rebalancing
  9. 9 Recent Developments & News
  10. 10 Frequently Asked Questions (FAQs)
  11. 11 Report Scope & Methodology |
    1. 11.1 Study Period & Base Year |
    2. 11.2 Data Sources & Citations |
    3. 11.3 Abbreviations
  12. 12 LIST OF TABLES |
  13. TABLE 1 Global Isocyanates Market Size & Forecast, by Revenue (USD Million), 2021–2035 |
  14. TABLE 2 Global Isocyanates Market — Year-over-Year Growth Analysis, 2021–2035 |
  15. TABLE 3 Global Isocyanates Market — Driver Impact Analysis |
  16. TABLE 4 Global Isocyanates Market — Restraints Impact Analysis |
  17. TABLE 5 Global Isocyanates Market Size, by Type, 2021–2035 (USD Million) |
  18. TABLE 6 Global Isocyanates Market Size, by Application, 2021–2035 (USD Million) |
  19. TABLE 7 Global Isocyanates Market Size, by End-User Industry, 2021–2035 (USD Million) |
  20. TABLE 8 Global Isocyanates Market Size, by Region, 2021–2035 (USD Million) |
  21. TABLE 9 North America Isocyanates Market Size, by Country, 2021–2035 (USD Million) |
  22. TABLE 10 Europe Isocyanates Market Size, by Country, 2021–2035 (USD Million) |
  23. TABLE 11 Asia-Pacific Isocyanates Market Size, by Country, 2021–2035 (USD Million) |
  24. TABLE 12 South America Isocyanates Market Size, by Country, 2021–2035 (USD Million) |
  25. TABLE 13 Middle East & Africa Isocyanates Market Size, by Country, 2021–2035 (USD Million) |
  26. TABLE 14 Competitive Benchmarking Matrix — Global Isocyanates Market, 2025 |
  27. TABLE 15 Company Profiles — Key Players, Global Isocyanates Market |
  28. TABLE 16 Recent Developments & Strategic Announcements, 2023–2025 |
  29. TABLE 17 Report Scope & Methodology Summary |
  30. TABLE 18 Detailed Sources and Citations |
  31. TABLE 19 North America Isocyanates Market Size, by Type, 2021–2035 (USD Million) |
  32. TABLE 20 North America Isocyanates Market Size, by Application, 2021–2035 (USD Million) |
  33. TABLE 21 North America Isocyanates Market Size, by End-User Industry, 2021–2035 (USD Million) |
  34. TABLE 22 Europe Isocyanates Market Size, by Type, 2021–2035 (USD Million) |
  35. TABLE 23 Europe Isocyanates Market Size, by Application, 2021–2035 (USD Million) |
  36. TABLE 24 Europe Isocyanates Market Size, by End-User Industry, 2021–2035 (USD Million) |
  37. TABLE 25 Asia-Pacific Isocyanates Market Size, by Type, 2021–2035 (USD Million) |
  38. TABLE 26 Asia-Pacific Isocyanates Market Size, by Application, 2021–2035 (USD Million) |
  39. TABLE 27 Asia-Pacific Isocyanates Market Size, by End-User Industry, 2021–2035 (USD Million) |
  40. TABLE 28 South America Isocyanates Market Size, by Type, 2021–2035 (USD Million) |
  41. TABLE 29 South America Isocyanates Market Size, by Application, 2021–2035 (USD Million) |
  42. TABLE 30 South America Isocyanates Market Size, by End-User Industry, 2021–2035 (USD Million) |
  43. TABLE 31 Middle East & Africa Isocyanates Market Size, by Type, 2021–2035 (USD Million) |
  44. TABLE 32 Middle East & Africa Isocyanates Market Size, by Application, 2021–2035 (USD Million) |
  45. TABLE 33 Middle East & Africa Isocyanates Market Size, by End-User Industry, 2021–2035 (USD Million)
  46. 13 LIST OF FIGURES |
  47. FIGURE 1 Global Isocyanates Market Dynamics — Drivers, Restraints, and Opportunities |
  48. FIGURE 2 Industry Value Chain Analysis — Isocyanates Market |
  49. FIGURE 3 Porter's Five Forces Analysis — Isocyanates Market |
  50. FIGURE 4 Global Isocyanates Market Size Trend & Forecast (USD Million), 2021–2035 |
  51. FIGURE 5 Global Isocyanates Market Share, by Type, 2025 |
  52. FIGURE 6 Global Isocyanates Market Share, by Application, 2025 |
  53. FIGURE 7 Global Isocyanates Market Share, by End-User Industry, 2025 |
  54. FIGURE 8 Global Isocyanates Market Share, by Region, 2025 |
  55. FIGURE 9 North America Isocyanates Market Size Trend, 2021–2035 |
  56. FIGURE 10 Europe Isocyanates Market Size Trend, 2021–2035 |
  57. FIGURE 11 Asia-Pacific Isocyanates Market Size Trend, 2021–2035 |
  58. FIGURE 12 South America Isocyanates Market Size Trend, 2021–2035 |
  59. FIGURE 13 Middle East & Africa Isocyanates Market Size Trend, 2021–2035 |
  60. FIGURE 14 Competitive Landscape — Market Share Distribution, 2025

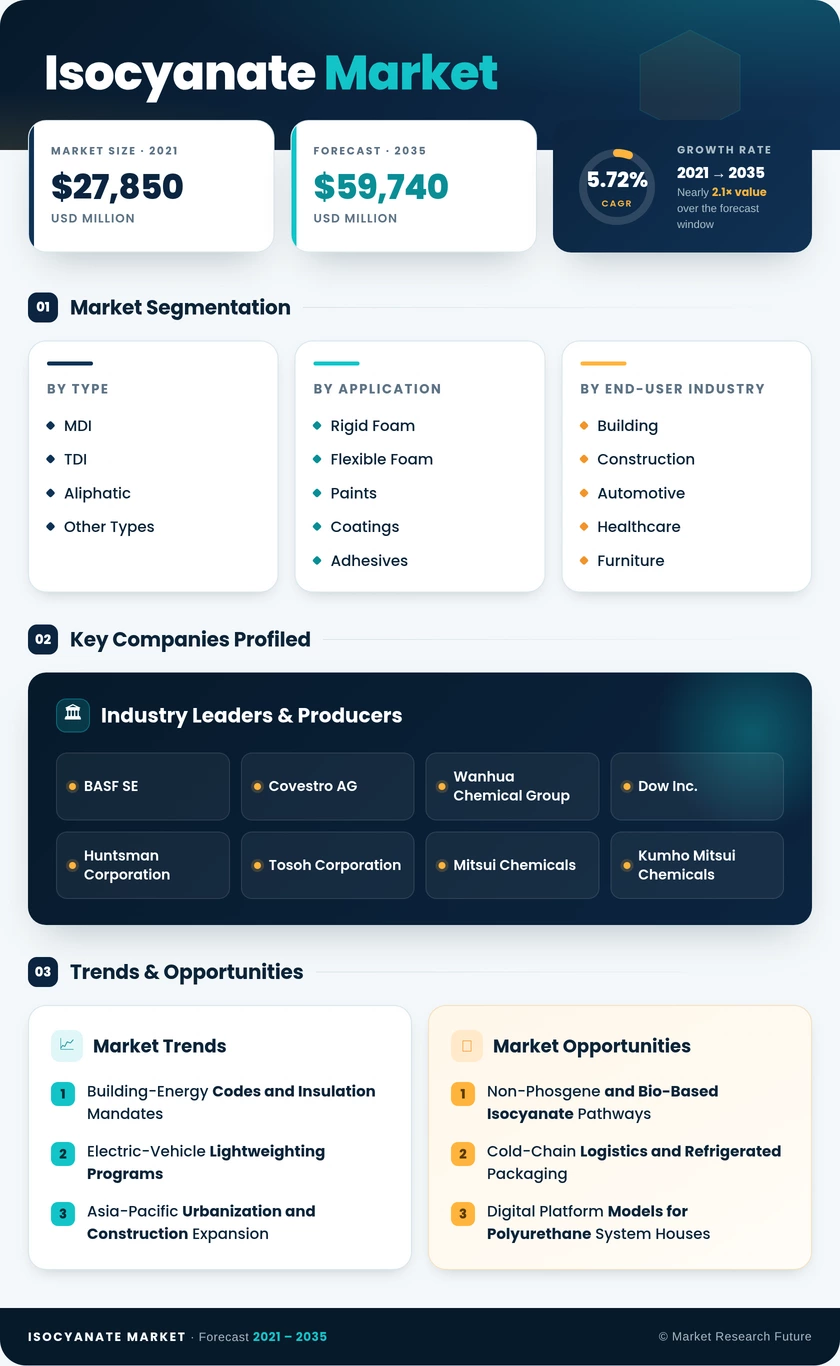
Segmentation Quick Reference

DimensionSub-SegmentsDominant SegmentFastest Growing Segment
By TypeMDI, TDI, Aliphatic, Other TypesMDI (63.2% share, 2025)Aliphatic (7.25% CAGR)
By ApplicationRigid Foam, Flexible Foam, Paints and Coatings, Adhesives and Sealants, Elastomers, Binders, Other ApplicationsRigid Foam (34.8% share, 2025)Paints and Coatings (6.98% CAGR)
By End-User IndustryBuilding and Construction, Automotive, Healthcare, Furniture, Other End-UsersBuilding and Construction (43.8% share, 2025)Automotive (7.12% CAGR)
By GeographyAsia-Pacific, Europe, North America, South America, Middle East & AfricaAsia-Pacific (50.2% share, 2025)Middle East & Africa (6.78% CAGR)


Market Segmentation Overview

By Type

Sub-SegmentKey Trend
MDIRigid-foam insulation dominance; ongoing capacity expansion in China and the Middle East
TDIStable growth tied to flexible-foam demand in bedding and automotive seating
AliphaticRapid adoption of UV-stable automotive and industrial coatings
Other TypesNiche specialty grades for elastomer and binder applications


MDI continues to anchor the type segmentation, accounting for the majority of global isocyanate consumption. Capacity additions by Wanhua and Sadara through 2028 will further consolidate the supply base in Asia and the Middle East, while aliphatic grades carve out a high-margin niche in performance coatings.

By Application

Sub-SegmentKey Trend
Rigid FoamConstruction insulation codes driving structural demand growth
Flexible FoamMattress-market expansion and automotive comfort seating
Paints and CoatingsShift toward two-component polyurethane topcoats in automotive OEM lines.
Adhesives and SealantsGrowing use of structural bonding for EVs and lightweight assemblies
ElastomersMining and industrial wheel applications are sustaining steady consumption.
BindersComposite wood and foundry applications with moderate growth
Other ApplicationsTextile finishing, medical-device coatings, and electronics encapsulation


Rigid foam and flexible foam together consume more than half of global isocyanate output, but the paints-and-coatings segment is where the highest incremental value growth will concentrate through 2035.

By End-User Industry

Sub-SegmentKey Trend
Building and ConstructionEnergy-performance mandates are expanding insulation specification rates globally.
AutomotiveEV lightweighting, battery encapsulation, and acoustic-dampening foams
HealthcareBiocompatible polyurethane foams for wound care and device encapsulation
FurnitureGlobal mattress-market growth supporting TDI-based flexible-foam demand.
Other End-UsersFootwear soles, mining equipment, and marine coatings


Building and construction remains the volume anchor, while the automotive end-user segment is transitioning from a growth-in-line-with-GDP profile to a structurally higher trajectory driven by electrification-related demand channels.