ID: MRFR/ICT/2170-CR
135 Pages
Aarti Dhapte
Last Updated: April 24, 2026
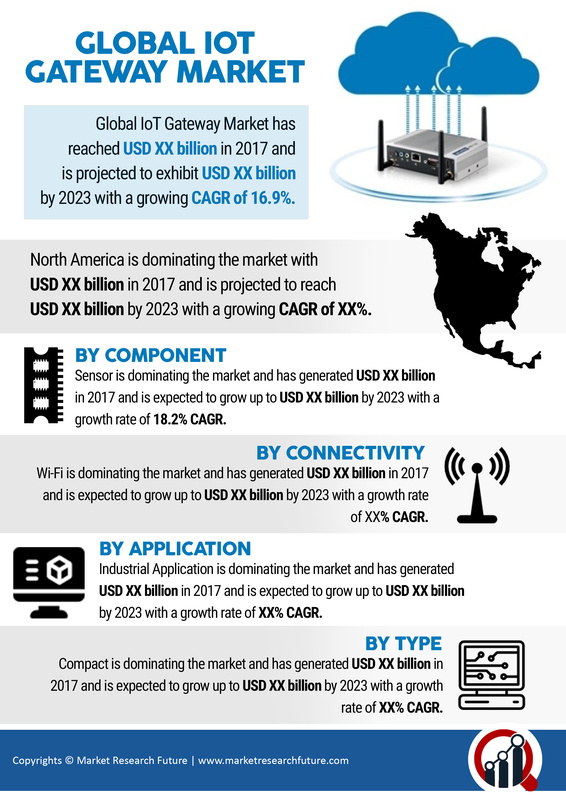
IoT Gateways Market Size, Share and Research Report: By Component (Processor, Sensor, Memory and Storage Device and other Components), Connectivity (Bluetooth, WI-Fi, ZigBee, Ethernet, Cellular and Others), End-User (Automotive and Transportation, Healthcare, Industrial, Consumer Electronics, BFSI, Oil and Gas, Retail, Aerospace and Defense and Other End-Users), and By Region (Asia-Pacific, North America, Europe, and Rest of the World) - Forecast till 2035