Healthcare Market Segmentation
Healthcare By Product Type (USD Billion, 2025-2035)
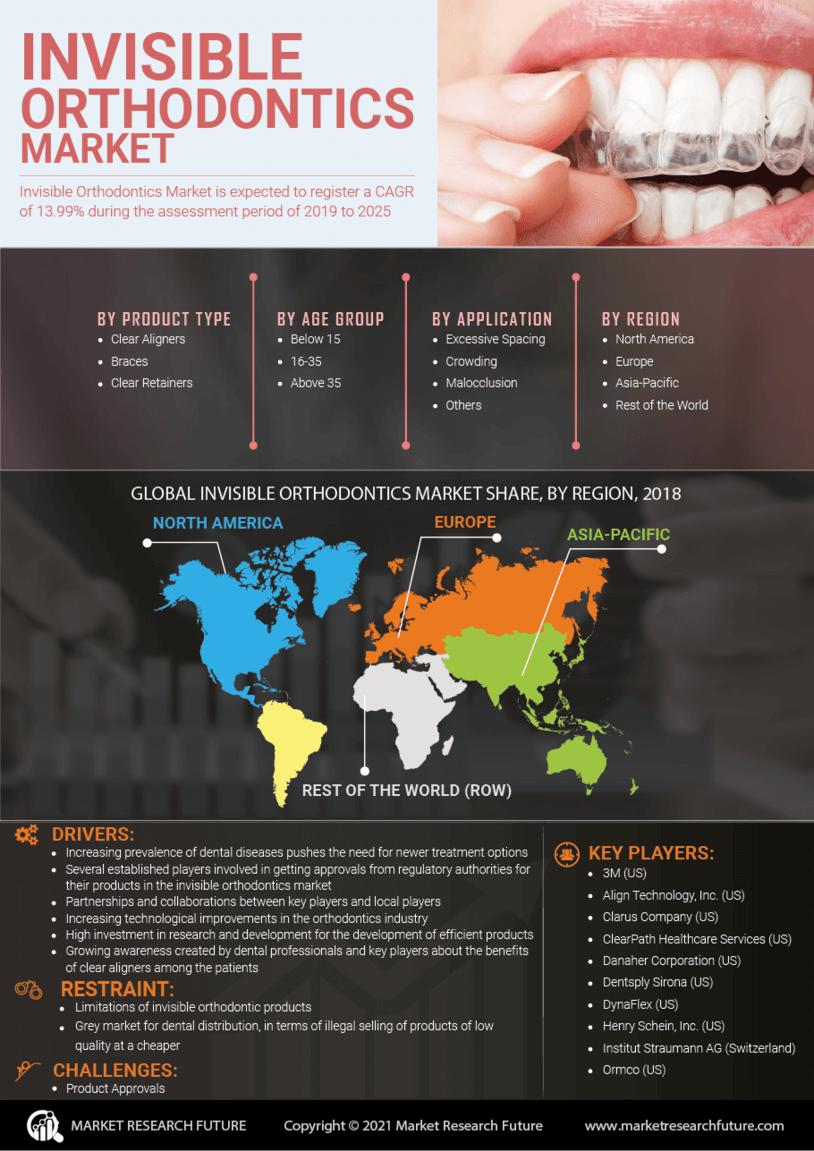
- Aligners
- Lingual Braces
- Retainers
Healthcare By Age Group (USD Billion, 2025-2035)
- Children
- Teenagers
- Adults
Healthcare By Treatment Type (USD Billion, 2025-2035)
- Cosmetic Orthodontics
- Functional Orthodontics
- Preventive Orthodontics
Healthcare By Distribution Channel (USD Billion, 2025-2035)
- Online
- Dental Clinics
- Hospitals