


Intraoral Cameras Size
Market Size Snapshot
| Year | Value |
|---|---|
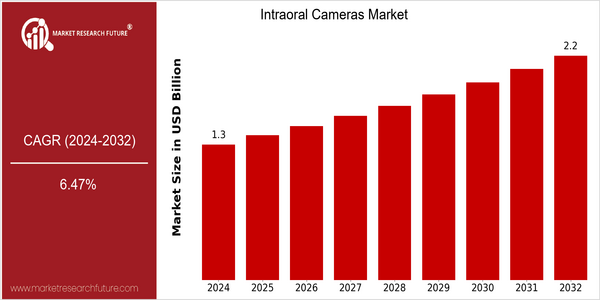
| 2024 | USD 1.33 Billion |
| 2032 | USD 2.2 Billion |
| CAGR (2024-2032) | 6.47 % |
Note – Market size depicts the revenue generated over the financial year
DENTAL CAMERAS ARE SET TO GROW TO RECORD MARKET VALUES. The dental camera market is expected to reach a size of $ 1.33 billion in 2024 and is expected to reach $ 2.12 billion by 2032. This represents a CAGR of 6.47% for the forecast period. The growing adoption of advanced dental technology and the increased focus on preventive dentistry are the main drivers of this growth. DENTAL CAMERAS ARE NOW ESSENTIAL TO THE WORLD OF TOBACCO. There are many reasons for the robust growth of the dental camera market. The integration of high-definition images and the real-time data transfer capabilities of dental cameras have improved their functionality and their attractiveness. The increasing prevalence of dental diseases and the growing awareness of oral hygiene are also driving the demand for dental cameras. The leading companies in the dental camera market, such as Carestream Dental, Dentsply Sirona and Planmeca, are launching new products and entering into strategic alliances to capture a larger market share. These activities not only reflect the competitiveness of the market, but also show the commitment of the leading companies to continue to drive the technological development of the dental care industry.
Regional Market Size
Regional Deep Dive
The intraoral camera market is experiencing significant growth in different regions, mainly driven by technological advancements in dental care, rising awareness about oral health, and the growing demand for minimally invasive procedures. In North America, the market is characterized by a high adoption of new dental technologies and a strong presence of key players. In Europe, the market is characterized by a diverse regulatory framework and a growing emphasis on preventive dental care. The Asia-Pacific market is characterized by high growth rates due to the increasing dental tourism and rising disposable incomes. Middle East and Africa are adopting intraoral cameras gradually, influenced by the improving health care systems. Latin America is also a potential market, characterized by a growing awareness of oral health and technological advancements.
Europe
- The European market is witnessing a surge in demand for high-definition intraoral cameras, with companies such as Planmeca and Sirona Dental Systems introducing advanced imaging technologies that improve patient experience and treatment outcomes.
- The European Union's focus on improving dental care standards is driving investments in dental technology, with various government programs supporting the adoption of digital tools in dental practices.
Asia Pacific
- Countries like Japan and Australia are at the forefront of adopting intraoral cameras, with local companies such as Morita and 3M leading innovations that cater to the unique needs of their markets.
- The rise of dental tourism in countries like Thailand and Malaysia is boosting the demand for intraoral cameras, as clinics seek to enhance their service offerings and attract international patients.
Latin America
- Brazil is emerging as a key player in the intraoral cameras market, with local manufacturers developing cost-effective solutions tailored to the needs of the region's dental practices.
- The increasing prevalence of dental diseases in Latin America is driving demand for better diagnostic tools, leading to a rise in the adoption of intraoral cameras among dental professionals.
North America
- The integration of artificial intelligence in intraoral cameras is gaining traction, with companies like Carestream Dental and Dentsply Sirona leading the way in developing smart imaging solutions that enhance diagnostic accuracy.
- Regulatory changes in the U.S. are promoting the use of digital dental technologies, with the FDA providing clearer guidelines for the approval of intraoral cameras, thus encouraging innovation and market entry.
Middle East And Africa
- The Middle East is seeing increased investment in dental technology, with initiatives from organizations like the Dubai Health Authority promoting the adoption of advanced dental equipment, including intraoral cameras.
- In Africa, the growing number of dental schools and training programs is fostering a new generation of dentists who are more inclined to adopt modern technologies, including intraoral cameras, in their practices.
Did You Know?
“Did you know that intraoral cameras can capture images at a resolution of up to 20 megapixels, providing dentists with detailed visuals that enhance diagnostic capabilities?” — American Dental Association
Segmental Market Size
The intraoral camera segment plays an important role in enhancing diagnostics in the dental market, which is currently growing steadily. The trend towards less traumatic treatment methods and the growing importance of patient education are the main drivers. The real-time images that these cameras provide are an important means of improving the communication between dentists and patients. The latest developments in digital imaging technology are making these products more accessible and easier to use, further increasing their popularity. The current level of penetration of intraoral cameras in dental practices is at the stage of general acceptance. Carestream Dental and Dentsply Sirona are at the forefront of this process. Their primary applications are for routine examinations, treatment planning and patient education, where the visual aids have a significant impact on the understanding and engagement of patients. The growing importance of telemedicine and remote consultations, which were also accelerated by the COVID epidemic, are also contributing to the growth of the segment. In addition, digital developments, such as 3D images and the integration of artificial intelligence, are shaping the future of intraoral cameras and making them indispensable for modern dentistry.
Future Outlook
The INTER-ORAL CAMERA MARKET is slated to rise at a CAGR of 6.47% from 2024 to 2032, with a projected market size of $1.3 billion to $2.2 billion. The growth will be driven by the increased adoption of advanced dental technology, the rising awareness of oral health and the rising demand for minimally invasive diagnostic tools. The penetration of the device in dental practices is slated to rise and could reach 61% in 2032, up from an estimated 36% in 2024. In addition, the advancements in the resolution of intraoral camera systems, the development of real-time systems and the increasing trend towards digitalization will boost the growth of the market. In addition, the integration of artificial intelligence and machine learning in the camera systems will increase the functionality of the devices and help to improve the diagnostic accuracy and treatment planning. The rising trend of teledentistry, accelerated by the COVID 19 pandemic, will also drive the demand for intraoral cameras as practitioners opt for remote consultation and follow-ups. Moreover, supportive government policies and the rising expenditure on dental care will spur the growth of the market. Moreover, intraoral cameras are slated to become a standard tool in dental practices worldwide. The market will evolve and present opportunities for both manufacturers and dental practitioners.


Leave a Comment